 Fourplex
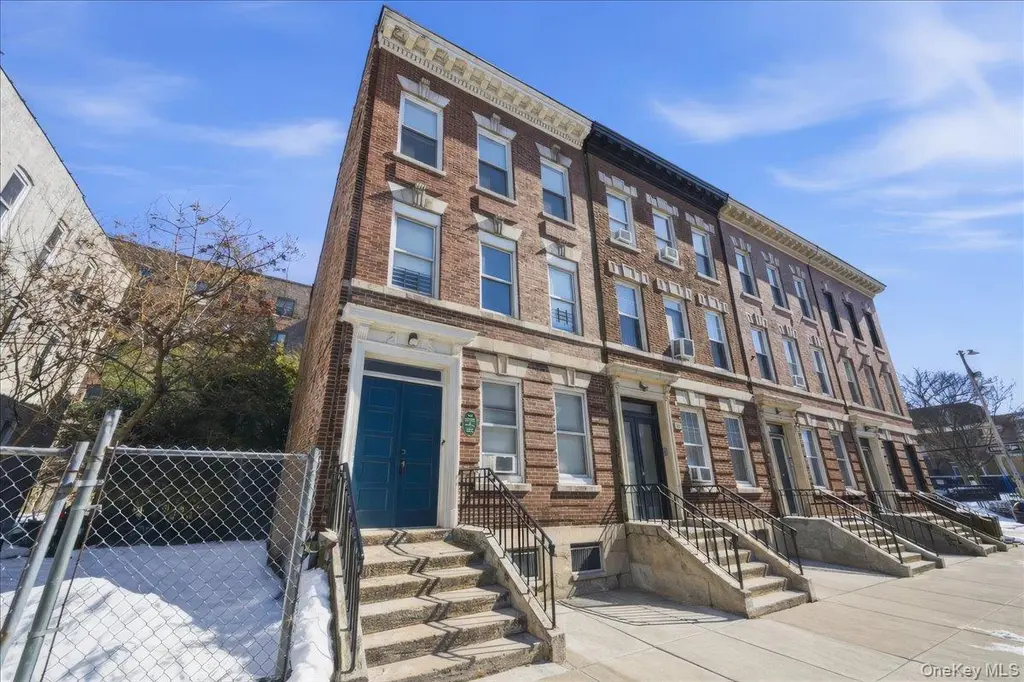
92 Elliott Ave · Yonkers, NY
Flood risk 7/10 · Major
- FEMA flood zone
- X (unshaded)
- Chance of flooding over 30 yrs
- 0.78%
- Est. flood insurance / yr
- $473 – $860
Fire risk 1/10 · Minimal
- Est. fire insurance / yr
- $691 – $1,283
Heat risk 6/10 · Moderate
- Hot days now (above 99°F)
- 7 days/yr
- Hot days in 30 yrs
- 15 days/yr
Wind risk 6/10 · Moderate
- Chance of severe wind over 30 yrs
- 27.0%
Air-quality risk 3/10 · Minor
- Unhealthy air days now
- 3 days/yr
- Unhealthy air days in 30 yrs
- 4 days/yr
Risk factors via First Street. Map © Google.
Why this score? — see what drove the D+ grade
The composite is a weighted blend of 9 inputs, each scored 0–100. Each bar is that input's sub-score; the figure is the points it added to the 100-point composite (weight × sub-score).
- Cash flow +15.1/30.0
- ARV discount +8.3/15.0
- Rent growth +4.8/5.0
- DSCR +4.6/10.0
- 1% rule +4.2/10.0
- Schools +4.1/10.0
- Livability +3.4/5.0
- Condition / age +2.5/5.0
- Appreciation +0.0/10.0
$1,499,999
🖨 Deal sheet (PDF) 📄 Offer letter ✓ Due diligence
Multi-family units
County records classify this as Multi-Family (5+ Unit). Listing-text estimate: 4 units. estimate disagrees with records
5+ unit building — per-unit beds/baths from public records are typically unavailable; the breakdown below (if shown) is an estimate from the listing text.
Listing remarks MLS
Projected 8% PRO-FORMA CAP RATE at list price!! Fully remodeled legal Four-Family property offering strong income potential and immediate upside. Priced to sell, this is an excellent opportunity for both investors and owner-occupants. Ideal for an investor seeking a strong addition to their portfolio / first investment property, Or a buyer looking to live in one unit while renting the other three. The building has been extensively updated providing modernized units and low-maintenance ownership. Each unit is separately metered for gas and electric, with tenants responsible for their own utilities while the landlord pays for water. Two units will be delivered vacant, offering the ability to immediately occupy or rent at current market rates, while the remaining two units are currently rented below market, create meaningful upside potential for increased income. With low property taxes and a convenient location near shops, schools, major parkways, public transportation, and easy access to NYC, this property presents a compelling opportunity for immediate cash flow and long-term investment potential. A remodeled, income-producing property ready for its next owner.
Key facts
- Modernized units
- 1,742 sq ft lot
- Built 1908
Tags
Neighborhood map
What this means for you Summary
Snapshot
- This is a 4 × 3-bed/1.2-bath units multifamily listed at $1.50M.
Deal economics
- At list price, monthly cash flow is $446 ($5k/yr) — positive. Per door: $111/mo.
- The deal already cash-flows at list — no discount required.
- To meet the 1% rule (rent ≥ 1% of price), the offer needs to be $1.38M (8.3% below list).
- Recommended offer: $1.36M (9.0% below list) — sets the bar for market timing.
- Cap rate 6.7% vs local median 5.4% in Yonkers — meaningfully above typical; check what's discounted (condition, days-on-market, listing class) to confirm the premium yield is real.
Location & tenants
- Location reads 68/100 on livability (#528 in NY) — a middle-class / working-renter tenant base. Strengths: employment A, commute B; Watch: amenities F, cost of living F.
- Yonkers City School District (suburban): math 41% / reading 54% proficiency, ranked #413 of 590 in NY (top 70%) — families likely to look elsewhere, expect single-tenant / working-renter base with shorter leases; 64% free/reduced lunch — lower-income household profile, screen leases tightly.
- Market conditions: Rents rising fast (+9.0%/yr); 87 active listings in the ZIP; 954 units permitted in Westchester County in 2024 (649 in 5+ unit buildings).
- At $13,756/mo this rent would consume 243% of the median local household income ($68k/yr) (locally 2783% of renters already pay >50% of income on rent) — very limited rent-growth headroom before tenants either downsize or default.
Forward outlook
- Local home prices are declining (-3.0%/yr); year-one equity from $10k of loan paydown is wiped out by about $45k of value loss. Plan a longer hold.
- Westchester County population projected at +10% by 2050 — modest demand growth; plan on rents tracking national, not racing it.
Negotiation context
- It's been on market 108 days — a 9% lower offer ($1.36M) is reasonable based on typical stale-listing flexibility.
- 7 sale attempts since 26y ago with the ask held roughly flat each time — persistent listings suggest the price (not the market) is what's stuck; bring a comps-based counter.
- Current owner paid $270k; list at $1.50M implies a 456% gain — meaningful room to come down on a strong offer.
Risks & watch-outs
- Watch-outs: flood insurance adds $56/mo; built in 1908 — expect roof / HVAC / electrical / plumbing capex.
- Climate carrying-cost: major flood risk; major wind risk, 27% chance of damaging wind over 30y; extreme-heat days projected 7→15/yr by 2055 (HVAC capex compounding) — expect insurance premiums to compound above CPI over the hold.
Questions for the listing agent
- It's been on market 108 days. Have you received any prior offers? Is the seller open to a 9% concession, seller financing, or rate buy-down credit?
- Can we see the unit-by-unit rent roll, current vacancy, and any below-market leases? What's the average tenancy length?
- What capital expenditures (roof, boiler, parking lot, exteriors) have been made in the last 5 years, and what's planned in the next 2?
- Built in 1908 — when were the roof, HVAC, electrical panel, plumbing, and water heater last replaced?
- What's the actual annual flood-insurance premium (NFIP or private), and is the property in a SFHA with mandatory coverage?
- Why hasn't it sold? Are there any deal-killer items the seller is aware of (foundation, flood, title, zoning, code violations)?
- Is there a deadline driving the sale (1031 exchange, divorce, estate, relocation)? That informs how much negotiation room exists.
- The area grade is low — what's the realistic commute time and amenity access for the typical tenant pool here? Any planned neighborhood developments (good or bad) we should know about?
- What's the average days-on-market for RENTAL listings here right now (not sales)? A rising rental-DOM trend means longer vacancies and softer asking-rent achievability than the comps imply.
- What's the recent tenant-quality profile in this submarket — average credit score on applications, eviction rate, late-payment / NSF rate, and stable-employment percentage? A property-management company in the area should have these aggregated.
- How much new apartment / multifamily construction is in the pipeline within 1–3 miles? Heavy new supply (>2% of stock underway) typically softens rents 12–24 months out; light construction supports rent growth.
Investment metrics
- 1% rule
- 0.92% ✗
- Cap rate
- 6.69%
- Cash-on-cash
- 1.43%
- DSCR
- 1.06
- GRM
- 9.1
CMA / ARV
- ARV (median comp)
- $1,527,138
- List price
- $1,499,999
- Delta
- -1.78%
- Verdict
- FAIR
- Comps
- 20 within 1.0 mi
Show comp detail 1 sale within ~0.75 mi
| Address | Dist | Beds/Ba | Sqft | Sold | Price | $/sf | Match |
|---|---|---|---|---|---|---|---|
| 376 Hawthorne Ave | 0.34mi | 11/4.0 (-1) | 4,200 (-8%) | 9mo | $1,300,000 | $310 | 56 |
Match score weights: distance 35% · size 25% · config 20% · recency 20%. Top-matched comps best support the ARV.
Projected returns pro-forma
-3.0% appreciation · 8.0% rent growth · sell at horizon
- IRR
- -8.8%
- Equity multiple
- 0.66×
- Total profit
- $-141,748
- Equity at exit
- $223,655
- IRR
- 6.4%
- Equity multiple
- 1.58×
- Total profit
- $244,965
- Equity at exit
- $129,692
Cash invested: $420,000 (down + closing). Projections, not guarantees.
Landlord ↔ Tenant lean methodology
- Overall (CITY)
- 5 Strongly Tenant-Friendly
- State New York
- 15 Strongly Tenant-Friendly · D+10
- County
- — inherits STATE
- City Yonkers
- 5 Strongly Tenant-Friendly · D+20
ZIP-level market 10705
- Rents YoY
- 9.0%
- Active inventory
- 87
- Price-to-rent
- 36.3×
Monthly cashflow live
- Estimated rent
- $13,756 high interval (Pro) →
- Mortgage (P&I)
- −$7,866
- Tax est. 1.5%
- −$1,875 /mo · $22,500/yr
- Insurance
- −$625
- Flood insurance flood zone
- −$56 /mo · $666/yr
- HOA
- −$0
- Vacancy / Maint / Mgmt
- −$2,889
- Net cashflow
- $446
Break-even live
Sensitivity live
| Price | -10% $1,482 | -5% $964 | +0% $446 | +5% $-73 | +10% $-591 |
|---|---|---|---|---|---|
| Rent | -10% $-641 | -5% $-98 | +0% $446 | +5% $989 | +10% $1,532 |
| Rate | -1.0pp $1,201 | -0.5pp $827 | base $446 | +0.5pp $57 | +1.0pp $-339 |
4-unit breakdown (identical units grouped — click to expand)
| Units | Beds | Baths | Est. rent |
|---|---|---|---|
| 4× units | 3 | 1.2 | $13,756 |
| #1 | 3 | 1.2 | $3,439 |
| #2 | 3 | 1.2 | $3,439 |
| #3 | 3 | 1.2 | $3,439 |
| #4 | 3 | 1.2 | $3,439 |
| Total (4 units) | $13,756 | ||
UW: 25.0% down · 7.5% · 30yr · 1.5% tax · 5.0% vac · 8.0% maint · 8.0% mgmt
Financing live
Cash to close
- Down payment
- $375,000
- Closing costs
- $45,000
- Reserves months
- —
- Total cash needed
- —
Loan-product check · same deal, 3 products live
Conventional
25% down · 7.5% · 30yr
- Down + closing
- —
- Monthly P&I
- —
- Monthly cashflow
- —
- DSCR
- —
- Eligible?
- —
Personal DTI + credit; lowest rate.
DSCR
20% down · 8.5% · 30yr
- Down + closing
- —
- Monthly P&I
- —
- Monthly cashflow
- —
- DSCR
- —
- Eligible?
- —
No personal income docs; deal must DSCR.
Hard money
10% down · 12.0% · 12mo
- Down + closing
- —
- Monthly P&I
- —
- Monthly cashflow
- —
- DSCR
- —
- Eligible?
- —
Short-term bridge; refi at stabilization.
Listing history 37 events
-
2026-06-21days on market $1,499,999 Active 108 DOM
-
2026-06-18days on market $1,499,999 Active 105 DOM
-
2026-06-17days on market $1,499,999 Active 104 DOM
-
2026-06-16days on market $1,499,999 Active 103 DOM
-
2026-06-15days on market $1,499,999 Active 102 DOM
-
2026-06-13days on market $1,499,999 Active 100 DOM
-
2026-06-09days on market $1,499,999 Active 96 DOM
-
2026-06-08days on market $1,499,999 Active 95 DOM
-
2026-06-07days on market $1,499,999 Active 94 DOM
-
2026-06-04days on market $1,499,999 Active 91 DOM
-
2026-06-03days on market $1,499,999 Active 90 DOM
-
2026-06-02days on market $1,499,999 Active 89 DOM
-
2026-06-01days on market $1,499,999 Active 88 DOM
-
2026-05-31days on market $1,499,999 Active 87 DOM
-
2026-03-03$1,499,999 Active 1179-char remark
Show marketing remark (1179 chars)
Projected 8% PRO-FORMA CAP RATE at list price!! Fully remodeled legal Four-Family property offering strong income potential and immediate upside. Priced to sell, this is an excellent opportunity for both investors and owner-occupants. Ideal for an investor seeking a strong addition to their portfolio / first investment property, Or a buyer looking to live in one unit while renting the other three. The building has been extensively updated providing modernized units and low-maintenance ownership. Each unit is separately metered for gas and electric, with tenants responsible for their own utilities while the landlord pays for water. Two units will be delivered vacant, offering the ability to immediately occupy or rent at current market rates, while the remaining two units are currently rented below market, create meaningful upside potential for increased income. With low property taxes and a convenient location near shops, schools, major parkways, public transportation, and easy access to NYC, this property presents a compelling opportunity for immediate cash flow and long-term investment potential. A remodeled, income-producing property ready for its next owner.
-
2007-10-05soldstatus $270,000
-
2006-06-05soldstatus $574,468
-
2006-05-23historical
-
2006-05-23historical
-
2006-03-30
-
2006-03-06
-
2006-01-22historical
-
2005-09-22
-
2005-09-19soldstatus $540,000
-
2005-09-19price $575,000
-
2004-06-05$540,000
-
2004-01-29soldstatus $340,000
-
2003-08-15soldstatus $340,000
-
2003-06-27historical
-
2003-06-27price $425,000
-
2003-05-06$340,000
-
2002-01-04soldstatus $273,000
-
2001-10-18soldstatus $260,000
-
2001-07-02historical
-
2001-07-02price $275,000
-
2000-08-23$260,000
-
1997-01-28soldstatus $61,000
ⓘ Source: listings_history table (triggers on properties + properties_extension) + one-shot
backfill from property_details.listing_events for pre-trigger history.
Climate risk First Street
- Flood 7/10 Severe FEMA zone X (unshaded) · 78% chance over 30 yrs
- Wildfire 1/10 Low
- Heat 6/10 Major 7 d/yr ≥99°F today · 15 d/yr by 30 yrs out
- Wind 6/10 Major 27% chance of damaging wind over 30 yrs
- Air quality 3/10 Moderate 3 unhealthy d/yr today · 4 by 30 yrs out
Nearby sold comps map
Loading sold comps map…
Walkable amenities ~0.75 mi
Loading nearby amenities…
Taxation est. · year 1
- Rental income
- $165,072
- − Mortgage interest
- −$84,023
- − Property taxes
- −$22,500
- − Insurance
- −$8,166
- − Repairs & maintenance
- −$13,206
- − Management
- −$13,206
- − Depreciation
- −$43,636
- Taxable loss
- −$19,666
- Est. tax savings @ 24.0%
- +$4,720
- After-tax cash flow
- $10,066/yr
For passive investors: Depreciation is non-cash, so a rental often shows a tax loss while cash-flowing — sheltering income. Rental losses are passive: they offset passive income freely, and up to $25,000/yr can offset ordinary (W-2) income if you actively participate and your MAGI is under $100k (phasing out to $0 by $150k); unused losses carry forward. On sale, claimed depreciation is recaptured at up to 25%, and gains may owe capital-gains tax (a 1031 exchange can defer both). Figures are a year-1 estimate at your 24.0% rate — not tax advice; consult a CPA.
Schools (NCES district)
- District
- Yonkers City School District
- NCES district ID
- 3631920
- Math proficiency
- 41% ▼ -1.00%
- Reading proficiency
- 54% ▲ 14.00%
- Median HH income
- $58,042
- Composite
- 41.43/100
- National rank
- #3471
- State rank
- #413 of 590 in NY
Livability — Yonkers
- Score
- 68/100
- State rank
- #528
- US rank
- #9394
Category grades
Schools grade is shown separately in the Schools card above.
Census & demographics
- Census place
- Yonkers, NY
- County
- Westchester County · 709,332 people
- City population
- 212,407
- Metro
- New York-Newark-Jersey City, NY-NJ-PA
- Population (ZIP)
- 38,887
- Household income
- $67,918
- Rent vs Own
- Severe rent burden
- 2783.0
Population outlook (Westchester County) Hauer SSP2
- Today (2025)
- 1,028,035 people
- By 2030
- 1,051,636 · +2.3%
- By 2040
- 1,098,520 · +6.9%
- By 2050
- 1,136,044 · +10.5%
- By 2075
- 1,196,925 · +16.4%
- By 2100
- 1,175,147 · +14.3%
Race, ethnicity, and origin ACS 2023
- Neighborhood character
- Diverse neighborhood (Simpson 0.56)
- Race & ethnicity
- Hispanic / Latino 62% White 17% Two or more races 16% Black 12% Asian 5% Native American 1%
- Hispanic origin (detail)
- Mexican 13% Puerto Rican 9% Dominican 27%
- Common ancestry
- Scotch-Irish 1% Romanian 1%
- Foreign-born
- 40% · Canada, Jamaica, South Korea
- Languages at home
- 39% English-only · Spanish 51% Other Indo-European 3% Other Asian/Pacific 2%
Political lean MEDSL · Westchester
- 2024 margin
- Strong D (+26.3) · D 63.1% · R 36.9%
- 2008→2024 swing
- -1.3pp toward R · 2008: 27.6pp · 2024: 26.3pp
- All cycles
- 2024: D+26.3 2020: D+36.3 2016: D+32.8 2012: D+22.2 2008: D+27.6
Not yet ingested
- Civics
- —
Market trends
- HPI YoY
- ▼ -368.22%
- Current HPI
- 314.1777
- Rent YoY
- ▲ 9.00%
- Metro
- New York-Newark-Jersey City, NY-NJ-PA
- State GDP YoY
- ▲ 2.60%
- F500 in state
- 92
Industry mix (Fortune 500 HQ in NY)
| Industry | F500 HQs | Revenue |
|---|---|---|
| Financial Services | 10 | $950B |
|
||
| Consumer Goods | 9 | $162B |
|
||
| Insurance | 4 | $225B |
|
||
| Telecommunications | 2 | $144B |
|
||
| Pharmaceuticals | 2 | $112B |
|
||
| Media / Entertainment | 2 | $69B |
|
||
Price history
+2359.0% since first listed23 events — show timeline
- 2026-03-03 Listed $1,499,999 OneKey® MLS as Distributed by MLS Grid
- 2007-10-05 Sold (Public Records) $270,000 Public Records
- 2006-06-05 Sold (Public Records) $574,468 Public Records
- 2006-05-23 Delisted — HGMLS
- 2006-05-23 Delisted — HGMLS
- 2006-03-30 Listed — HGMLS
- 2006-03-06 Listed — HGMLS
- 2006-01-22 Delisted — HGMLS
- 2005-09-22 Listed — HGMLS
- 2005-09-19 Price Changed $575,000 HGMLS
- 2005-09-19 Sold (MLS) $540,000 HGMLS
- 2004-06-05 Listed $540,000 HGMLS
- 2004-01-29 Sold (Public Records) $340,000 Public Records
- 2003-08-15 Sold (MLS) $340,000 HGMLS
- 2003-06-27 Price Changed $425,000 HGMLS
- 2003-06-27 Delisted — HGMLS
- 2003-05-06 Listed $340,000 HGMLS
- 2002-01-04 Sold (Public Records) $273,000 Public Records
- 2001-10-18 Sold (MLS) $260,000 HGMLS
- 2001-07-02 Price Changed $275,000 HGMLS
- 2001-07-02 Delisted — HGMLS
- 2000-08-23 Listed $260,000 HGMLS
- 1997-01-28 Sold (Public Records) $61,000 Public Records
Property tax history
-20.8%/yrLatest (2025): $2,781 · +0.5% YoY. Source: county tax records.
Cash-flow waterfall
monthlySold comps — $/sqft
last 12 mo · ≤1 miLoading sold comps…