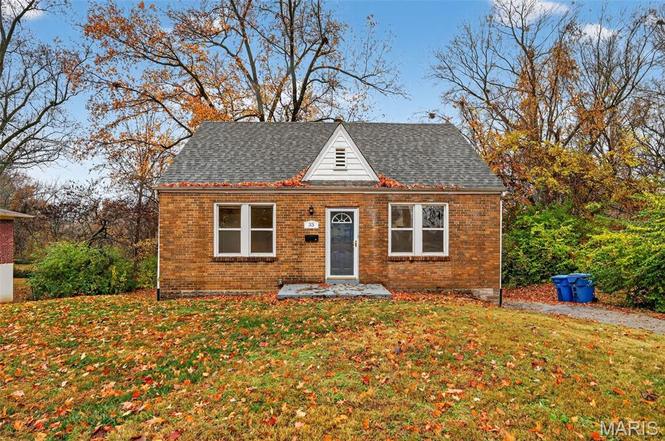
33 S Schlueter Ave · Dellwood, MO
Flood risk 1/10 · Minimal
- FEMA flood zone
- X (unshaded)
- Chance of flooding over 30 yrs
- 0.0%
- Est. flood insurance / yr
- $473 – $860
Fire risk 1/10 · Minimal
- Est. fire insurance / yr
- $1,054 – $1,958
Heat risk 4/10 · Minor
- Hot days now (above 106°F)
- 6 days/yr
- Hot days in 30 yrs
- 19 days/yr
Wind risk 2/10 · Minimal
- Chance of severe wind over 30 yrs
- 1.0%
Air-quality risk 4/10 · Minor
- Unhealthy air days now
- 4 days/yr
- Unhealthy air days in 30 yrs
- 5 days/yr
Risk factors via First Street. Map © Google.
Why this score? — see what drove the B+ grade
The composite is a weighted blend of 9 inputs, each scored 0–100. Each bar is that input's sub-score; the figure is the points it added to the 100-point composite (weight × sub-score).
- Cash flow +30.0/30.0
- ARV discount +15.0/15.0
- 1% rule +10.0/10.0
- DSCR +10.0/10.0
- Rent growth +4.8/5.0
- Livability +3.3/5.0
- Condition / age +2.5/5.0
- Schools +1.2/10.0
- Appreciation +0.0/10.0
$84,900
🖨 Deal sheet 📄 Offer letter ✓ Due diligence
Listing remarks
Set on a spacious lot surrounded by mature trees, this charming brick home blends classic character with modern updates. Inside, you'll find freshly painted walls, beautifully refinished hardwood floors, and ample natural light throughout. The main living area is warm and inviting, while the adjacent dining space and kitchen feature white cabinetry, a tile backsplash, and black appliances for a clean, updated look. A bright sunroom with exposed brick and large windows offers a perfect flex space overlooking the backyard. Upstairs, dormer windows add charm to the additional rooms, and the lower level includes a large, unfinished basement with plenty of storage or workshop potential. A detach
Key facts
- Ample natural light
- Spacious lot
- Brick home
Tags
Neighborhood map
What this means for you Summary
Snapshot
- This is a 4-bed/1.0-bath single-family listed at $85k.
Deal economics
- At list price, monthly cash flow is $543 ($7k/yr) — positive.
- The deal already cash-flows at list — no discount required.
- Meets the 1% rule at list price ($2k rent vs $85k).
- Recommended offer: $77k (9.0% below list) — sets the bar for market timing.
- Cap rate 14.0% vs local median 10.4% in Dellwood — top-decile yield for the area; either an underpriced asset or a hidden risk that comps aren't pricing in. Stress-test before assuming the spread holds.
Location & tenants
- Location reads 66/100 on livability (#239 in MO) — a middle-class / working-renter tenant base. Strengths: cost of living A+, housing A+; Watch: health & safety C-, crime D-, amenities F.
- Ferguson-Florissant R-II (suburban): math 7% / reading 20% proficiency, ranked #311 of 324 in MO (top 96%) — low school quality limits family demand, transient renter base, plan for 1-2y turnover; 70% free/reduced lunch — lower-income household profile, screen leases tightly.
- Zoned schools: Griffith Elementary (math 3% / reading 9%, grade F, #1,069 of 1,115 statewide, top 96%, 282 students, 99% FRL); Mccluer High (math 0% / reading 17%, grade F, #511 of 521 statewide, top 98%, 1,181 students, 100% FRL) — zoned schools average 99% FRL vs 70% district-wide (30 pts higher); higher-poverty schools than district average — tighter screening recommended.
- Market conditions: Rents rising fast (+9.0%/yr); 162 active listings in the ZIP; 40 comparable units currently listed for rent nearby; rentals at typical pace (median 24d on market — plan ~3-4 weeks tenant-placement turnaround); 40% of comp listings sitting > 30 days — soft ceiling on asking rent; 920 units permitted in St. Louis County in 2024 (250 in 5+ unit buildings).
- This rent runs 35% of the median local income ($52k/yr) — at the standard rent-burdened threshold; future hikes will face affordability resistance.
Forward outlook
- Local home prices are declining (-3.0%/yr); year-one equity from $587 of loan paydown is wiped out by about $3k of value loss. Plan a longer hold.
- At projected returns (-3.0% appreciation + 8.0% rent growth), your $24k cash investment doubles in ~4 years — after that, you're playing with house money.
Negotiation context
- It's been on market 110 days — a 9% lower offer ($77k) is reasonable based on typical stale-listing flexibility.
- 6 sale attempts since 6y ago; this cycle's ask has dropped $30k (26%) from the opening price — seller is motivated, your offer sets the floor, not the list.
- Current owner paid $53k; list at $85k implies a 60% gain — meaningful room to come down on a strong offer.
Risks & watch-outs
- Watch-outs: built in 1941 — expect roof / HVAC / electrical / plumbing capex.
Questions for the listing agent
- It's been on market 110 days. Have you received any prior offers? Is the seller open to a 9% concession, seller financing, or rate buy-down credit?
- Built in 1941 — when were the roof, HVAC, electrical panel, plumbing, and water heater last replaced?
- Why hasn't it sold? Are there any deal-killer items the seller is aware of (foundation, flood, title, zoning, code violations)?
- Is there a deadline driving the sale (1031 exchange, divorce, estate, relocation)? That informs how much negotiation room exists.
- Schools are D-rated, which usually means shorter tenancies and higher turnover. Who's the typical renter profile here, and what's been the actual vacancy rate?
- Crime grade is D in this area — have there been break-ins, vandalism, or insurance claims at this property in the last 3 years? What carrier currently insures it and at what premium?
- What's the average days-on-market for RENTAL listings here right now (not sales)? A rising rental-DOM trend means longer vacancies and softer asking-rent achievability than the comps imply.
- What's the recent tenant-quality profile in this submarket — average credit score on applications, eviction rate, late-payment / NSF rate, and stable-employment percentage? A property-management company in the area should have these aggregated.
- How much new for-sale + rental construction is in the pipeline within 1–3 miles? Heavy new supply typically softens prices + rents 12–24 months out; constrained supply supports both.
Investment metrics
- 1% rule
- 1.77% ✓
- Cap rate
- 13.97%
- Cash-on-cash
- 27.43%
- DSCR
- 2.22
- GRM
- 4.7
CMA / ARV
- ARV (on-the-fly)
- $138,180
- Comps found
- 12
Show comp detail 12 sales within ~0.75 mi
| Address | Dist | Beds/Ba | Sqft | Sold | Price | $/sf | Match |
|---|---|---|---|---|---|---|---|
| 1325 Kappel Dr | 0.23mi | 3/1.0 (-1) | 1,414 (+0%) | 2mo | $139,000 | $98 | 82 |
| 4 Dunmore Ct | 0.25mi | 4/1.0 | 1,391 (-1%) | 6mo | $174,900 | $126 | 81 |
| 1330 Chambers Rd | 0.15mi | 3/2.0 (-1) | 1,339 (-5%) | 3mo | $139,900 | $104 | 73 |
| 38 Bayview Ct | 0.26mi | 3/1.0 (-1) | 1,472 (+4%) | 4mo | $124,900 | $85 | 72 |
| 312 Ward Dr | 0.48mi | 3/2.0 (-1) | 1,375 (-2%) | 1mo | $145,000 | $105 | 64 |
| 274 Dashwood Dr | 0.48mi | 3/1.0 (-1) | 1,454 (+3%) | 5mo | $139,900 | $96 | 63 |
| 1221 Thatcher Ave | 0.61mi | 4/2.0 | 1,462 (+4%) | 4mo | $159,900 | $109 | 58 |
| 9833 Dennis Dr | 0.46mi | 3/1.0 (-1) | 1,572 (+12%) | 4mo | $34,900 | $22 | 51 |
| 910 Cheri Heights Ct | 0.34mi | 3/3.0 (-1) | 1,224 (-13%) | 6mo | $155,000 | $127 | 44 |
| 536 Ames Pl | 0.68mi | 3/1.5 (-1) | 1,304 (-8%) | 5mo | $69,900 | $54 | 44 |
| 905 Roussilon Ct | 0.70mi | 3/2.0 (-1) | 1,566 (+11%) | 2mo | $49,900 | $32 | 38 |
| 926 Westwold Ave | 0.73mi | 4/2.0 | 1,597 (+13%) | 5mo | $149,900 | $94 | 35 |
Match score weights: distance 35% · size 25% · config 20% · recency 20%. Top-matched comps best support the ARV.
Projected returns pro-forma
-3.0% appreciation · 8.0% rent growth · sell at horizon
- IRR
- 27.3%
- Equity multiple
- 2.21×
- Total profit
- $28,866
- Equity at exit
- $12,659
- IRR
- 37.9%
- Equity multiple
- 5.47×
- Total profit
- $106,167
- Equity at exit
- $7,341
Cash invested: $23,772 (down + closing). Projections, not guarantees.
Landlord ↔ Tenant lean methodology
- Overall (STATE)
- 81 Strongly Landlord-Friendly
- State Missouri
- 81 Strongly Landlord-Friendly · R+10
- County
- — inherits STATE
- City
- — inherits STATE
ZIP-level market 63135
- Rents YoY
- 9.0%
- Active inventory
- 162
- Price-to-rent
- 4.7×
Monthly cashflow live
- Estimated rent
- $1,506 high interval (Pro) →
- Mortgage (P&I)
- −$445
- Tax from tax record
- −$166 /mo · $1,993/yr
- Insurance
- −$35
- HOA
- −$0
- Vacancy / Maint / Mgmt
- −$316
- Net cashflow
- $543
Break-even live
UW: 25.0% down · 7.5% · 30yr · 1.5% tax · 5.0% vac · 8.0% maint · 8.0% mgmt
Financing live
Cash to close
- Down payment
- $21,225
- Closing costs
- $2,547
- Reserves months
- —
- Total cash needed
- —
Loan-product check · same deal, 3 products live
Conventional
25% down · 7.5% · 30yr
- Down + closing
- —
- Monthly P&I
- —
- Monthly cashflow
- —
- DSCR
- —
- Eligible?
- —
Personal DTI + credit; lowest rate.
DSCR
20% down · 8.5% · 30yr
- Down + closing
- —
- Monthly P&I
- —
- Monthly cashflow
- —
- DSCR
- —
- Eligible?
- —
No personal income docs; deal must DSCR.
Hard money
10% down · 12.0% · 12mo
- Down + closing
- —
- Monthly P&I
- —
- Monthly cashflow
- —
- DSCR
- —
- Eligible?
- —
Short-term bridge; refi at stabilization.
Rent comps 40 comps
| Address | Beds | Baths | Sqft | Rent | $/sqft | DOM | Units | Dist |
|---|---|---|---|---|---|---|---|---|
| 104 Fenwick Dr Saint Louis, MO | 3.0 | 1.0 | 960 | $1,250 | $1.30 | 23d | 1 | 0.18mi |
| 945 Edgehill Dr Saint Louis, MO | 3.0 | 1.0 | 1110 | $1,575 | $1.42 | 43d | 1 | 0.38mi |
| 9845 Dennis Dr Saint Louis, MO | 3.0 | 1.0 | 960 | $1,550 | $1.61 | 12d | 1 | 0.47mi |
| 227 Meadowcrest Dr Saint Louis, MO | 3.0 | 1.0 | 960 | $1,500 | $1.56 | 43d | 1 | 0.49mi |
| 13 N Hartnett Ave Saint Louis, MO | 3.0 | 1.0 | 1140 | $1,400 | $1.23 | 10d | 1 | 0.50mi |
| 307 Coppinger Dr Saint Louis, MO | 3.0 | 1.0 | 960 | $1,095 | $1.14 | 17d | 1 | 0.54mi |
| 249 S Hartnett Ave Saint Louis, MO | 3.0 | 1.0 | 960 | $1,220 | $1.27 | 23d | 1 | 0.58mi |
| 296 Meadowcrest Dr Saint Louis, MO | 3.0 | 1.0 | 960 | $1,550 | $1.61 | 14d | 1 | 0.58mi |
| 9717 Dennis Dr Saint Louis, MO | 3.0 | 1.0 | 1056 | $1,323 | $1.25 | 43d | 1 | 0.60mi |
| 9868 Lorna Ln Saint Louis, MO | 3.0 | 1.0 | 1032 | $1,175 | $1.14 | 43d | 1 | 0.61mi |
| 920 Hutton Pl Saint Louis, MO | 3.0 | 1.0 | 912 | $1,195 | $1.31 | 43d | 1 | 0.61mi |
| 9839 Medford Dr Saint Louis, MO | 3.0 | 1.0 | 912 | $1,095 | $1.20 | 43d | 1 | 0.64mi |
| 9750 Lorna Ln Saint Louis, MO | 3.0 | 1.0 | 1032 | $1,100 | $1.07 | 43d | 1 | 0.64mi |
| 9840 Medford Dr Saint Louis, MO | 3.0 | 1.0 | 912 | $1,095 | $1.20 | 43d | 1 | 0.67mi |
| 536 Ames Pl Saint Louis, MO | 4.0 | 1.5 | 1305 | $1,750 | $1.34 | 1d | 1 | 0.67mi |
| 9725 Medford Dr Saint Louis, MO | 3.0 | 1.0 | 912 | $1,485 | $1.63 | 43d | 1 | 0.70mi |
| 1654 Mowbry Ln Saint Louis, MO | 3.0 | 1.0 | 936 | $1,300 | $1.39 | 23d | 1 | 0.74mi |
| 1733 Kappel Ave Saint Louis, MO | 3.0 | 1.0 | 912 | $1,250 | $1.37 | 23d | 1 | 0.76mi |
| 401 Millman Dr Saint Louis, MO | 3.0 | 1.0 | 1008 | $1,450 | $1.44 | 16d | 1 | 0.77mi |
| 338 Saint Louis Ave Saint Louis, MO | 3.0 | 1.0 | 1200 | $1,200 | $1.00 | 43d | 1 | 0.92mi |
| 1547 Babcock Dr Saint Louis, MO | 3.0 | 1.0 | 1014 | $1,480 | $1.46 | 43d | 1 | 0.92mi |
| 10329 Chesley Dr Saint Louis, MO | 3.0 | 1.0 | 1014 | $1,350 | $1.33 | 23d | 1 | 0.96mi |
| 410 Robert Ave Ferguson, MO | 4.0 | 2.0 | 1471 | $2,000 | $1.36 | 11d | 1 | 0.99mi |
| 6188 Dupree Ave Saint Louis, MO | 3.0 | 1.5 | 972 | $1,300 | $1.34 | 43d | 1 | 1.00mi |
| 110 Paul Ave Saint Louis, MO | 3.0 | 1.0 | 875 | $1,050 | $1.20 | 7d | 1 | 1.01mi |
| 6170 Emerald Ave Saint Louis, MO | 3.0 | 1.0 | 1286 | $1,425 | $1.11 | 1d | 1 | 1.02mi |
| 6170 Emerald Ave Saint Louis, MO | 3.0 | 1.0 | 1286 | $1,500 | $1.17 | 14d | 1 | 1.02mi |
| 9812 Balboa Dr Saint Louis, MO | 4.0 | 2.0 | 1500 | $1,495 | $1.00 | 21d | 1 | 1.09mi |
| 9709 Balboa Dr Saint Louis, MO | 3.0 | 1.0 | 1000 | $1,600 | $1.60 | 43d | 1 | 1.09mi |
| 10304 Bon Oak Dr Saint Louis, MO | 3.0 | 1.5 | 1500 | $1,250 | $0.83 | 43d | 1 | 1.14mi |
| 1926 Chambers Rd Saint Louis, MO | 4.0 | 1.0 | 1095 | $995 | $0.91 | 14d | 1 | 1.14mi |
| 10078 Green Valley Dr Saint Louis, MO | 3.0 | 1.0 | 900 | $1,325 | $1.47 | 7d | 1 | 1.25mi |
| 1915 Green Valley Dr Saint Louis, MO | 4.0 | 2.0 | 1740 | $1,500 | $0.86 | 3d | 1 | 1.29mi |
| 324 Emmett Ave Saint Louis, MO | 3.0 | 2.0 | 1357 | $1,650 | $1.22 | 23d | 1 | 1.32mi |
| 10239 Green Valley Dr Saint Louis, MO | 3.0 | 1.0 | 1014 | $1,395 | $1.38 | 23d | 1 | 1.34mi |
| 846 Elsworth Pl Saint Louis, MO | 4.0 | 1.0 | 1352 | $1,600 | $1.18 | 4d | 1 | 1.34mi |
| 246 Louisa Ave Saint Louis, MO | 3.0 | 1.0 | 1036 | $1,600 | $1.54 | 43d | 1 | 1.35mi |
| 8824 Huiskamp Ave Saint Louis, MO | 4.0 | 1.0 | 1548 | $1,200 | $0.78 | 23d | 1 | 1.42mi |
| 10129 Cavalier Ct Saint Louis, MO | 3.0 | 1.5 | 912 | $1,250 | $1.37 | 23d | 1 | 1.47mi |
| 62 Capitol Hill Dr Saint Louis, MO | 3.0 | 2.0 | 1239 | $1,250 | $1.01 | 43d | 1 | 1.48mi |
Listing history 22 events
-
2026-04-24status Pending
-
2026-04-16price $84,900
-
2026-04-03price $94,900
-
2026-03-04status Active
-
2026-03-04price $99,900
-
2026-02-17status Pending
-
2026-01-16price $104,900
-
2026-01-15price $109,900
-
2026-01-15status Active
-
2025-12-29status Pending
-
2025-12-04$114,900 Active
-
2025-10-14price $101,900
-
2025-10-03price $110,400
-
2025-09-23$114,900 Active
-
2025-07-22price $119,900
-
2025-07-03price $124,900
-
2025-06-10$129,900 Active
-
2020-06-11soldstatus Closed
-
2020-05-01status Pending
-
2020-04-03$49,900 Active
-
1996-05-01soldstatus
-
1989-10-01soldstatus $53,000
ⓘ Source: listings_history table (triggers on properties + properties_extension) + one-shot
backfill from property_details.listing_events for pre-trigger history.
Tax reassessment forecast MO · Resets to sale price
- Current annual tax
- $1,993 · $166/mo
- Projected year-2 tax
- $1,993 · $166/mo
- Expected delta
- $0/yr ($0/mo · 0.0%)
ⓘ Screening estimate from a state-policy table — verify with the county assessor before closing.
Climate risk First Street
- Flood 1/10 Low FEMA zone X (unshaded) · 0% chance over 30 yrs
- Wildfire 1/10 Low
- Heat 4/10 Moderate 6 d/yr ≥106°F today · 19 d/yr by 30 yrs out
- Wind 2/10 Low 100% chance of damaging wind over 30 yrs
- Air quality 4/10 Moderate 4 unhealthy d/yr today · 5 by 30 yrs out
Nearby sold comps map
Loading sold comps map…
Walkable amenities ~0.75 mi
Loading nearby amenities…
Taxation est. · year 1
- Rental income
- $18,076
- − Mortgage interest
- −$4,756
- − Property taxes
- −$1,993
- − Insurance
- −$424
- − Repairs & maintenance
- −$1,446
- − Management
- −$1,446
- − Depreciation
- −$2,470
- Taxable income
- $5,541
- Est. tax owed @ 24.0%
- −$1,330
- After-tax cash flow
- $5,190/yr
For passive investors: Depreciation is non-cash, so a rental often shows a tax loss while cash-flowing — sheltering income. Rental losses are passive: they offset passive income freely, and up to $25,000/yr can offset ordinary (W-2) income if you actively participate and your MAGI is under $100k (phasing out to $0 by $150k); unused losses carry forward. On sale, claimed depreciation is recaptured at up to 25%, and gains may owe capital-gains tax (a 1031 exchange can defer both). Figures are a year-1 estimate at your 24.0% rate — not tax advice; consult a CPA.
Schools (NCES district)
- District
- Ferguson-Florissant R-II
- NCES district ID
- 2912010
- Math proficiency
- 7% ▼ -9.00%
- Reading proficiency
- 20% ▼ -6.00%
- Median HH income
- $44,610
- Composite
- 11.96/100
- National rank
- #9666
- State rank
- #311 of 324 in MO
Livability — Dellwood
- Score
- 66/100
- State rank
- #239
- US rank
- #11618
Category grades
Schools grade is shown separately in the Schools card above.
Census & demographics
- Census place
- Dellwood, MO
- County
- Saint Louis County · 888,823 people
- Metro
- St. Louis, MO-IL
- Population (ZIP)
- 18,381
- Household income
- $52,328
- Rent vs Own
- Severe rent burden
- 957.0
Population outlook (St. Louis County) Hauer SSP2
- Today (2025)
- 1,025,227 people
- By 2030
- 1,028,023 · +0.3%
- By 2040
- 1,020,940 · -0.4%
- By 2050
- 1,007,280 · -1.8%
- By 2075
- 987,277 · -3.7%
- By 2100
- 921,984 · -10.1%
Race, ethnicity, and origin ACS 2023
- Neighborhood character
- Predominantly Black (66%)
- Race & ethnicity
- Black 66% White 28% Two or more races 3% Hispanic / Latino 2%
- Common ancestry
- Lithuanian 1% Iranian 1% Romanian 1%
- Foreign-born
- 1% · Canada
- Languages at home
- 95% English-only · Spanish 4%
Political lean MEDSL · St. Louis
- 2024 margin
- Strong D (+23.4) · D 60.8% · R 37.4% · Other 1.7%
- 2008→2024 swing
- +3.5pp toward D · 2008: 19.9pp · 2024: 23.4pp
- All cycles
- 2024: D+23.4 2020: D+24.0 2016: D+16.2 2012: D+13.7 2008: D+19.9
Not yet ingested
- Civics
- —
Market trends
- HPI YoY
- ▼ -152.56%
- Current HPI
- 138.6781
- Rent YoY
- ▲ 9.03%
- Metro
- St. Louis, MO-IL
- State GDP YoY
- ▲ 1.84%
- F500 in state
- 20
Industry mix (Fortune 500 HQ in MO)
| Industry | F500 HQs | Revenue |
|---|---|---|
| Healthcare | 1 | $163B |
|
||
| Insurance | 1 | $21B |
|
||
| Industrial Technology | 1 | $17B |
|
||
| Retail | 1 | $16B |
|
||
| Industrial Distribution | 1 | $10B |
|
||
| Utilities | 1 | $9B |
|
||
Price history
+60.2% since first listed22 events — show timeline
- 2026-04-24 Pending — MARIS as Distributed by MLS Grid
- 2026-04-16 Price Changed $84,900 MARIS as Distributed by MLS Grid
- 2026-04-03 Price Changed $94,900 MARIS as Distributed by MLS Grid
- 2026-03-04 Relisted — MARIS as Distributed by MLS Grid
- 2026-03-04 Price Changed $99,900 MARIS as Distributed by MLS Grid
- 2026-02-17 Pending — MARIS as Distributed by MLS Grid
- 2026-01-16 Price Changed $104,900 MARIS as Distributed by MLS Grid
- 2026-01-15 Price Changed $109,900 MARIS as Distributed by MLS Grid
- 2026-01-15 Relisted — MARIS as Distributed by MLS Grid
- 2025-12-29 Pending — MARIS as Distributed by MLS Grid
- 2025-12-04 Listed $114,900 MARIS as Distributed by MLS Grid
- 2025-10-14 Price Changed $101,900 MARIS as Distributed by MLS Grid
- 2025-10-03 Price Changed $110,400 MARIS as Distributed by MLS Grid
- 2025-09-23 Listed $114,900 MARIS as Distributed by MLS Grid
- 2025-07-22 Price Changed $119,900 MARIS as Distributed by MLS Grid
- 2025-07-03 Price Changed $124,900 MARIS as Distributed by MLS Grid
- 2025-06-10 Listed $129,900 MARIS as Distributed by MLS Grid
- 2020-06-11 Sold (MLS) — MARIS as Distributed by MLS Grid
- 2020-05-01 Pending — MARIS as Distributed by MLS Grid
- 2020-04-03 Listed $49,900 MARIS as Distributed by MLS Grid
- 1996-05-01 Sold (Public Records) — Public Records
- 1989-10-01 Sold (Public Records) $53,000 Public Records
Property tax history
+10.7%/yrLatest (2022): $1,993 · +0.5% YoY. Source: county tax records.
Cash-flow waterfall
monthlySold comps — $/sqft
last 12 mo · ≤1 miLoading sold comps…