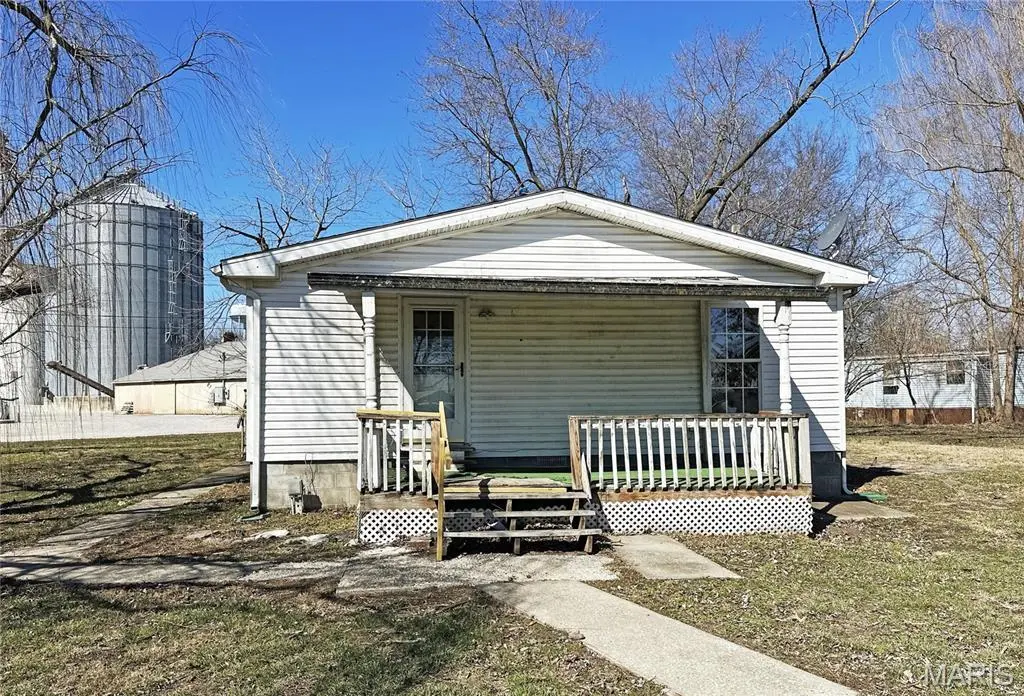
300 E Ellis St · Summerfield, IL
Flood risk 1/10 · Minimal
- FEMA flood zone
- X
- Chance of flooding over 30 yrs
- 0.0%
- Est. flood insurance / yr
- $507 – $1,088
Fire risk 1/10 · Minimal
- Est. fire insurance / yr
- $804 – $1,492
Heat risk 5/10 · Moderate
- Hot days now (above 106°F)
- 7 days/yr
- Hot days in 30 yrs
- 21 days/yr
Wind risk 2/10 · Minimal
- Chance of severe wind over 30 yrs
- 2.0%
Air-quality risk 2/10 · Minimal
- Unhealthy air days now
- 2 days/yr
- Unhealthy air days in 30 yrs
- 2 days/yr
Risk factors via First Street. Map © Google.
Why this score? — see what drove the B+ grade
The composite is a weighted blend of 9 inputs, each scored 0–100. Each bar is that input's sub-score; the figure is the points it added to the 100-point composite (weight × sub-score).
- Cash flow +30.0/30.0
- ARV discount +15.0/15.0
- 1% rule +10.0/10.0
- DSCR +10.0/10.0
- Appreciation +5.0/10.0
- Rent growth +2.5/5.0
- Condition / age +2.5/5.0
- Livability +2.4/5.0
- Schools +1.7/10.0
$54,950
🖨 Deal sheet 📄 Offer letter ✓ Due diligence
Listing remarks MLS
Spacious ranch style home on a double corner lot with a covered porch. Kitchen has island, skylight and lots of cabinets. Special features include: Open floor plan, vaulted ceilings, sky light, two full bathrooms, tile backsplash and deck. This home has lots of potential. Three bedrooms, two baths, kitchen with eating area opens into the family room. Easy to show, set your appointment today!
Key facts
- Covered porch
- Open floor plan
- Sky light
Tags
Neighborhood map
What this means for you Summary
Snapshot
- This is a 3-bed/2.0-bath single-family listed at $55k.
Deal economics
- At list price, monthly cash flow is $520 ($6k/yr) — positive.
- The deal already cash-flows at list — no discount required.
- Meets the 1% rule at list price ($1k rent vs $55k).
- Recommended offer: $50k (9.0% below list) — sets the bar for market timing.
Location & tenants
- Location reads 48/100 on livability (#1,345 in IL) — a working-class tenant base; expect higher turnover. Strengths: cost of living A+; Watch: schools F, crime D-, amenities F.
- Lebanon CUSD 9 (suburban): math 17% / reading 19% proficiency, ranked #446 of 620 in IL (top 72%) — low school quality limits family demand, transient renter base, plan for 1-2y turnover.
- Market conditions: 2 active listings in the ZIP; 783 units permitted in St. Clair County in 2024 (378 in 5+ unit buildings).
Forward outlook
- In year one you build about $2k of equity ($380 loan paydown + $2k appreciation (3.0% local appreciation)).
- St. Clair County population projected at -23% by 2050 — secular population decline; favor cash flow + early exit over multi-decade hold.
- At projected returns (3.0% appreciation + 3.0% rent growth), your $15k cash investment doubles in ~2 years — after that, you're playing with house money.
Negotiation context
- It's been on market 107 days — a 9% lower offer ($50k) is reasonable based on typical stale-listing flexibility.
Risks & watch-outs
- Climate carrying-cost: extreme-heat days projected 7→21/yr by 2055 (HVAC capex compounding) — expect insurance premiums to compound above CPI over the hold.
Questions for the listing agent
- It's been on market 107 days. Have you received any prior offers? Is the seller open to a 9% concession, seller financing, or rate buy-down credit?
- Why hasn't it sold? Are there any deal-killer items the seller is aware of (foundation, flood, title, zoning, code violations)?
- Is there a deadline driving the sale (1031 exchange, divorce, estate, relocation)? That informs how much negotiation room exists.
- Schools are F-rated, which usually means shorter tenancies and higher turnover. Who's the typical renter profile here, and what's been the actual vacancy rate?
- Crime grade is D in this area — have there been break-ins, vandalism, or insurance claims at this property in the last 3 years? What carrier currently insures it and at what premium?
- What's the average days-on-market for RENTAL listings here right now (not sales)? A rising rental-DOM trend means longer vacancies and softer asking-rent achievability than the comps imply.
- What's the recent tenant-quality profile in this submarket — average credit score on applications, eviction rate, late-payment / NSF rate, and stable-employment percentage? A property-management company in the area should have these aggregated.
- How much new for-sale + rental construction is in the pipeline within 1–3 miles? Heavy new supply typically softens prices + rents 12–24 months out; constrained supply supports both.
Investment metrics
- 1% rule
- 1.95% ✓
- Cap rate
- 17.66%
- Cash-on-cash
- 40.58%
- DSCR
- 2.81
- GRM
- 4.3
CMA / ARV
- ARV (median comp)
- $80,827
- List price
- $54,950
- Delta
- -32.02%
- Verdict
- UNDERPRICED
- Comps
- 12 within 1.0 mi
Projected returns pro-forma
3.0% appreciation · 3.0% rent growth · sell at horizon
- IRR
- 46.0%
- Equity multiple
- 3.58×
- Total profit
- $39,745
- Equity at exit
- $24,708
- IRR
- 45.8%
- Equity multiple
- 7.18×
- Total profit
- $95,027
- Equity at exit
- $38,078
Cash invested: $15,386 (down + closing). Projections, not guarantees.
Landlord ↔ Tenant lean methodology
- Overall (STATE)
- 43 Moderately Tenant-Leaning
- State Illinois
- 43 Moderately Tenant-Leaning · D+7
- County
- — inherits STATE
- City
- — inherits STATE
ZIP-level market 62289
- Active inventory
- 2
- Price-to-rent
- 4.3×
Monthly cashflow live
- Estimated rent
- $1,072 medium interval (Pro) →
- Mortgage (P&I)
- −$288
- Tax from tax record
- −$15 /mo · $182/yr
- Insurance
- −$23
- HOA
- −$0
- Vacancy / Maint / Mgmt
- −$225
- Net cashflow
- $520
Break-even live
UW: 25.0% down · 7.5% · 30yr · 1.5% tax · 5.0% vac · 8.0% maint · 8.0% mgmt
Financing live
Cash to close
- Down payment
- $13,738
- Closing costs
- $1,648
- Reserves months
- —
- Total cash needed
- —
Loan-product check · same deal, 3 products live
Conventional
25% down · 7.5% · 30yr
- Down + closing
- —
- Monthly P&I
- —
- Monthly cashflow
- —
- DSCR
- —
- Eligible?
- —
Personal DTI + credit; lowest rate.
DSCR
20% down · 8.5% · 30yr
- Down + closing
- —
- Monthly P&I
- —
- Monthly cashflow
- —
- DSCR
- —
- Eligible?
- —
No personal income docs; deal must DSCR.
Hard money
10% down · 12.0% · 12mo
- Down + closing
- —
- Monthly P&I
- —
- Monthly cashflow
- —
- DSCR
- —
- Eligible?
- —
Short-term bridge; refi at stabilization.
Listing history 17 events
-
2026-06-18days on market $54,950 Active 107 DOM
-
2026-06-17days on market $54,950 Active 106 DOM
-
2026-06-16days on market $54,950 Active 105 DOM
-
2026-06-15days on market $54,950 Active 104 DOM
-
2026-06-13days on market $54,950 Active 102 DOM
-
2026-06-13days on market $54,950 Active 101 DOM
-
2026-06-09days on market $54,950 Active 98 DOM
-
2026-06-08days on market $54,950 Active 97 DOM
-
2026-06-07days on market $54,950 Active 96 DOM
-
2026-06-03days on market $54,950 Active 92 DOM
-
2026-06-02days on market $54,950 Active 91 DOM
-
2026-06-01days on market $54,950 Active 90 DOM
-
2026-05-31days on market $54,950 Active 89 DOM
-
2026-05-12price $54,950 394-char remark
Show marketing remark (394 chars)
Spacious ranch style home on a double corner lot with a covered porch. Kitchen has island, skylight and lots of cabinets. Special features include: Open floor plan, vaulted ceilings, sky light, two full bathrooms, tile backsplash and deck. This home has lots of potential. Three bedrooms, two baths, kitchen with eating area opens into the family room. Easy to show, set your appointment today!
-
2026-04-07price $59,950 394-char remark
Show marketing remark (394 chars)
Spacious ranch style home on a double corner lot with a covered porch. Kitchen has island, skylight and lots of cabinets. Special features include: Open floor plan, vaulted ceilings, sky light, two full bathrooms, tile backsplash and deck. This home has lots of potential. Three bedrooms, two baths, kitchen with eating area opens into the family room. Easy to show, set your appointment today!
-
2026-03-03$64,950 Active 394-char remark
Show marketing remark (394 chars)
Spacious ranch style home on a double corner lot with a covered porch. Kitchen has island, skylight and lots of cabinets. Special features include: Open floor plan, vaulted ceilings, sky light, two full bathrooms, tile backsplash and deck. This home has lots of potential. Three bedrooms, two baths, kitchen with eating area opens into the family room. Easy to show, set your appointment today!
-
1996-03-19soldstatus $75,000
ⓘ Source: listings_history table (triggers on properties + properties_extension) + one-shot
backfill from property_details.listing_events for pre-trigger history.
Tax reassessment forecast IL · Partial reset (capped growth)
- Current annual tax
- $182 · $15/mo
- Projected year-2 tax
- $715 · $60/mo
- Expected delta
- +$533/yr (+$44/mo · 293.1%)
ⓘ Screening estimate from a state-policy table — verify with the county assessor before closing.
Climate risk First Street
- Flood 1/10 Low FEMA zone X · 0% chance over 30 yrs
- Wildfire 1/10 Low
- Heat 5/10 Major 7 d/yr ≥106°F today · 21 d/yr by 30 yrs out
- Wind 2/10 Low 2% chance of damaging wind over 30 yrs
- Air quality 2/10 Low 2 unhealthy d/yr today · 2 by 30 yrs out
Nearby sold comps map
Loading sold comps map…
Walkable amenities ~0.75 mi
Loading nearby amenities…
Taxation est. · year 1
- Rental income
- $12,859
- − Mortgage interest
- −$3,078
- − Property taxes
- −$182
- − Insurance
- −$275
- − Repairs & maintenance
- −$1,029
- − Management
- −$1,029
- − Depreciation
- −$1,599
- Taxable income
- $5,669
- Est. tax owed @ 24.0%
- −$1,360
- After-tax cash flow
- $4,884/yr
For passive investors: Depreciation is non-cash, so a rental often shows a tax loss while cash-flowing — sheltering income. Rental losses are passive: they offset passive income freely, and up to $25,000/yr can offset ordinary (W-2) income if you actively participate and your MAGI is under $100k (phasing out to $0 by $150k); unused losses carry forward. On sale, claimed depreciation is recaptured at up to 25%, and gains may owe capital-gains tax (a 1031 exchange can defer both). Figures are a year-1 estimate at your 24.0% rate — not tax advice; consult a CPA.
Schools (NCES district)
- District
- Lebanon CUSD 9
- NCES district ID
- 1722300
- Math proficiency
- 17% ▼ -1.00%
- Reading proficiency
- 19% ▼ -12.00%
- Median HH income
- $53,280
- Composite
- 16.57/100
- National rank
- #9178
- State rank
- #446 of 620 in IL
Livability — Summerfield
- Score
- 48/100
- State rank
- #1345
- US rank
- #26055
Category grades
Schools grade is shown separately in the Schools card above.
Census & demographics
- Census place
- Summerfield, IL
- City population
- 385
- Population (ZIP)
- 385
Population outlook (St. Clair County) Hauer SSP2
- Today (2025)
- 250,366 people
- By 2030
- 240,511 · -3.9%
- By 2040
- 217,391 · -13.2%
- By 2050
- 192,699 · -23.0%
- By 2075
- 140,637 · -43.8%
- By 2100
- 100,499 · -59.9%
Race, ethnicity, and origin ACS 2023
- Neighborhood character
- Predominantly White (97%)
- Race & ethnicity
- White 97% Two or more races 3% Hispanic / Latino 2%
- Common ancestry
- Lithuanian 6% Romanian 6% Serbian 2%
- Foreign-born
- 1% · Canada
- Languages at home
- 94% English-only · Spanish 3% Russian/Polish/Slavic 3%
Political lean MEDSL · St. Clair
- 2024 margin
- Lean D (+7.9) · D 53.0% · R 45.1% · Other 1.8%
- 2008→2024 swing
- -14.6pp toward R · 2008: 22.4pp · 2024: 7.9pp
- All cycles
- 2024: D+7.9 2020: D+8.7 2016: D+5.6 2012: D+14.5 2008: D+22.4
Not yet ingested
- Civics
- —
Market trends
- HPI YoY
- —
- Current HPI
- —
- Rent YoY
- —
- Metro
- —
- State GDP YoY
- ▲ 1.59%
- F500 in state
- 60
Industry mix (Fortune 500 HQ in IL)
| Industry | F500 HQs | Revenue |
|---|---|---|
| Insurance | 4 | $201B |
|
||
| Consumer Goods | 4 | $87B |
|
||
| Industrial Machinery | 3 | $64B |
|
||
| Healthcare | 2 | $55B |
|
||
| Retail / Pharmacy | 1 | $148B |
|
||
| Agriculture / Food | 1 | $86B |
|
||
Price history
-26.7% since first listed4 events — show timeline
- 2026-05-12 Price Changed $54,950 MARIS as Distributed by MLS Grid
- 2026-04-07 Price Changed $59,950 MARIS as Distributed by MLS Grid
- 2026-03-03 Listed $64,950 MARIS as Distributed by MLS Grid
- 1996-03-19 Sold (Public Records) $75,000 Public Records
Property tax history
+0.0%/yrLatest (2024): $182 · +3.0% YoY. Source: county tax records.
Cash-flow waterfall
monthlySold comps — $/sqft
last 12 mo · ≤1 miLoading sold comps…