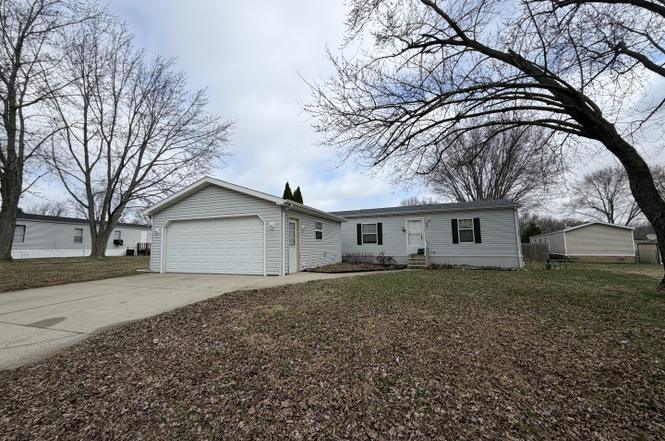
1867 Liberty Ave · Urbana, IL
Flood risk 5/10 · Moderate
- FEMA flood zone
- X (unshaded)
- Chance of flooding over 30 yrs
- 0.48%
- Est. flood insurance / yr
- $507 – $1,088
Fire risk 1/10 · Minimal
- Est. fire insurance / yr
- $804 – $1,492
Heat risk 3/10 · Minor
- Hot days now (above 104°F)
- 7 days/yr
- Hot days in 30 yrs
- 19 days/yr
Wind risk 2/10 · Minimal
- Chance of severe wind over 30 yrs
- 1.0%
Air-quality risk 2/10 · Minimal
- Unhealthy air days now
- 1 days/yr
- Unhealthy air days in 30 yrs
- 2 days/yr
Risk factors via First Street. Map © Google.
Why this score? — see what drove the B- grade
The composite is a weighted blend of 9 inputs, each scored 0–100. Each bar is that input's sub-score; the figure is the points it added to the 100-point composite (weight × sub-score).
- Cash flow +30.0/30.0
- 1% rule +10.0/10.0
- DSCR +10.0/10.0
- ARV discount +7.5/15.0
- Rent growth +5.0/5.0
- Livability +4.0/5.0
- Condition / age +2.5/5.0
- Schools +1.0/10.0
- Appreciation +0.0/10.0
$78,900
🖨 Deal sheet 📄 Offer letter ✓ Due diligence
Listing remarks MLS
Welcome home to this well-maintained ranch in the desirable Liberty Commons neighborhood of Urbana! Designed for comfortable living, this home offers an open and inviting floor plan with spacious living areas perfect for everyday life and entertaining. The kitchen is a standout feature with abundant cabinet and counter space, plus a convenient island with breakfast bar seating. The primary suite includes a private ensuite bathroom, providing a relaxing retreat at the end of the day. A dedicated laundry area just off the side entrance adds everyday convenience. Outside you'll enjoy the yard complete with a handy garden shed for additional storage. The oversized two-car garage offers plenty of room for vehicles, tools, and hobbies. Recent updates include a new roof and gutters in 2024, plus security cameras for added peace of mind. A home warranty in place through 2027 provides extra confidence for the next owner. This move-in ready home offers comfort, convenience, and great features in a fantastic location-don't miss your opportunity to make it yours!
Key facts
- Abundant cabinets
- Convenient island
- Built 2011
Tags
Neighborhood map
What this means for you Summary
Snapshot
- This is a 3-bed/2.0-bath manufactured listed at $79k.
Deal economics
- At list price, monthly cash flow is $634 ($8k/yr) — positive.
- The deal already cash-flows at list — no discount required.
- Meets the 1% rule at list price ($1k rent vs $79k).
- Recommended offer: $78k (1.5% below list) — sets the bar for market timing.
- Cap rate 15.9% vs local median 3.6% in Urbana — top-decile yield for the area; either an underpriced asset or a hidden risk that comps aren't pricing in. Stress-test before assuming the spread holds.
Location & tenants
- Location reads 80/100 on livability (#110 in IL, #1,793 nationally) — a professional / high-income tenant draw. Strengths: amenities A+, commute A+, cost of living A+; Watch: employment D, schools D-, crime F.
- Urbana SD 116 (urban): math 11% / reading 13% proficiency, ranked #568 of 620 in IL (top 92%) — low school quality limits family demand, transient renter base, plan for 1-2y turnover; 64% free/reduced lunch — lower-income household profile, screen leases tightly.
- Market conditions: Rents rising fast (+11.8%/yr); 122 active listings in the ZIP; 5 comparable units currently listed for rent nearby; rentals at typical pace (median 21d on market — plan ~3-4 weeks tenant-placement turnaround); 40% of comp listings sitting > 30 days — soft ceiling on asking rent; 573 units permitted in Champaign County in 2024 (359 in 5+ unit buildings).
Forward outlook
- Local home prices are declining (-3.0%/yr); year-one equity from $545 of loan paydown is wiped out by about $2k of value loss. Plan a longer hold.
- Champaign County population projected at +15% by 2050 — modest demand growth; plan on rents tracking national, not racing it.
- At projected returns (-3.0% appreciation + 8.0% rent growth), your $22k cash investment doubles in ~4 years — after that, you're playing with house money.
Negotiation context
- It's been on market 28 days — a 2% lower offer ($78k) is reasonable based on typical stale-listing flexibility.
Risks & watch-outs
- Climate carrying-cost: moderate flood risk — expect insurance premiums to compound above CPI over the hold.
Questions for the listing agent
- Is there a deadline driving the sale (1031 exchange, divorce, estate, relocation)? That informs how much negotiation room exists.
- Schools are D-rated, which usually means shorter tenancies and higher turnover. Who's the typical renter profile here, and what's been the actual vacancy rate?
- Crime grade is F in this area — have there been break-ins, vandalism, or insurance claims at this property in the last 3 years? What carrier currently insures it and at what premium?
- What's the average days-on-market for RENTAL listings here right now (not sales)? A rising rental-DOM trend means longer vacancies and softer asking-rent achievability than the comps imply.
- What's the recent tenant-quality profile in this submarket — average credit score on applications, eviction rate, late-payment / NSF rate, and stable-employment percentage? A property-management company in the area should have these aggregated.
- How much new for-sale + rental construction is in the pipeline within 1–3 miles? Heavy new supply typically softens prices + rents 12–24 months out; constrained supply supports both.
Investment metrics
- 1% rule
- 1.89% ✓
- Cap rate
- 15.94%
- Cash-on-cash
- 34.46%
- DSCR
- 2.53
- GRM
- 4.4
CMA / ARV
No comps found within radius.
Projected returns pro-forma
-3.0% appreciation · 8.0% rent growth · sell at horizon
- IRR
- 35.5%
- Equity multiple
- 2.61×
- Total profit
- $35,540
- Equity at exit
- $11,764
- IRR
- 44.8%
- Equity multiple
- 6.39×
- Total profit
- $118,993
- Equity at exit
- $6,822
Cash invested: $22,092 (down + closing). Projections, not guarantees.
Landlord ↔ Tenant lean methodology
- Overall (STATE)
- 43 Moderately Tenant-Leaning
- State Illinois
- 43 Moderately Tenant-Leaning · D+7
- County
- — inherits STATE
- City
- — inherits STATE
ZIP-level market 61802
- Home prices YoY
- -20.5%
- Rents YoY
- 11.8%
- Active inventory
- 122
- Price-to-rent
- 4.4×
Monthly cashflow live
- Estimated rent
- $1,493 high interval (Pro) →
- Mortgage (P&I)
- −$414
- Tax est. 1.5%
- −$99 /mo · $1,184/yr
- Insurance
- −$33
- HOA
- −$0
- Vacancy / Maint / Mgmt
- −$314
- Net cashflow
- $634
Break-even live
UW: 25.0% down · 7.5% · 30yr · 1.5% tax · 5.0% vac · 8.0% maint · 8.0% mgmt
Financing live
Cash to close
- Down payment
- $19,725
- Closing costs
- $2,367
- Reserves months
- —
- Total cash needed
- —
Loan-product check · same deal, 3 products live
Conventional
25% down · 7.5% · 30yr
- Down + closing
- —
- Monthly P&I
- —
- Monthly cashflow
- —
- DSCR
- —
- Eligible?
- —
Personal DTI + credit; lowest rate.
DSCR
20% down · 8.5% · 30yr
- Down + closing
- —
- Monthly P&I
- —
- Monthly cashflow
- —
- DSCR
- —
- Eligible?
- —
No personal income docs; deal must DSCR.
Hard money
10% down · 12.0% · 12mo
- Down + closing
- —
- Monthly P&I
- —
- Monthly cashflow
- —
- DSCR
- —
- Eligible?
- —
Short-term bridge; refi at stabilization.
Rent comps 5 comps
| Address | Beds | Baths | Sqft | Rent | $/sqft | DOM | Units | Dist |
|---|---|---|---|---|---|---|---|---|
| 26 Ivanhoe Dr Urbana, IL | 2.0 | 2.0 | 896 | $935 | $1.04 | 13d | 1 | 0.43mi |
| 1304 Christopher Cir Urbana, IL | 2.0 | 1.0 | 970 | $1,250 | $1.29 | 21d | 1 | 0.45mi |
| 1304 Christopher Cir Urbana, IL | 2.0 | 1.0 | 970 | $1,300 | $1.34 | 43d | 1 | 0.45mi |
| 1032 E Kerr Ave Urbana, IL | 1.0–2.0 | 1.0–2.0 | 777 | $1,430 | $1.84 | 13d | 46 | 0.89mi |
| 709 N Abbey Rd Urbana, IL | 4.0 | 2.5 | 1800 | $3,150 | $1.75 | 43d | 1 | 1.32mi |
Listing history 18 events
-
2026-06-18days on market $78,900 Active 28 DOM
-
2026-06-17days on market $78,900 Active 27 DOM
-
2026-06-16days on market $78,900 Active 26 DOM
-
2026-06-15remarks 691-char remark
-
2026-06-15days on market $78,900 Active 25 DOM
-
2026-06-14days on market $78,900 Active 93 DOM
-
2026-06-13days on market $78,900 Active 92 DOM
-
2026-06-10days on market $78,900 Active 90 DOM
-
2026-06-09days on market $78,900 Active 89 DOM
-
2026-06-08days on market $78,900 Active 88 DOM
-
2026-06-07days on market $78,900 Active 87 DOM
-
2026-06-03days on market $78,900 Active 83 DOM
-
2026-06-02days on market $78,900 Active 82 DOM
-
2026-06-01days on market $78,900 Active 81 DOM
-
2026-05-31days on market $78,900 Active 80 DOM
-
2026-05-30days on market $78,900 Active 79 DOM
-
2026-05-11price $78,900 1067-char remark
Show marketing remark (1067 chars)
Welcome home to this well-maintained ranch in the desirable Liberty Commons neighborhood of Urbana! Designed for comfortable living, this home offers an open and inviting floor plan with spacious living areas perfect for everyday life and entertaining. The kitchen is a standout feature with abundant cabinet and counter space, plus a convenient island with breakfast bar seating. The primary suite includes a private ensuite bathroom, providing a relaxing retreat at the end of the day. A dedicated laundry area just off the side entrance adds everyday convenience. Outside you'll enjoy the yard complete with a handy garden shed for additional storage. The oversized two-car garage offers plenty of room for vehicles, tools, and hobbies. Recent updates include a new roof and gutters in 2024, plus security cameras for added peace of mind. A home warranty in place through 2027 provides extra confidence for the next owner. This move-in ready home offers comfort, convenience, and great features in a fantastic location-don't miss your opportunity to make it yours!
-
2026-05-01price $80,400 1067-char remark
Show marketing remark (1067 chars)
Welcome home to this well-maintained ranch in the desirable Liberty Commons neighborhood of Urbana! Designed for comfortable living, this home offers an open and inviting floor plan with spacious living areas perfect for everyday life and entertaining. The kitchen is a standout feature with abundant cabinet and counter space, plus a convenient island with breakfast bar seating. The primary suite includes a private ensuite bathroom, providing a relaxing retreat at the end of the day. A dedicated laundry area just off the side entrance adds everyday convenience. Outside you'll enjoy the yard complete with a handy garden shed for additional storage. The oversized two-car garage offers plenty of room for vehicles, tools, and hobbies. Recent updates include a new roof and gutters in 2024, plus security cameras for added peace of mind. A home warranty in place through 2027 provides extra confidence for the next owner. This move-in ready home offers comfort, convenience, and great features in a fantastic location-don't miss your opportunity to make it yours!
ⓘ Source: listings_history table (triggers on properties + properties_extension) + one-shot
backfill from property_details.listing_events for pre-trigger history.
Climate risk First Street
- Flood 5/10 Major FEMA zone X (unshaded) · 48% chance over 30 yrs
- Wildfire 1/10 Low
- Heat 3/10 Moderate 7 d/yr ≥104°F today · 19 d/yr by 30 yrs out
- Wind 2/10 Low 100% chance of damaging wind over 30 yrs
- Air quality 2/10 Low 1 unhealthy d/yr today · 2 by 30 yrs out
Nearby sold comps map
Loading sold comps map…
Walkable amenities ~0.75 mi
Loading nearby amenities…
Taxation est. · year 1
- Rental income
- $17,920
- − Mortgage interest
- −$4,420
- − Property taxes
- −$1,184
- − Insurance
- −$394
- − Repairs & maintenance
- −$1,434
- − Management
- −$1,434
- − Depreciation
- −$2,295
- Taxable income
- $6,760
- Est. tax owed @ 24.0%
- −$1,622
- After-tax cash flow
- $5,991/yr
For passive investors: Depreciation is non-cash, so a rental often shows a tax loss while cash-flowing — sheltering income. Rental losses are passive: they offset passive income freely, and up to $25,000/yr can offset ordinary (W-2) income if you actively participate and your MAGI is under $100k (phasing out to $0 by $150k); unused losses carry forward. On sale, claimed depreciation is recaptured at up to 25%, and gains may owe capital-gains tax (a 1031 exchange can defer both). Figures are a year-1 estimate at your 24.0% rate — not tax advice; consult a CPA.
Schools (NCES district)
- District
- Urbana SD 116
- NCES district ID
- 1739960
- Math proficiency
- 11% ▼ -5.00%
- Reading proficiency
- 13% ▼ -7.00%
- Median HH income
- $33,678
- Composite
- 9.72/100
- National rank
- #9830
- State rank
- #568 of 620 in IL
Livability — Urbana
- Score
- 80/100
- State rank
- #110
- US rank
- #1793
Category grades
Schools grade is shown separately in the Schools card above.
Census & demographics
- County
- Champaign County · 182,148 people
- City population
- 48,184
- Metro
- Champaign-Urbana, IL
- Population (ZIP)
- 20,293
- Household income
- $61,620
- Rent vs Own
- Severe rent burden
- 809.0
Population outlook (Champaign County) Hauer SSP2
- Today (2025)
- 223,848 people
- By 2030
- 231,416 · +3.4%
- By 2040
- 244,321 · +9.1%
- By 2050
- 256,432 · +14.6%
- By 2075
- 285,823 · +27.7%
- By 2100
- 296,406 · +32.4%
Race, ethnicity, and origin ACS 2023
- Neighborhood character
- Diverse neighborhood (Simpson 0.58)
- Race & ethnicity
- White 61% Black 18% Hispanic / Latino 11% Asian 7% Two or more races 6%
- Hispanic origin (detail)
- Mexican 7% Puerto Rican 1%
- Common ancestry
- Romanian 3% Lithuanian 2% Italian 1%
- Foreign-born
- 12% · China, Canada, South Korea
- Languages at home
- 83% English-only · Spanish 7% Other Indo-European 2% Chinese 2%
Political lean MEDSL · Champaign
- 2024 margin
- Strong D (+24.1) · D 61.3% · R 37.2% · Other 1.5%
- 2008→2024 swing
- +6.6pp toward D · 2008: 17.5pp · 2024: 24.1pp
- All cycles
- 2024: D+24.1 2020: D+22.8 2016: D+18.4 2012: D+6.8 2008: D+17.5
Not yet ingested
- Civics
- —
Market trends
- HPI YoY
- ▼ -53.21%
- Current HPI
- 206.3079
- Rent YoY
- ▲ 11.85%
- Metro
- Champaign-Urbana, IL
- State GDP YoY
- ▲ 1.59%
- F500 in state
- 60
Industry mix (Fortune 500 HQ in IL)
| Industry | F500 HQs | Revenue |
|---|---|---|
| Insurance | 4 | $201B |
|
||
| Consumer Goods | 4 | $87B |
|
||
| Industrial Machinery | 3 | $64B |
|
||
| Healthcare | 2 | $55B |
|
||
| Retail / Pharmacy | 1 | $148B |
|
||
| Agriculture / Food | 1 | $86B |
|
||
Price history
-1.9% since first listed2 events — show timeline
- 2026-05-11 Price Changed $78,900 MRED as Distributed by MLS Grid
- 2026-05-01 Price Changed $80,400 MRED as Distributed by MLS Grid
Cash-flow waterfall
monthlySold comps — $/sqft
last 12 mo · ≤1 miLoading sold comps…