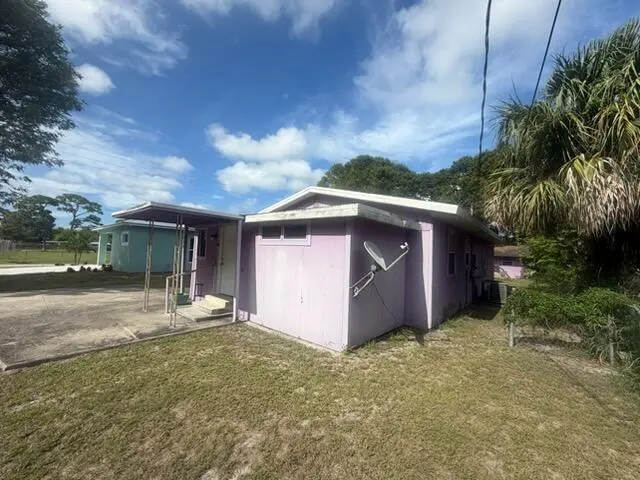
1804 S 30th S · Fort Pierce, FL
Flood risk 4/10 · Minor
- FEMA flood zone
- X (unshaded)
- Chance of flooding over 30 yrs
- 0.2%
- Est. flood insurance / yr
- $507 – $1,088
Fire risk 1/10 · Minimal
- Est. fire insurance / yr
- $947 – $1,759
Heat risk 10/10 · Severe
- Hot days now (above 106°F)
- 7 days/yr
- Hot days in 30 yrs
- 22 days/yr
Wind risk 10/10 · Severe
- Chance of severe wind over 30 yrs
- 99.0%
Air-quality risk 2/10 · Minimal
- Unhealthy air days now
- 0 days/yr
- Unhealthy air days in 30 yrs
- 1 days/yr
Risk factors via First Street. Map © Google.
Why this score? — see what drove the D+ grade
The composite is a weighted blend of 9 inputs, each scored 0–100. Each bar is that input's sub-score; the figure is the points it added to the 100-point composite (weight × sub-score).
- Cash flow +14.6/30.0
- ARV discount +11.3/15.0
- DSCR +4.5/10.0
- 1% rule +4.1/10.0
- Livability +3.8/5.0
- Schools +3.7/10.0
- Rent growth +2.5/5.0
- Condition / age +2.5/5.0
- Appreciation +0.0/10.0
$220,000
🖨 Deal sheet (PDF) 📄 Offer letter ✓ Due diligence
Listing remarks
This 3-bedroom, 1-bathroom single-family home provides a fantastic opportunity to add value and customize to your liking. Featuring a functional layout and solid bones, the property requires cosmetic updates and repairs throughout, making it the ideal a fix-and-flip or a profitable rental investment. Don't miss out on this high-potential project!
Key facts
- 7,092 sq ft lot
- 2 garage spots
- Built 1950
Property features AI
Finance
- Other: Pets allowed with no restrictions
Exterior
- Parking: Detached 2-car garage (2 covered spaces, total parking for 2 vehicles)
- Utilities: Public water; Public sewer; Cable connected; Electricity connected
- Home design: Single-family residence; One-story; Resale property; Facing east
- Construction: Concrete construction; Shingle roof; Slab foundation
- Exterior features: Not waterfront
Interior
- Kitchen: Refrigerator
- Bedrooms: 3 bedrooms on the main level
- Flooring: Carpet
- Bathrooms: 1 full bathroom (main level)
- Heating & cooling: Central heating (electric); Central air conditioning
- Interior features: No special interior features specified; Furnished: negotiable
- Laundry & utility: Laundry: other (details not specified)
Neighborhood map
What this means for you Summary
Snapshot
- This is a 3-bed/1.0-bath single-family listed at $220k.
Deal economics
- At list price, monthly cash flow is $53 ($631/yr) — positive.
- The deal already cash-flows at list — no discount required.
- To meet the 1% rule (rent ≥ 1% of price), the offer needs to be $199k (9.5% below list).
- Recommended offer: $199k (9.5% below list) — sets the bar for 1% rule.
- Cap rate 6.6% vs local median 3.5% in Fort Pierce — top-decile yield for the area; either an underpriced asset or a hidden risk that comps aren't pricing in. Stress-test before assuming the spread holds.
Location & tenants
- Location reads 76/100 on livability (#226 in FL, #3,360 nationally) — a middle-class / working-renter tenant base. Strengths: commute A+, cost of living A+, housing A+; Watch: crime D+, amenities F, employment F.
- St. Lucie (urban): math 40% / reading 48% proficiency, ranked #51 of 73 in FL (top 70%) — families likely to look elsewhere, expect single-tenant / working-renter base with shorter leases.
- Zoned schools: Manatee Academy K-8 (math 53% / reading 51%, grade C-, #990 of 2,144 statewide, top 48%, 1,664 students, 65% FRL); Southern Oaks Middle School (math 39% / reading 43%, grade F, #353 of 571 statewide, top 63%, 894 students, 76% FRL); Fort Pierce Central High School (math 15% / reading 45%, grade F, #441 of 667 statewide, top 67%, 3,091 students, 62% FRL).
- Market conditions: 151 active listings in the ZIP; 34 comparable units currently listed for rent nearby; rentals at typical pace (median 26d on market — plan ~3-4 weeks tenant-placement turnaround); 4,868 units permitted in St. Lucie County in 2024 (268 in 5+ unit buildings).
- At $1,991/mo this rent would consume 46% of the median local household income ($52k/yr) (locally 625% of renters already pay >50% of income on rent) — very limited rent-growth headroom before tenants either downsize or default.
Forward outlook
- Local home prices are declining (-3.0%/yr); year-one equity from $2k of loan paydown is wiped out by about $7k of value loss. Plan a longer hold.
- St. Lucie County population projected at +20% by 2050 — long-run rental-demand tailwind backs the buy-and-hold thesis.
Negotiation context
- Only 12 days on market — expect competitive offers; lowballing is unlikely to land.
Risks & watch-outs
- Watch-outs: built in 1950 — expect roof / HVAC / electrical / plumbing capex.
- Climate carrying-cost: severe wind risk, 99% chance of damaging wind over 30y; extreme-heat days projected 7→22/yr by 2055 (HVAC capex compounding) — expect insurance premiums to compound above CPI over the hold.
Questions for the listing agent
- Built in 1950 — when were the roof, HVAC, electrical panel, plumbing, and water heater last replaced?
- Is there a deadline driving the sale (1031 exchange, divorce, estate, relocation)? That informs how much negotiation room exists.
- Schools are D-rated, which usually means shorter tenancies and higher turnover. Who's the typical renter profile here, and what's been the actual vacancy rate?
- Crime grade is D in this area — have there been break-ins, vandalism, or insurance claims at this property in the last 3 years? What carrier currently insures it and at what premium?
- The area grade is low — what's the realistic commute time and amenity access for the typical tenant pool here? Any planned neighborhood developments (good or bad) we should know about?
- What's the average days-on-market for RENTAL listings here right now (not sales)? A rising rental-DOM trend means longer vacancies and softer asking-rent achievability than the comps imply.
- What's the recent tenant-quality profile in this submarket — average credit score on applications, eviction rate, late-payment / NSF rate, and stable-employment percentage? A property-management company in the area should have these aggregated.
- How much new for-sale + rental construction is in the pipeline within 1–3 miles? Heavy new supply typically softens prices + rents 12–24 months out; constrained supply supports both.
Investment metrics
- 1% rule
- 0.91% ✗
- Cap rate
- 6.58%
- Cash-on-cash
- 1.02%
- DSCR
- 1.05
- GRM
- 9.2
CMA / ARV
- ARV (on-the-fly)
- $240,024
- Comps found
- 6
Show comp detail 6 sales within ~0.75 mi
| Address | Dist | Beds/Ba | Sqft | Sold | Price | $/sf | Match |
|---|---|---|---|---|---|---|---|
| 2110 S 31st St | 0.28mi | 3/1.0 | 1,176 (+7%) | 12mo | $290,000 | $247 | 65 |
| 1609 S 29th St | 0.11mi | 4/1.0 (+1) | 1,198 (+9%) | 22mo | $110,000 | $92 | 56 |
| 2105 S 37th St | 0.55mi | 3/1.0 | 1,040 (-5%) | 19mo | $219,000 | $211 | 50 |
| 3109 Kentucky Ave | 0.42mi | 3/3.0 | 1,042 (-5%) | 22mo | $239,000 | $229 | 46 |
| 1006 Apple St | 0.64mi | 3/2.0 | 1,230 (+12%) | 20mo | $269,000 | $219 | 30 |
| 1925 Royal Palm Dr | 0.69mi | 2/1.5 (-1) | 1,228 (+12%) | 20mo | $267,000 | $217 | 24 |
Match score weights: distance 35% · size 25% · config 20% · recency 20%. Top-matched comps best support the ARV.
Projected returns pro-forma
-3.0% appreciation · 3.0% rent growth · sell at horizon
- IRR
- -14.6%
- Equity multiple
- 0.48×
- Total profit
- $-32,269
- Equity at exit
- $32,803
- IRR
- -5.9%
- Equity multiple
- 0.62×
- Total profit
- $-23,664
- Equity at exit
- $19,022
Cash invested: $61,600 (down + closing). Projections, not guarantees.
Landlord ↔ Tenant lean methodology
- Overall (STATE)
- 87 Strongly Landlord-Friendly
- State Florida
- 87 Strongly Landlord-Friendly · R+3
- County
- — inherits STATE
- City
- — inherits STATE
ZIP-level market 34947
- Home prices YoY
- -8.6%
- Active inventory
- 151
- Price-to-rent
- 9.2×
Monthly cashflow live
- Estimated rent
- $1,991 high interval (Pro) →
- Mortgage (P&I)
- −$1,154
- Tax est. 1.5%
- −$275 /mo · $3,300/yr
- Insurance
- −$92
- HOA
- −$0
- Vacancy / Maint / Mgmt
- −$418
- Net cashflow
- $53
Break-even live
Sensitivity live
| Price | -10% $205 | -5% $129 | +0% $53 | +5% $-23 | +10% $-99 |
|---|---|---|---|---|---|
| Rent | -10% $-105 | -5% $-26 | +0% $53 | +5% $131 | +10% $210 |
| Rate | -1.0pp $163 | -0.5pp $109 | base $53 | +0.5pp $-4 | +1.0pp $-62 |
UW: 25.0% down · 7.5% · 30yr · 1.5% tax · 5.0% vac · 8.0% maint · 8.0% mgmt
Financing live
Cash to close
- Down payment
- $55,000
- Closing costs
- $6,600
- Reserves months
- —
- Total cash needed
- —
Loan-product check · same deal, 3 products live
Conventional
25% down · 7.5% · 30yr
- Down + closing
- —
- Monthly P&I
- —
- Monthly cashflow
- —
- DSCR
- —
- Eligible?
- —
Personal DTI + credit; lowest rate.
DSCR
20% down · 8.5% · 30yr
- Down + closing
- —
- Monthly P&I
- —
- Monthly cashflow
- —
- DSCR
- —
- Eligible?
- —
No personal income docs; deal must DSCR.
Hard money
10% down · 12.0% · 12mo
- Down + closing
- —
- Monthly P&I
- —
- Monthly cashflow
- —
- DSCR
- —
- Eligible?
- —
Short-term bridge; refi at stabilization.
Rent comps 34 comps
| Address | Beds | Baths | Sqft | Rent | $/sqft | DOM | Units | Dist |
|---|---|---|---|---|---|---|---|---|
| 3005 Tennessee Ave Fort Pierce, FL | 3.0 | 2.0 | 1222 | $2,400 | $1.96 | 25d | 1 | 0.26mi |
| 2100 S 34th St Fort Pierce, FL | 3.0 | 2.0 | 1262 | $2,200 | $1.74 | 25d | 1 | 0.36mi |
| 3208 Louisiana Ave Apt 3 Fort Pierce, FL | 3.0 | 1.0 | 1050 | $1,500 | $1.43 | 25d | 1 | 0.41mi |
| 2403 S 25th St Fort Pierce, FL | 2.0 | 1.0 | 576 | $1,775 | $3.08 | 25d | 1 | 0.62mi |
| 1820 Nebraska Ave Apt 201 Fort Pierce, FL | 2.0 | 2.0 | 1035 | $1,699 | $1.64 | 25d | 1 | 0.77mi |
| 1820 Nebraska Ave Apt 102 Fort Pierce, FL | 2.0 | 2.0 | 997 | $1,679 | $1.68 | 25d | 1 | 0.77mi |
| 1215 Hartman Rd Unit 1215-09 Fort Pierce, FL | 3.0 | 1.0 | 700 | $1,800 | $2.57 | 16d | 1 | 0.78mi |
| 1830 Nebraska Ave Fort Pierce, FL | 1.0–2.0 | 1.5–2.0 | 924 | $1,799 | $1.95 | 16d | 5 | 0.79mi |
| 1840 Nebraska Ave Apt 106 Fort Pierce, FL | 2.0 | 2.0 | 997 | $1,679 | $1.68 | 16d | 1 | 0.79mi |
| 1840 Nebraska Ave Apt 101 Fort Pierce, FL | 2.0 | 2.0 | 1035 | $1,699 | $1.64 | 16d | 1 | 0.79mi |
| 1810 Nebraska Ave Unit 106 Fort Pierce, FL | 2.0 | 2.0 | 1042 | $1,699 | $1.63 | 16d | 1 | 0.80mi |
| 1810 Nebraska Ave Apt 101 Fort Pierce, FL | 2.0 | 2.0 | 1035 | $1,699 | $1.64 | 25d | 1 | 0.80mi |
| 1800 Nebraska Ave Unit 202 Fort Pierce, FL | 2.0 | 2.0 | 1312 | $1,749 | $1.33 | 25d | 1 | 0.82mi |
| 1567 Pheasant Walk Unit B Fort Pierce, FL | 2.0 | 2.0 | 1280 | $1,900 | $1.48 | 16d | 1 | 0.85mi |
| 1904 Havana Ave #16 Fort Pierce, FL | 2.0 | 2.0 | 1196 | $1,900 | $1.59 | 16d | 1 | 0.90mi |
| 2516 S 19th St #208 Fort Pierce, FL | 2.0 | 2.0 | 1190 | $1,700 | $1.43 | 25d | 1 | 0.95mi |
| 2513 S 17th St #207 Fort Pierce, FL | 2.0 | 2.0 | 1190 | $1,600 | $1.34 | 25d | 1 | 0.97mi |
| 1439 Captains Walk Unit 20D Fort Pierce, FL | 2.0 | 2.0 | 1280 | $2,000 | $1.56 | 23d | 1 | 0.99mi |
| 2820 Stoneway Ln Fort Pierce, FL | 2.0 | 2.0 | 1005 | $1,575 | $1.57 | 25d | 1 | 1.01mi |
| 2811 Stoneway Ln Unit 2811A Fort Pierce, FL | 2.0 | 2.0 | 1274 | $1,700 | $1.33 | 16d | 1 | 1.03mi |
| 2101 Linda Sue Cir Fort Pierce, FL | 2.0 | 1.5 | 1300 | $1,750 | $1.35 | 25d | 1 | 1.03mi |
| 1911 Boston Ave Fort Pierce, FL | 4.0 | 3.0 | 930 | $3,500 | $3.76 | 25d | 1 | 1.17mi |
| 204 N 28th St Fort Pierce, FL | 3.0 | 2.0 | 1000 | $1,550 | $1.55 | 25d | 1 | 1.23mi |
| 1717 Linwood Ave Fort Pierce, FL | 2.0 | 1.0 | 712 | $1,800 | $2.53 | 25d | 1 | 1.25mi |
| 100 Corner Dr Fort Pierce, FL | 1.0–3.0 | 1.0–2.0 | 926 | $1,487 | $1.60 | 16d | 32 | 1.26mi |
| 205 N 22nd St Fort Pierce, FL | 2.0 | 1.0 | 1050 | $1,500 | $1.43 | 25d | 1 | 1.30mi |
| 312 N 27th St Fort Pierce, FL | 2.0 | 1.0 | 868 | $1,600 | $1.84 | 25d | 1 | 1.32mi |
| 2302 Sunrise Blvd #201 Fort Pierce, FL | 2.0 | 1.0 | 966 | $1,500 | $1.55 | 25d | 1 | 1.36mi |
| 1406 Citrus Ave Fort Pierce, FL | 2.0 | 1.0 | 930 | $1,600 | $1.72 | 16d | 1 | 1.38mi |
| 2016 S 10th St Unit A Fort Pierce, FL | 2.0 | 2.5 | 1120 | $1,595 | $1.42 | 25d | 1 | 1.40mi |
| 1817 Party Pl Fort Pierce, FL | 3.0 | 2.0 | 1389 | $2,250 | $1.62 | 25d | 1 | 1.41mi |
| 510 Texas Ct Fort Pierce, FL | 2.0 | 1.0 | 750 | $1,400 | $1.87 | 25d | 1 | 1.42mi |
| 306 N 18th Ct #2 Fort Pierce, FL | 3.0 | 2.0 | 1192 | $2,150 | $1.80 | 25d | 1 | 1.45mi |
| 2908 Dunbar St Fort Pierce, FL | 2.0 | 1.0 | 942 | $1,300 | $1.38 | 23d | 1 | 1.48mi |
Listing history 9 events
-
2026-06-21days on market $220,000 Active 12 DOM
-
2026-06-18days on market $220,000 Active 9 DOM
-
2026-06-17days on market $220,000 Active 8 DOM
-
2026-06-16days on market $220,000 Active 7 DOM
-
2026-06-15days on market $220,000 Active 6 DOM
-
2026-06-14days on market $220,000 Active 4 DOM
-
2026-06-13days on market $220,000 Active 3 DOM
-
2026-06-10remarks 348-char remark
-
2026-06-10$220,000 Active 1 DOM
ⓘ Source: listings_history table (triggers on properties + properties_extension) + one-shot
backfill from property_details.listing_events for pre-trigger history.
Climate risk First Street
- Flood 4/10 Moderate FEMA zone X (unshaded) · 20% chance over 30 yrs
- Wildfire 1/10 Low
- Heat 10/10 Extreme 7 d/yr ≥106°F today · 22 d/yr by 30 yrs out
- Wind 10/10 Extreme 99% chance of damaging wind over 30 yrs
- Air quality 2/10 Low 0 unhealthy d/yr today · 1 by 30 yrs out
Nearby sold comps map
Loading sold comps map…
Walkable amenities ~0.75 mi
Loading nearby amenities…
Taxation est. · year 1
- Rental income
- $23,893
- − Mortgage interest
- −$12,323
- − Property taxes
- −$3,300
- − Insurance
- −$1,100
- − Repairs & maintenance
- −$1,911
- − Management
- −$1,911
- − Depreciation
- −$6,400
- Taxable loss
- −$3,053
- Est. tax savings @ 24.0%
- +$733
- After-tax cash flow
- $1,364/yr
For passive investors: Depreciation is non-cash, so a rental often shows a tax loss while cash-flowing — sheltering income. Rental losses are passive: they offset passive income freely, and up to $25,000/yr can offset ordinary (W-2) income if you actively participate and your MAGI is under $100k (phasing out to $0 by $150k); unused losses carry forward. On sale, claimed depreciation is recaptured at up to 25%, and gains may owe capital-gains tax (a 1031 exchange can defer both). Figures are a year-1 estimate at your 24.0% rate — not tax advice; consult a CPA.
Schools (NCES district)
- District
- St. Lucie
- NCES district ID
- 1201770
- Math proficiency
- 40% ▼ -11.00%
- Reading proficiency
- 48% ▼ -4.00%
- Median HH income
- $44,737
- Composite
- 37.28/100
- National rank
- #4449
- State rank
- #51 of 73 in FL
Livability — Fort Pierce
- Score
- 76/100
- State rank
- #226
- US rank
- #3360
Category grades
Schools grade is shown separately in the Schools card above.
Census & demographics
- Census place
- Fort Pierce, FL
- County
- Saint Lucie County · 337,150 people
- City population
- 78,556
- Metro
- Port St. Lucie, FL
- Population (ZIP)
- 12,804
- Household income
- $51,811
- Rent vs Own
- Severe rent burden
- 625.0
Population outlook (St. Lucie County) Hauer SSP2
- Today (2025)
- 338,016 people
- By 2030
- 355,687 · +5.2%
- By 2040
- 385,521 · +14.1%
- By 2050
- 406,106 · +20.1%
- By 2075
- 441,054 · +30.5%
- By 2100
- 436,885 · +29.2%
Race, ethnicity, and origin ACS 2023
- Neighborhood character
- Diverse neighborhood (Simpson 0.65)
- Race & ethnicity
- Black 52% Hispanic / Latino 22% White 17% Two or more races 10% Asian 5% Native American 1%
- Hispanic origin (detail)
- Mexican 12% Puerto Rican 3% Cuban 1%
- Common ancestry
- Hispanic 8% Italian 2% Romanian 1%
- Foreign-born
- 16% · Canada
- Languages at home
- 73% English-only · Spanish 17% French/Haitian/Cajun 7% Other Indo-European 2%
Political lean MEDSL · St. Lucie
- 2024 margin
- Lean R (+9.1) · D 45.1% · R 54.2%
- 2008→2024 swing
- -21.2pp toward R · 2008: 12.1pp · 2024: -9.1pp
- All cycles
- 2024: R+9.1 2020: R+1.6 2016: R+2.5 2012: D+7.9 2008: D+12.1
Not yet ingested
- Civics
- —
Market trends
- HPI YoY
- ▼ -33.68%
- Current HPI
- 356.2528
- Rent YoY
- —
- Metro
- Port St. Lucie, FL
- State GDP YoY
- ▲ 3.28%
- F500 in state
- 36
Industry mix (Fortune 500 HQ in FL)
| Industry | F500 HQs | Revenue |
|---|---|---|
| Industrial Technology | 2 | $29B |
|
||
| Insurance | 2 | $17B |
|
||
| Retail | 1 | $60B |
|
||
| Technology Distribution | 1 | $58B |
|
||
| Homebuilding | 1 | $35B |
|
||
| Technology Manufacturing | 1 | $35B |
|
||
Price history
1 event — show timeline
- 2026-06-09 Listed $220,000 Beaches MLS
Property tax history
+12.4%/yrLatest (2025): $195 · +11.9% YoY. Source: county tax records.
Cash-flow waterfall
monthlySold comps — $/sqft
last 12 mo · ≤1 miLoading sold comps…