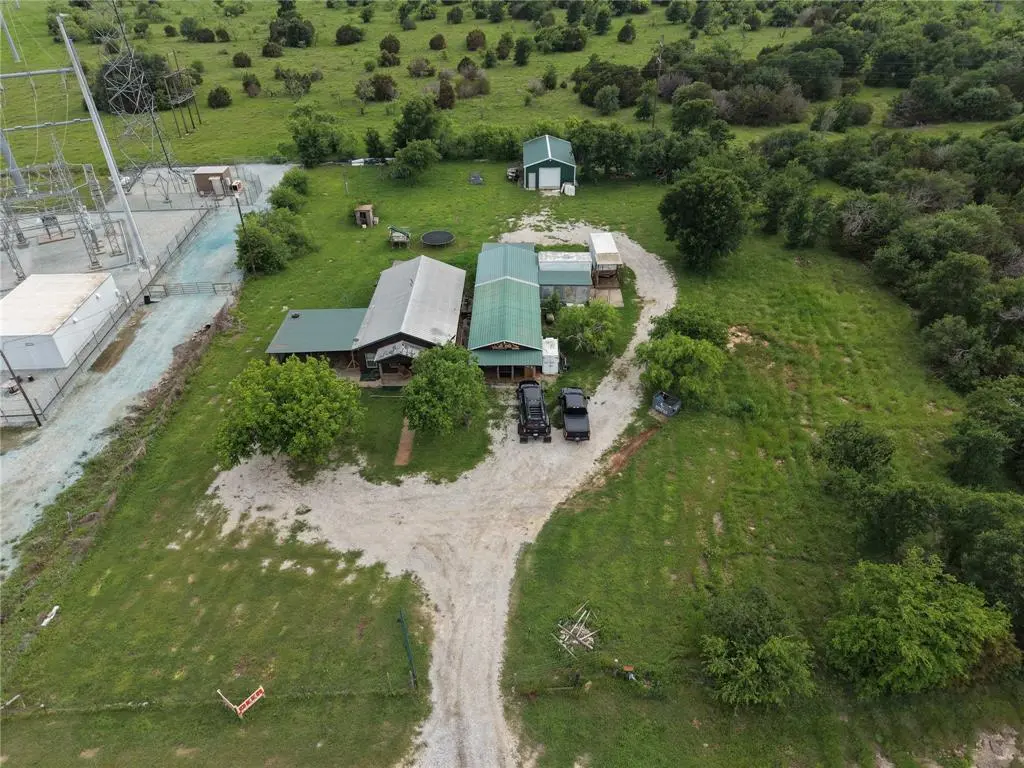
13990 Hwy 254 Hwy · Graford, TX
Flood risk No data
- FEMA flood zone
- —
- Chance of flooding over 30 yrs
- —
- Est. flood insurance / yr
- —
Fire risk No data
- Est. fire insurance / yr
- —
Heat risk No data
- Hot days now (above threshold)
- —
- Hot days in 30 yrs
- —
Wind risk No data
- Chance of severe wind over 30 yrs
- —
Air-quality risk No data
- Unhealthy air days now
- —
- Unhealthy air days in 30 yrs
- —
Risk factors via First Street. Map © Google.
Why this score? — see what drove the C grade
The composite is a weighted blend of 9 inputs, each scored 0–100. Each bar is that input's sub-score; the figure is the points it added to the 100-point composite (weight × sub-score).
- Cash flow +26.1/30.0
- DSCR +8.8/10.0
- ARV discount +7.5/15.0
- 1% rule +5.6/10.0
- Schools +3.4/10.0
- Livability +3.2/5.0
- Rent growth +2.5/5.0
- Condition / age +2.5/5.0
- Appreciation +0.0/10.0
$229,000
🖨 Deal sheet (PDF) 📄 Offer letter ✓ Due diligence
Listing remarks
Opportunity awaits with this versatile multi-use property offering residential comfort and commercial potential in a prime high visibility location on HWY 254. Currently operating as an established wild game processing and taxidermy business, this turnkey opportunity includes processing equipment conveying with an acceptable offer. A detailed inventory list is available upon request. The property features an older 3 bedroom 1 bath home with central heat and air, attached carport, and plenty of space for on-site living or rental income potential. Additional improvements include a 24x40 fully insulated shop ideal for storage, workspace, or expansion, plus a 20x60 insulated metal building with
Key facts
- Multi-use property
- Walk-in cooler space
- 1.61 acre lot
Tags
Property features AI
Finance
- Other: Multi-parcel property; No known restrictions; Possession at closing/funding
- Financial info: Listing terms: Cash or Conventional; No second mortgage; Treat as clear loan type
- HOA & community: No homeowners association
Exterior
- Parking: Covered parking; Carport; Carport with 4 spaces; Covered parking for 6 vehicles; 2-car garage (40' wide x 24' deep)
- Utilities: Electricity connected; Overhead utilities; Well water; Septic system; Located outside city limits; Not in a municipal utility district
- Home design: Single family residence; Residential property; One story; Accessory building listed as 'Other'; Property attached
- Construction: Built in 1945 (preowned); Cedar, wood framing construction; Metal roof; Pillar/post/pier foundation
- Exterior features: Awnings; Storage; Barbed wire fencing; Few trees; Level lot; Easements for utilities; Horse permitted
Interior
- Kitchen: Gas range; Refrigerator
- Bedrooms: 3 bedrooms (primary bedroom on main level)
- Flooring: Hardwood floors; Laminate floors
- Bathrooms: 1 full bathroom
- Heating & cooling: Propane heating; Central air conditioning; Electric cooling; Ceiling fans
- Interior features: Natural woodwork; Open floorplan; One living area; One dining area; Two total rooms
- Laundry & utility: List of other equipment available
Neighborhood map
What this means for you Summary
Snapshot
- This is a 3-bed/1.0-bath manufactured listed at $229k.
Deal economics
- At list price, monthly cash flow is $576 ($7k/yr) — positive.
- The deal already cash-flows at list — no discount required.
- Meets the 1% rule at list price ($2k rent vs $229k).
- Recommended offer: $222k (3.0% below list) — sets the bar for market timing.
- Cap rate 9.3% vs local median 1.4% in Graford — top-decile yield for the area; either an underpriced asset or a hidden risk that comps aren't pricing in. Stress-test before assuming the spread holds.
Location & tenants
- Location reads 63/100 on livability (#856 in TX) — a middle-class / working-renter tenant base. Strengths: cost of living A+, housing A+; Watch: employment C-, health & safety D+, schools D-.
- Graford ISD (rural): math 35% / reading 40% proficiency, ranked #817 of 1,141 in TX (top 72%) — families likely to look elsewhere, expect single-tenant / working-renter base with shorter leases.
- Market conditions: 465 active listings in the ZIP; 27 units permitted in Palo Pinto County in 2024 (0 in 5+ unit buildings).
Forward outlook
- Local home prices are declining (-3.0%/yr); year-one equity from $2k of loan paydown is wiped out by about $7k of value loss. Plan a longer hold.
- Palo Pinto County population projected to shrink 8% by 2050 — rents likely to lag national; underwrite the cash flow, not the appreciation.
Negotiation context
- It's been on market 58 days — a 3% lower offer ($222k) is reasonable based on typical stale-listing flexibility.
- 2 sale attempts since 3y ago with the ask held roughly flat each time — persistent listings suggest the price (not the market) is what's stuck; bring a comps-based counter.
Risks & watch-outs
- Watch-outs: built in 1945 — expect roof / HVAC / electrical / plumbing capex.
Questions for the listing agent
- It's been on market 58 days. Have you received any prior offers? Is the seller open to a 3% concession, seller financing, or rate buy-down credit?
- Built in 1945 — when were the roof, HVAC, electrical panel, plumbing, and water heater last replaced?
- Is there a deadline driving the sale (1031 exchange, divorce, estate, relocation)? That informs how much negotiation room exists.
- Schools are D-rated, which usually means shorter tenancies and higher turnover. Who's the typical renter profile here, and what's been the actual vacancy rate?
- Crime grade is F in this area — have there been break-ins, vandalism, or insurance claims at this property in the last 3 years? What carrier currently insures it and at what premium?
- What's the average days-on-market for RENTAL listings here right now (not sales)? A rising rental-DOM trend means longer vacancies and softer asking-rent achievability than the comps imply.
- What's the recent tenant-quality profile in this submarket — average credit score on applications, eviction rate, late-payment / NSF rate, and stable-employment percentage? A property-management company in the area should have these aggregated.
- How much new for-sale + rental construction is in the pipeline within 1–3 miles? Heavy new supply typically softens prices + rents 12–24 months out; constrained supply supports both.
Investment metrics
- 1% rule
- 1.06% ✓
- Cap rate
- 9.31%
- Cash-on-cash
- 10.79%
- DSCR
- 1.48
- GRM
- 7.9
CMA / ARV
No comps found within radius.
Projected returns pro-forma
-3.0% appreciation · 3.0% rent growth · sell at horizon
- IRR
- -0.2%
- Equity multiple
- 0.99×
- Total profit
- $-511
- Equity at exit
- $34,145
- IRR
- 9.4%
- Equity multiple
- 1.72×
- Total profit
- $46,360
- Equity at exit
- $19,800
Cash invested: $64,120 (down + closing). Projections, not guarantees.
Landlord ↔ Tenant lean methodology
- Overall (STATE)
- 87 Strongly Landlord-Friendly
- State Texas
- 87 Strongly Landlord-Friendly · R+5
- County
- — inherits STATE
- City
- — inherits STATE
ZIP-level market 76449
- Home prices YoY
- -27.7%
- Active inventory
- 465
- Price-to-rent
- 7.9×
Monthly cashflow live
- Estimated rent
- $2,421 medium interval (Pro) →
- Mortgage (P&I)
- −$1,201
- Tax from tax record
- −$40 /mo · $477/yr
- Insurance
- −$95
- HOA
- −$0
- Vacancy / Maint / Mgmt
- −$508
- Net cashflow
- $576
Break-even live
Sensitivity live
| Price | -10% $706 | -5% $641 | +0% $576 | +5% $251 | +10% $172 |
|---|---|---|---|---|---|
| Rent | -10% $385 | -5% $481 | +0% $576 | +5% $672 | +10% $768 |
| Rate | -1.0pp $692 | -0.5pp $635 | base $576 | +0.5pp $517 | +1.0pp $457 |
UW: 25.0% down · 7.5% · 30yr · 1.5% tax · 5.0% vac · 8.0% maint · 8.0% mgmt
Financing live
Cash to close
- Down payment
- $57,250
- Closing costs
- $6,870
- Reserves months
- —
- Total cash needed
- —
Loan-product check · same deal, 3 products live
Conventional
25% down · 7.5% · 30yr
- Down + closing
- —
- Monthly P&I
- —
- Monthly cashflow
- —
- DSCR
- —
- Eligible?
- —
Personal DTI + credit; lowest rate.
DSCR
20% down · 8.5% · 30yr
- Down + closing
- —
- Monthly P&I
- —
- Monthly cashflow
- —
- DSCR
- —
- Eligible?
- —
No personal income docs; deal must DSCR.
Hard money
10% down · 12.0% · 12mo
- Down + closing
- —
- Monthly P&I
- —
- Monthly cashflow
- —
- DSCR
- —
- Eligible?
- —
Short-term bridge; refi at stabilization.
Listing history 20 events
-
2026-06-21days on market $229,000 Active 58 DOM
-
2026-06-19days on market $229,000 Active 56 DOM
-
2026-06-18days on market $229,000 Active 55 DOM
-
2026-06-17days on market $229,000 Active 54 DOM
-
2026-06-16days on market $229,000 Active 53 DOM
-
2026-06-15days on market $229,000 Active 52 DOM
-
2026-06-14days on market $229,000 Active 50 DOM
-
2026-06-12days on market $229,000 Active 49 DOM
-
2026-06-09days on market $229,000 Active 46 DOM
-
2026-06-08days on market $229,000 Active 45 DOM
-
2026-06-07days on market $229,000 Active 44 DOM
-
2026-06-05days on market $229,000 Active 42 DOM
-
2026-06-04days on market $229,000 Active 40 DOM
-
2026-06-02days on market $229,000 Active 39 DOM
-
2026-06-01days on market $229,000 Active 38 DOM
-
2026-05-31days on market $229,000 Active 37 DOM
-
2026-05-31days on market $229,000 Active 36 DOM
-
2026-04-23$229,000 Active 1341-char remark
-
2023-03-15price $279,000
-
2023-01-16$329,000 Active
ⓘ Source: listings_history table (triggers on properties + properties_extension) + one-shot
backfill from property_details.listing_events for pre-trigger history.
Tax reassessment forecast TX · Resets to sale price
- Current annual tax
- $477 · $40/mo
- Projected year-2 tax
- $4,191 · $349/mo
- Expected delta
- +$3,714/yr (+$309/mo · 778.5%)
ⓘ Screening estimate from a state-policy table — verify with the county assessor before closing.
Nearby sold comps map
Loading sold comps map…
Walkable amenities ~0.75 mi
Loading nearby amenities…
Taxation est. · year 1
- Rental income
- $29,050
- − Mortgage interest
- −$12,828
- − Property taxes
- −$477
- − Insurance
- −$1,145
- − Repairs & maintenance
- −$2,324
- − Management
- −$2,324
- − Depreciation
- −$6,662
- Taxable income
- $3,291
- Est. tax owed @ 24.0%
- −$790
- After-tax cash flow
- $6,127/yr
For passive investors: Depreciation is non-cash, so a rental often shows a tax loss while cash-flowing — sheltering income. Rental losses are passive: they offset passive income freely, and up to $25,000/yr can offset ordinary (W-2) income if you actively participate and your MAGI is under $100k (phasing out to $0 by $150k); unused losses carry forward. On sale, claimed depreciation is recaptured at up to 25%, and gains may owe capital-gains tax (a 1031 exchange can defer both). Figures are a year-1 estimate at your 24.0% rate — not tax advice; consult a CPA.
Schools (NCES district)
- District
- Graford ISD
- NCES district ID
- 4821330
- Math proficiency
- 35% ▬ 0.00%
- Reading proficiency
- 40% ▲ 10.00%
- Median HH income
- $43,275
- Composite
- 34.3/100
- National rank
- #10225
- State rank
- #817 of 1141 in TX
Livability — Graford
- Score
- 63/100
- State rank
- #856
- US rank
- #15394
Category grades
Schools grade is shown separately in the Schools card above.
Census & demographics
- Population (ZIP)
- 2,157
Population outlook (Palo Pinto County) Hauer SSP2
- Today (2025)
- 27,500 people
- By 2030
- 27,079 · -1.5%
- By 2040
- 26,135 · -5.0%
- By 2050
- 25,215 · -8.3%
- By 2075
- 23,416 · -14.9%
- By 2100
- 20,300 · -26.2%
Race, ethnicity, and origin ACS 2023
- Neighborhood character
- Predominantly White (90%)
- Race & ethnicity
- White 90% Hispanic / Latino 7% Two or more races 4%
- Hispanic origin (detail)
- Mexican 5%
- Common ancestry
- Portuguese 1% Italian 1% Serbian 1%
- Foreign-born
- 2% · Canada
- Languages at home
- 95% English-only · Spanish 4%
Political lean MEDSL · Palo Pinto
- 2024 margin
- Solid R (+67.1) · D 16.1% · R 83.2%
- 2008→2024 swing
- -18.9pp toward R · 2008: -48.2pp · 2024: -67.1pp
- All cycles
- 2024: R+67.1 2020: R+64.1 2016: R+64.1 2012: R+59.8 2008: R+48.2
Not yet ingested
- Civics
- —
Market trends
- HPI YoY
- ▼ -92.53%
- Current HPI
- 241.6435
- Rent YoY
- —
- Metro
- —
- State GDP YoY
- ▲ 3.95%
- F500 in state
- 110
Industry mix (Fortune 500 HQ in TX)
| Industry | F500 HQs | Revenue |
|---|---|---|
| Energy | 16 | $1,198B |
|
||
| Technology | 5 | $198B |
|
||
| Engineering / Construction | 4 | $72B |
|
||
| Energy Services | 3 | $60B |
|
||
| Utilities | 3 | $41B |
|
||
| Healthcare | 2 | $330B |
|
||
Price history
-30.4% since first listed3 events — show timeline
- 2026-04-23 Listed $229,000 NTREIS
- 2023-03-15 Price Changed $279,000 NTREIS
- 2023-01-16 Listed $329,000 NTREIS
Property tax history
+0.6%/yrLatest (2019): $477 · -0.6% YoY. Source: county tax records.
Cash-flow waterfall
monthlySold comps — $/sqft
last 12 mo · ≤1 miLoading sold comps…