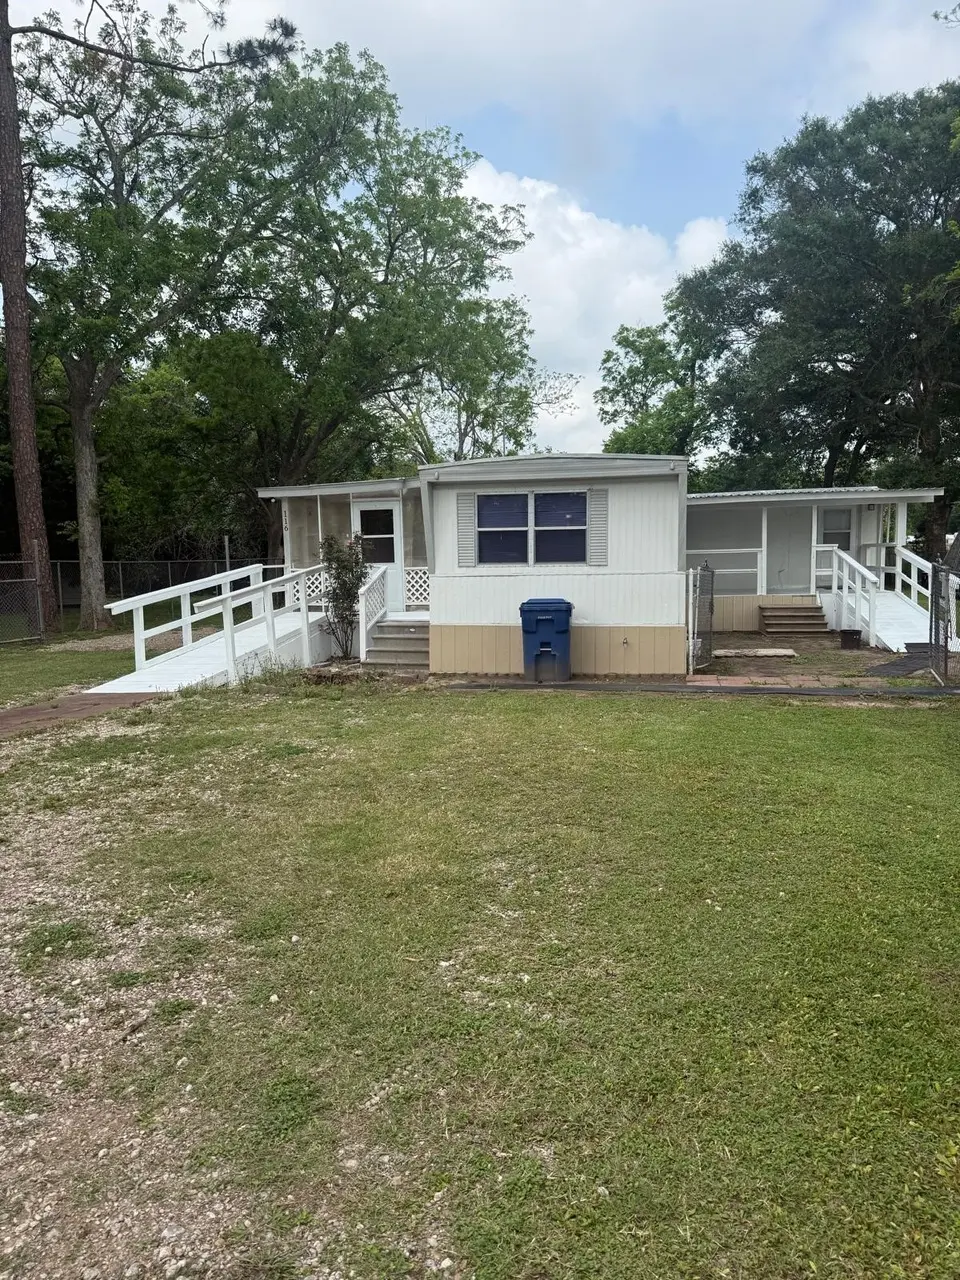
116 Avenue C · Brazoria, TX
Flood risk 1/10 · Minimal
- FEMA flood zone
- X (unshaded)
- Chance of flooding over 30 yrs
- 0.0%
- Est. flood insurance / yr
- $507 – $1,088
Fire risk 3/10 · Minor
- Est. fire insurance / yr
- $1,222 – $2,270
Heat risk 10/10 · Severe
- Hot days now (above 111°F)
- 7 days/yr
- Hot days in 30 yrs
- 25 days/yr
Wind risk 9/10 · Severe
- Chance of severe wind over 30 yrs
- 99.0%
Air-quality risk 3/10 · Minor
- Unhealthy air days now
- 3 days/yr
- Unhealthy air days in 30 yrs
- 3 days/yr
Risk factors via First Street. Map © Google.
Why this score? — see what drove the C+ grade
The composite is a weighted blend of 9 inputs, each scored 0–100. Each bar is that input's sub-score; the figure is the points it added to the 100-point composite (weight × sub-score).
- Cash flow +20.7/30.0
- Appreciation +10.0/10.0
- ARV discount +7.5/15.0
- DSCR +6.6/10.0
- 1% rule +5.4/10.0
- Livability +3.1/5.0
- Schools +3.0/10.0
- Rent growth +2.5/5.0
- Condition / age +2.5/5.0
$135,000
🖨 Deal sheet 📄 Offer letter ✓ Due diligence
Listing remarks
Adorable 4 bedroom, 1 bath home located in the S F Austin community! Front covered patio. The kitchen includes plenty of cabinet space, and a small opening looks into the living room. Vinyl flooring throughout the home. Enjoy a spacious backyard, perfect for hosting family gatherings and making the most of summer fun! Convenient access to hwy 36 and just minutes from shopping, dining, and entertainment! Call and make your appointment today!
Key facts
- Spacious backyard
- Front covered patio
- 0.49 acre lot
Tags
Property features AI
Exterior
- Security: Smoke detector(s)
- Utilities: Public water; Public sewer
- Home design: Residential property; Single-story (first-floor living); Full ownership
- Construction: Built in 1969; Block foundation; Metal roof; Construction materials: Unknown
- Exterior features: Private yard; Subdivision lot
Interior
- Kitchen: Gas oven; Gas range; Microwave
- Bedrooms: Primary bedroom on the first floor (approx. 14x14); Three additional bedrooms on the first floor (approx. 10x11, 6x9, 6x9)
- Flooring: Vinyl
- Bathrooms: 1 full bathroom
- Heating & cooling: Central heating (electric); Central air (gas)
- Interior features: Smoke detector(s); Private yard
- Laundry & utility: Washer hookup; Gas dryer hookup
Neighborhood map
What this means for you Summary
Snapshot
- This is a 4-bed/1.0-bath manufactured listed at $135k.
Deal economics
- At list price, monthly cash flow is $182 ($2k/yr) — positive.
- The deal already cash-flows at list — no discount required.
- Meets the 1% rule at list price ($1k rent vs $135k).
- Recommended offer: $131k (3.0% below list) — sets the bar for market timing.
- Cap rate 7.9% vs local median 3.2% in Brazoria — top-decile yield for the area; either an underpriced asset or a hidden risk that comps aren't pricing in. Stress-test before assuming the spread holds.
Location & tenants
- Location reads 61/100 on livability (#1,001 in TX) — a middle-class / working-renter tenant base. Strengths: cost of living A+, housing A+, crime B+; Watch: amenities F, commute F, employment F.
- Columbia-Brazoria ISD (town): math 35% / reading 33% proficiency, ranked #513 of 826 in TX (top 62%) — families likely to look elsewhere, expect single-tenant / working-renter base with shorter leases.
- Zoned schools: West Columbia El (math 47% / reading 39%, grade F, #1,283 of 4,322 statewide, top 30%, 709 students, 60% FRL); West Brazos J H (math 34% / reading 32%, grade F, #930 of 1,662 statewide, top 57%, 676 students, 65% FRL); Columbia H S (math 13% / reading 28%, grade F, #1,389 of 1,632 statewide, top 86%, 889 students, 60% FRL).
- Market conditions: 212 active listings in the ZIP; 3,960 units permitted in Brazoria County in 2024 (593 in 5+ unit buildings).
Forward outlook
- In year one you build about $14k of equity ($933 loan paydown + $14k appreciation (10.0% local appreciation)).
- Brazoria County population projected at +44% by 2050 — long-run rental-demand tailwind backs the buy-and-hold thesis.
- At projected returns (10.0% appreciation + 3.0% rent growth), your $38k cash investment doubles in ~3 years — after that, you're playing with house money.
- By year 3, paydown + projected appreciation supports a ~$37k cash-out refi (75% LTV) — recoverable capital for the next deal without selling this one.
Negotiation context
- It's been on market 50 days — a 3% lower offer ($131k) is reasonable based on typical stale-listing flexibility.
- 7 sale attempts since 6y ago; this cycle's ask has dropped $10k (7%) from the opening price — seller is motivated, your offer sets the floor, not the list.
Risks & watch-outs
- Climate carrying-cost: severe wind risk, 99% chance of damaging wind over 30y; extreme-heat days projected 7→25/yr by 2055 (HVAC capex compounding) — expect insurance premiums to compound above CPI over the hold.
Questions for the listing agent
- It's been on market 50 days. Have you received any prior offers? Is the seller open to a 3% concession, seller financing, or rate buy-down credit?
- Built in 1969 — when were the roof, HVAC, electrical panel, plumbing, and water heater last replaced?
- Is there a deadline driving the sale (1031 exchange, divorce, estate, relocation)? That informs how much negotiation room exists.
- Schools are F-rated, which usually means shorter tenancies and higher turnover. Who's the typical renter profile here, and what's been the actual vacancy rate?
- What's the average days-on-market for RENTAL listings here right now (not sales)? A rising rental-DOM trend means longer vacancies and softer asking-rent achievability than the comps imply.
- What's the recent tenant-quality profile in this submarket — average credit score on applications, eviction rate, late-payment / NSF rate, and stable-employment percentage? A property-management company in the area should have these aggregated.
- How much new for-sale + rental construction is in the pipeline within 1–3 miles? Heavy new supply typically softens prices + rents 12–24 months out; constrained supply supports both.
Investment metrics
- 1% rule
- 1.04% ✓
- Cap rate
- 7.91%
- Cash-on-cash
- 5.77%
- DSCR
- 1.26
- GRM
- 8.0
CMA / ARV
No comps found within radius.
Projected returns pro-forma
10.0% appreciation · 3.0% rent growth · sell at horizon
- IRR
- 28.5%
- Equity multiple
- 3.25×
- Total profit
- $85,118
- Equity at exit
- $121,619
- IRR
- 24.8%
- Equity multiple
- 7.39×
- Total profit
- $241,587
- Equity at exit
- $262,275
Cash invested: $37,800 (down + closing). Projections, not guarantees.
Landlord ↔ Tenant lean methodology
- Overall (STATE)
- 87 Strongly Landlord-Friendly
- State Texas
- 87 Strongly Landlord-Friendly · R+5
- County
- — inherits STATE
- City
- — inherits STATE
ZIP-level market 77422
- Home prices YoY
- 5.1%
- Active inventory
- 212
- Price-to-rent
- 8.0×
Monthly cashflow live
- Estimated rent
- $1,401 medium interval (Pro) →
- Mortgage (P&I)
- −$708
- Tax from tax record
- −$161 /mo · $1,932/yr
- Insurance
- −$56
- HOA
- −$0
- Vacancy / Maint / Mgmt
- −$294
- Net cashflow
- $182
Break-even live
UW: 25.0% down · 7.5% · 30yr · 1.5% tax · 5.0% vac · 8.0% maint · 8.0% mgmt
Financing live
Cash to close
- Down payment
- $33,750
- Closing costs
- $4,050
- Reserves months
- —
- Total cash needed
- —
Loan-product check · same deal, 3 products live
Conventional
25% down · 7.5% · 30yr
- Down + closing
- —
- Monthly P&I
- —
- Monthly cashflow
- —
- DSCR
- —
- Eligible?
- —
Personal DTI + credit; lowest rate.
DSCR
20% down · 8.5% · 30yr
- Down + closing
- —
- Monthly P&I
- —
- Monthly cashflow
- —
- DSCR
- —
- Eligible?
- —
No personal income docs; deal must DSCR.
Hard money
10% down · 12.0% · 12mo
- Down + closing
- —
- Monthly P&I
- —
- Monthly cashflow
- —
- DSCR
- —
- Eligible?
- —
Short-term bridge; refi at stabilization.
Listing history 37 events
-
2026-06-18days on market $135,000 Active 50 DOM
-
2026-06-17days on market $135,000 Active 49 DOM
-
2026-06-16days on market $135,000 Active 48 DOM
-
2026-06-15days on market $135,000 Active 47 DOM
-
2026-06-13days on market $135,000 Active 45 DOM
-
2026-06-13days on market $135,000 Active 44 DOM
-
2026-06-09days on market $135,000 Active 41 DOM
-
2026-06-08days on market $135,000 Active 40 DOM
-
2026-06-07days on market $135,000 Active 39 DOM
-
2026-06-04days on market $135,000 Active 36 DOM
-
2026-06-03days on market $135,000 Active 35 DOM
-
2026-06-02days on market $135,000 Active 34 DOM
-
2026-06-01days on market $135,000 Active 33 DOM
-
2026-05-31days on market $135,000 Active 32 DOM
-
2026-04-29$145,000 Active 444-char remark
-
2026-04-29historical
-
2026-02-24$149,990 Active
-
2025-12-18soldstatus
-
2024-10-08historical
-
2024-04-09$165,000 Active
-
2024-01-09historical
-
2023-01-10$190,000 Active
-
2023-01-09historical
-
2022-02-08historical
-
2021-12-21$200,000 Active
-
2021-06-09soldstatus
-
2021-05-17historical
-
2021-04-28$119,000 Active
-
2021-02-05soldstatus Sold
-
2021-02-05soldstatus
-
2021-02-02status Pending
-
2020-12-22price $87,000
-
2020-12-09price $89,000
-
2020-11-18price $99,000
-
2020-10-18price $102,000
-
2020-10-09$109,000 Active
-
2020-09-17soldstatus
ⓘ Source: listings_history table (triggers on properties + properties_extension) + one-shot
backfill from property_details.listing_events for pre-trigger history.
Tax reassessment forecast TX · Resets to sale price
- Current annual tax
- $1,932 · $161/mo
- Projected year-2 tax
- $2,470 · $206/mo
- Expected delta
- +$538/yr (+$45/mo · 27.9%)
ⓘ Screening estimate from a state-policy table — verify with the county assessor before closing.
Climate risk First Street
- Flood 1/10 Low FEMA zone X (unshaded) · 0% chance over 30 yrs
- Wildfire 3/10 Moderate
- Heat 10/10 Extreme 7 d/yr ≥111°F today · 25 d/yr by 30 yrs out
- Wind 9/10 Extreme 99% chance of damaging wind over 30 yrs
- Air quality 3/10 Moderate 3 unhealthy d/yr today · 3 by 30 yrs out
Nearby sold comps map
Loading sold comps map…
Walkable amenities ~0.75 mi
Loading nearby amenities…
Taxation est. · year 1
- Rental income
- $16,815
- − Mortgage interest
- −$7,562
- − Property taxes
- −$1,932
- − Insurance
- −$675
- − Repairs & maintenance
- −$1,345
- − Management
- −$1,345
- − Depreciation
- −$3,927
- Taxable income
- $28
- Est. tax owed @ 24.0%
- −$7
- After-tax cash flow
- $2,175/yr
For passive investors: Depreciation is non-cash, so a rental often shows a tax loss while cash-flowing — sheltering income. Rental losses are passive: they offset passive income freely, and up to $25,000/yr can offset ordinary (W-2) income if you actively participate and your MAGI is under $100k (phasing out to $0 by $150k); unused losses carry forward. On sale, claimed depreciation is recaptured at up to 25%, and gains may owe capital-gains tax (a 1031 exchange can defer both). Figures are a year-1 estimate at your 24.0% rate — not tax advice; consult a CPA.
Schools (NCES district)
- District
- Columbia-Brazoria ISD
- NCES district ID
- 4814670
- Math proficiency
- 35% ▼ -4.00%
- Reading proficiency
- 33% ▼ -1.00%
- Median HH income
- $57,256
- Composite
- 30.23/100
- National rank
- #6297
- State rank
- #513 of 826 in TX
Livability — Brazoria
- Score
- 61/100
- State rank
- #1001
- US rank
- #17755
Category grades
Schools grade is shown separately in the Schools card above.
Census & demographics
- Census place
- Brazoria, TX
- Population (ZIP)
- 14,548
Population outlook (Brazoria County) Hauer SSP2
- Today (2025)
- 420,414 people
- By 2030
- 457,585 · +8.8%
- By 2040
- 532,232 · +26.6%
- By 2050
- 605,399 · +44.0%
- By 2075
- 779,358 · +85.4%
- By 2100
- 883,759 · +110.2%
Race, ethnicity, and origin ACS 2023
- Neighborhood character
- Majority White (64%)
- Race & ethnicity
- White 64% Hispanic / Latino 21% Two or more races 15% Black 10%
- Hispanic origin (detail)
- Mexican 18%
- Common ancestry
- Lithuanian 3% Slovak 2% Italian 2%
- Foreign-born
- 7% · Canada
- Languages at home
- 86% English-only · Spanish 13%
Political lean MEDSL · Brazoria
- 2024 margin
- R (+19.7) · D 39.5% · R 59.2% · Other 1.3%
- 2008→2024 swing
- +9.9pp toward D · 2008: -29.6pp · 2024: -19.7pp
- All cycles
- 2024: R+19.7 2020: R+18.2 2016: R+24.6 2012: R+34.2 2008: R+29.6
Not yet ingested
- Civics
- —
Market trends
- HPI YoY
- ▲ 14.41%
- Current HPI
- 296.0632
- Rent YoY
- —
- Metro
- —
- State GDP YoY
- ▲ 3.95%
- F500 in state
- 110
Industry mix (Fortune 500 HQ in TX)
| Industry | F500 HQs | Revenue |
|---|---|---|
| Energy | 16 | $1,198B |
|
||
| Technology | 5 | $198B |
|
||
| Engineering / Construction | 4 | $72B |
|
||
| Energy Services | 3 | $60B |
|
||
| Utilities | 3 | $41B |
|
||
| Healthcare | 2 | $330B |
|
||
Price history
+23.9% since first listed24 events — show timeline
- 2026-05-26 Price Changed $135,000 HARMLS
- 2026-04-29 Listing Removed — HARMLS
- 2026-04-29 Listed $145,000 HARMLS
- 2026-02-24 Listed $149,990 HARMLS
- 2025-12-18 Sold (Public Records) — Public Records
- 2024-10-08 Listing Removed — HARMLS
- 2024-04-09 Listed $165,000 HARMLS
- 2024-01-09 Listing Removed — HARMLS
- 2023-01-10 Listed $190,000 HARMLS
- 2023-01-09 Coming Soon — HARMLS
- 2022-02-08 Listing Removed — HARMLS
- 2021-12-21 Listed $200,000 HARMLS
- 2021-06-09 Sold (Public Records) — Public Records
- 2021-05-17 Listing Removed — HARMLS
- 2021-04-28 Listed $119,000 HARMLS
- 2021-02-05 Sold (Public Records) — Public Records
- 2021-02-05 Sold (MLS) — HARMLS
- 2021-02-02 Pending — HARMLS
- 2020-12-22 Price Changed $87,000 HARMLS
- 2020-12-09 Price Changed $89,000 HARMLS
- 2020-11-18 Price Changed $99,000 HARMLS
- 2020-10-18 Price Changed $102,000 HARMLS
- 2020-10-09 Listed $109,000 HARMLS
- 2020-09-17 Sold (Public Records) — Public Records
Property tax history
+13.0%/yrLatest (2025): $1,932 · +3.5% YoY. Source: county tax records.
Cash-flow waterfall
monthlySold comps — $/sqft
last 12 mo · ≤1 miLoading sold comps…