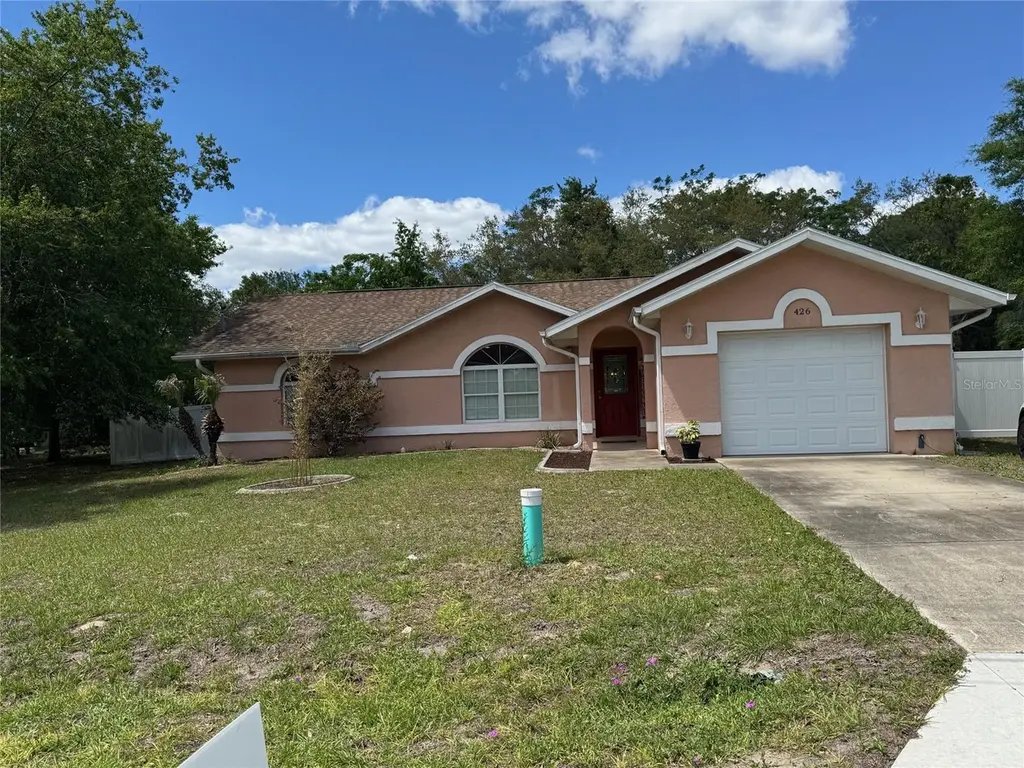
426 Spring Ln · Silver Springs Shores, FL
Flood risk 1/10 · Minimal
- FEMA flood zone
- X (unshaded)
- Chance of flooding over 30 yrs
- 0.0%
- Est. flood insurance / yr
- $507 – $1,088
Fire risk 5/10 · Moderate
- Est. fire insurance / yr
- $947 – $1,759
Heat risk 8/10 · Major
- Hot days now (above 108°F)
- 7 days/yr
- Hot days in 30 yrs
- 21 days/yr
Wind risk 9/10 · Severe
- Chance of severe wind over 30 yrs
- 99.0%
Air-quality risk 3/10 · Minor
- Unhealthy air days now
- 3 days/yr
- Unhealthy air days in 30 yrs
- 4 days/yr
Risk factors via First Street. Map © Google.
Why this score? — see what drove the F grade
The composite is a weighted blend of 9 inputs, each scored 0–100. Each bar is that input's sub-score; the figure is the points it added to the 100-point composite (weight × sub-score).
- Cash flow +9.1/30.0
- Appreciation +8.0/10.0
- Schools +3.6/10.0
- Livability +3.4/5.0
- DSCR +2.5/10.0
- Rent growth +2.5/5.0
- Condition / age +2.5/5.0
- 1% rule +2.3/10.0
- ARV discount +0.0/15.0
$219,900
🖨 Deal sheet (PDF) 📄 Offer letter ✓ Due diligence
Listing remarks MLS
BEAUTIFUL LIKE NEW HOME 3/2 SPLIT PLAN, CATHEDRAL CEILING, OPEN FLOOR PLAN, WOOD LAMINATE FLOORS THROUGHOUT, PORCELAIN TILE IN BATHROOMS, BEAUTIFUL GRANITE COUNTERTOPS, MAPLE CABINETS WITH CROWN MOLDING. FRENCH DOORS FROM DINING AREA LEADS YOU TO A LARGE ENCLOSED FLORIDA ROOM OVERLOOKING BEAUTIFUL LANDSCAPED BACKYARD WITH WOOD PRIVACY FENCE. THIS HOME WAS COMPLETELY RENOVATED IN 2010. A MUST SEE.
Key facts
- Oversized lanai
- French doors
- Vinyl fence
Tags
Property features AI
Finance
- Other: Property type: Residential, single family; Zoning: R1; Furnished: Partially
- HOA & community: No HOA; Senior community
Exterior
- Parking: Attached 2-car garage
- Utilities: Private water source (well); Septic tank; Electricity connected; Cable available
- Home design: Single family residence; One story; Faces east
- Construction: Cement siding and stucco with insulated concrete forms (ICFs); Shingle roof; Slab foundation; Built on an oversized lot (~0.41 acre)
- Exterior features: Rear porch; French doors; Vinyl fencing; Landscaped, level and private yard; Paved access
Interior
- Kitchen: Dishwasher; Microwave; Refrigerator; Exhaust fan; Electric water heater
- Bedrooms: 3 bedrooms
- Flooring: Laminate
- Bathrooms: 2 full bathrooms
- Heating & cooling: Natural gas heat; Central air conditioning
- Interior features: Ceiling fans; High ceilings; Open floor plan; Vaulted ceilings; Free standing fireplace
- Laundry & utility: Washer and dryer included; Gas dryer hookup; Laundry area located in garage
Neighborhood map
What this means for you Summary
Snapshot
- This is a 3-bed/2.0-bath single-family listed at $220k.
Deal economics
- At list price, monthly cash flow is $-171 ($-2k/yr) — negative.
- To cash-flow at today's rent, offer at most $190k (13.7% below list).
- To meet the 1% rule (rent ≥ 1% of price), the offer needs to be $160k (27.2% below list).
- Recommended offer: $160k (27.2% below list) — sets the bar for 1% rule.
Location & tenants
- Location reads 68/100 on livability (#527 in FL) — a middle-class / working-renter tenant base. Strengths: cost of living A+, housing A+, health & safety A-; Watch: crime C-, employment D, amenities F.
- Marion (rural): math 42% / reading 43% proficiency, ranked #61 of 73 in FL (top 84%) — families likely to look elsewhere, expect single-tenant / working-renter base with shorter leases; 61% free/reduced lunch — lower-income household profile, screen leases tightly.
- Zoned schools: Emerald Shores Elementary School (math 30% / reading 34%, grade F, #1,797 of 2,144 statewide, top 86%, 666 students, 74% FRL); Lake Weir Middle School (math 37% / reading 33%, grade F, #416 of 571 statewide, top 74%, 1,207 students, 76% FRL); Lake Weir High School (math 23% / reading 34%, grade F, #458 of 667 statewide, top 69%, 1,483 students, 68% FRL).
- Market conditions: Rents flat; 683 active listings in the ZIP; 39 comparable units currently listed for rent nearby; rentals at typical pace (median 23d on market — plan ~3-4 weeks tenant-placement turnaround); 7,071 units permitted in Marion County in 2024 (534 in 5+ unit buildings).
Forward outlook
- In year one you build about $15k of equity ($2k loan paydown + $13k appreciation (5.9% local appreciation)).
- Marion County population projected at +13% by 2050 — modest demand growth; plan on rents tracking national, not racing it.
- By year 3, paydown + projected appreciation supports a ~$36k cash-out refi (75% LTV) — recoverable capital for the next deal without selling this one.
Negotiation context
- It's been on market 55 days — a 3% lower offer ($213k) is reasonable based on typical stale-listing flexibility.
- 4 sale attempts since 13y ago; this cycle's ask has dropped $30k (12%) from the opening price — seller is motivated, your offer sets the floor, not the list.
- Current owner paid $125k; list at $220k implies a 76% gain — meaningful room to come down on a strong offer.
Risks & watch-outs
- Climate carrying-cost: severe wind risk, 99% chance of damaging wind over 30y; moderate wildfire risk; extreme-heat days projected 7→21/yr by 2055 (HVAC capex compounding) — expect insurance premiums to compound above CPI over the hold.
Questions for the listing agent
- What do current leases actually rent for vs. the listed asking? Can we see a recent rent roll and the last 12 months of T-12 income?
- It's been on market 55 days. Have you received any prior offers? Is the seller open to a 27% concession, seller financing, or rate buy-down credit?
- Is there a deadline driving the sale (1031 exchange, divorce, estate, relocation)? That informs how much negotiation room exists.
- Schools are F-rated, which usually means shorter tenancies and higher turnover. Who's the typical renter profile here, and what's been the actual vacancy rate?
- The area grade is low — what's the realistic commute time and amenity access for the typical tenant pool here? Any planned neighborhood developments (good or bad) we should know about?
- What's the average days-on-market for RENTAL listings here right now (not sales)? A rising rental-DOM trend means longer vacancies and softer asking-rent achievability than the comps imply.
- What's the recent tenant-quality profile in this submarket — average credit score on applications, eviction rate, late-payment / NSF rate, and stable-employment percentage? A property-management company in the area should have these aggregated.
- How much new for-sale + rental construction is in the pipeline within 1–3 miles? Heavy new supply typically softens prices + rents 12–24 months out; constrained supply supports both.
Investment metrics
- 1% rule
- 0.73% ✗
- Cap rate
- 5.36%
- Cash-on-cash
- -3.33%
- DSCR
- 0.85
- GRM
- 11.4
CMA / ARV
- ARV (on-the-fly)
- $181,195
- Comps found
- 7
Show comp detail 7 sales within ~0.75 mi
| Address | Dist | Beds/Ba | Sqft | Sold | Price | $/sf | Match |
|---|---|---|---|---|---|---|---|
| 34 Bahia Court Trak | 0.29mi | 3/2.0 | 1,211 (+4%) | 17mo | $154,979 | $128 | 66 |
| 430 Spring Dr | 0.10mi | 3/2.0 | 1,015 (-13%) | 13mo | $230,000 | $227 | 62 |
| 47 Lake Court Loop | 0.72mi | 3/2.0 | 1,151 (-2%) | 4mo | $140,000 | $122 | 61 |
| 9321 Pine Ln | 0.26mi | 3/1.0 | 1,217 (+4%) | 22mo | $188,750 | $155 | 58 |
| 35 Pine Radl | 0.63mi | 3/2.0 | 1,091 (-7%) | 2mo | $237,000 | $217 | 58 |
| 43 Pine Radl | 0.58mi | 4/2.0 (+1) | 1,242 (+6%) | 4mo | $165,000 | $133 | 54 |
| 806 Bahia Cir | 0.67mi | 3/2.0 | 1,270 (+9%) | 23mo | $261,000 | $206 | 35 |
Match score weights: distance 35% · size 25% · config 20% · recency 20%. Top-matched comps best support the ARV.
Projected returns pro-forma
5.93% appreciation · 0.17% rent growth · sell at horizon
- IRR
- 11.5%
- Equity multiple
- 1.77×
- Total profit
- $47,258
- Equity at exit
- $137,302
- IRR
- 11.6%
- Equity multiple
- 3.27×
- Total profit
- $139,700
- Equity at exit
- $248,186
Cash invested: $61,572 (down + closing). Projections, not guarantees.
Landlord ↔ Tenant lean methodology
- Overall (STATE)
- 87 Strongly Landlord-Friendly
- State Florida
- 87 Strongly Landlord-Friendly · R+3
- County
- — inherits STATE
- City
- — inherits STATE
ZIP-level market 34472
- Home prices YoY
- 2.4%
- Rents YoY
- 0.2%
- Active inventory
- 683
- Price-to-rent
- 11.4×
Monthly cashflow live
- Estimated rent
- $1,601 high interval (Pro) →
- Mortgage (P&I)
- −$1,153
- Tax from tax record
- −$191 /mo · $2,292/yr
- Insurance
- −$92
- HOA
- −$0
- Vacancy / Maint / Mgmt
- −$336
- Net cashflow
- $-171
Break-even live
Sensitivity live
| Price | -10% $-47 | -5% $-109 | +0% $-171 | +5% $-233 | +10% $-295 |
|---|---|---|---|---|---|
| Rent | -10% $-297 | -5% $-234 | +0% $-171 | +5% $-108 | +10% $-45 |
| Rate | -1.0pp $-60 | -0.5pp $-115 | base $-171 | +0.5pp $-228 | +1.0pp $-286 |
UW: 25.0% down · 7.5% · 30yr · 1.5% tax · 5.0% vac · 8.0% maint · 8.0% mgmt
Financing live
Cash to close
- Down payment
- $54,975
- Closing costs
- $6,597
- Reserves months
- —
- Total cash needed
- —
Loan-product check · same deal, 3 products live
Conventional
25% down · 7.5% · 30yr
- Down + closing
- —
- Monthly P&I
- —
- Monthly cashflow
- —
- DSCR
- —
- Eligible?
- —
Personal DTI + credit; lowest rate.
DSCR
20% down · 8.5% · 30yr
- Down + closing
- —
- Monthly P&I
- —
- Monthly cashflow
- —
- DSCR
- —
- Eligible?
- —
No personal income docs; deal must DSCR.
Hard money
10% down · 12.0% · 12mo
- Down + closing
- —
- Monthly P&I
- —
- Monthly cashflow
- —
- DSCR
- —
- Eligible?
- —
Short-term bridge; refi at stabilization.
Rent comps 39 comps
| Address | Beds | Baths | Sqft | Rent | $/sqft | DOM | Units | Dist |
|---|---|---|---|---|---|---|---|---|
| 446 Water Rd Ocala, FL | 3.0 | 2.0 | 1248 | $1,425 | $1.14 | 23d | 1 | 0.23mi |
| 455 Water Rd Ocala, FL | 3.0 | 2.0 | 1275 | $1,450 | $1.14 | 15d | 1 | 0.26mi |
| 478 Water Pl Ocala, FL | 3.0 | 2.0 | 1228 | $1,650 | $1.34 | 23d | 1 | 0.39mi |
| 60 Bahia Court Trak Ocala, FL | 3.0 | 2.0 | 1413 | $1,695 | $1.20 | 23d | 1 | 0.41mi |
| 9337 Bahia Rd Ocala, FL | 3.0 | 2.0 | 1402 | $1,765 | $1.26 | 15d | 1 | 0.45mi |
| 12 Spring Loop Ocala, FL | 2.0 | 1.0 | 900 | $1,350 | $1.50 | 15d | 1 | 0.54mi |
| 13 Pine Radial Dr Ocala, FL | 3.0 | 2.0 | 1453 | $1,795 | $1.24 | 23d | 1 | 0.54mi |
| 9649 Bahia Rd Ocala, FL | 3.0 | 2.0 | 1282 | $1,595 | $1.24 | 23d | 1 | 0.56mi |
| 54 Pine Trak Unit 104F Ocala, FL | 2.0 | 2.0 | 832 | $1,300 | $1.56 | 23d | 1 | 0.71mi |
| 5 Cedar Ln Ocala, FL | 3.0 | 2.0 | 1064 | $1,750 | $1.64 | 23d | 1 | 0.74mi |
| 58 Pine Trak Unit 104D Ocala, FL | 2.0 | 2.0 | 832 | $1,050 | $1.26 | 23d | 1 | 0.74mi |
| 62 Pine Trak Ocala, FL | 2.0 | 2.0 | 832 | $1,250 | $1.50 | 23d | 1 | 0.75mi |
| 708 Bahia Cir Ocala, FL | 3.0 | 2.0 | 1352 | $1,500 | $1.11 | 23d | 1 | 0.88mi |
| 544 Silver Crse Ocala, FL | 2.0 | 1.0 | 904 | $1,395 | $1.54 | 15d | 1 | 0.95mi |
| 7 Pine Run Ter Ocala, FL | 3.0 | 2.0 | 1432 | $1,500 | $1.05 | 15d | 1 | 1.08mi |
| 633 Silver Pass Unit B Ocala, FL | 2.0 | 2.0 | 1072 | $1,500 | $1.40 | 23d | 1 | 1.09mi |
| 593 Fairways Cir Unit A Ocala, FL | 2.0 | 1.5 | 1031 | $1,200 | $1.16 | 23d | 1 | 1.09mi |
| 43 Water Track Loop Ocala, FL | 3.0 | 2.0 | 1287 | $1,799 | $1.40 | 15d | 1 | 1.11mi |
| 549 Fairways Dr Unit A Ocala, FL | 2.0 | 2.0 | 1072 | $1,200 | $1.12 | 23d | 1 | 1.14mi |
| 561 Fairways Cir Unit A Ocala, FL | 2.0 | 1.5 | 1031 | $1,250 | $1.21 | 23d | 1 | 1.16mi |
| 532 Bahia Cir Unit A Ocala, FL | 2.0 | 1.5 | 1027 | $1,300 | $1.27 | 23d | 1 | 1.17mi |
| 553 Fairways Cir Unit B Ocala, FL | 2.0 | 2.0 | 1304 | $1,700 | $1.30 | 15d | 1 | 1.18mi |
| 8 Ash Pass Run Ocala, FL | 3.0 | 2.0 | 1128 | $1,650 | $1.46 | 23d | 1 | 1.23mi |
| 520 Fairways Cir Unit A Ocala, FL | 2.0 | 1.5 | 1027 | $1,100 | $1.07 | 23d | 1 | 1.23mi |
| 582 Fairways Cir Unit A Ocala, FL | 2.0 | 2.0 | 1304 | $1,500 | $1.15 | 23d | 1 | 1.24mi |
| 548 Fairways Cir Unit C102 Ocala, FL | 2.0 | 2.0 | 850 | $1,400 | $1.65 | 23d | 1 | 1.24mi |
| 510 Fairways Cir Unit A Ocala, FL | 2.0 | 2.0 | 1000 | $1,299 | $1.30 | 23d | 1 | 1.25mi |
| 576 Fairways Ln Unit M104 Ocala, FL | 2.0 | 2.0 | 837 | $1,250 | $1.49 | 23d | 1 | 1.28mi |
| 162 Bahia Terrace Dr Ocala, FL | 2.0 | 2.0 | 984 | $1,375 | $1.40 | 23d | 1 | 1.28mi |
| 2 Ash Dr Ocala, FL | 3.0 | 2.0 | 1083 | $1,750 | $1.62 | 15d | 1 | 1.28mi |
| 454 Fairways Cir Ocala, FL | 2.0 | 2.0 | 837 | $1,200 | $1.43 | 23d | 1 | 1.32mi |
| 454 Fairways Cir Unit B203 Ocala, FL | 2.0 | 2.0 | 850 | $1,375 | $1.62 | 23d | 1 | 1.32mi |
| 454 Fairways Cir Unit B204 Ocala, FL | 2.0 | 2.0 | 837 | $1,289 | $1.54 | 23d | 1 | 1.32mi |
| 567 Midway Trak Unit H201 Ocala, FL | 3.0 | 2.0 | 1029 | $1,350 | $1.31 | 15d | 1 | 1.33mi |
| 681 Midway Dr Unit A Ocala, FL | 2.0 | 2.0 | 1000 | $1,250 | $1.25 | 15d | 1 | 1.37mi |
| 681 Midway Dr Unit A Ocala, FL | 2.0 | 2.0 | 1000 | $1,250 | $1.25 | 23d | 1 | 1.37mi |
| 7455 Midway Ter Unit K Ocala, FL | 2.0 | 1.0 | 904 | $1,249 | $1.38 | 23d | 1 | 1.40mi |
| 43 Bahia Pass Ocala, FL | 3.0 | 2.0 | 1188 | $1,475 | $1.24 | 23d | 1 | 1.41mi |
| 608 Midway Dr Unit A Ocala, FL | 2.0 | 1.5 | 1054 | $1,500 | $1.42 | 15d | 1 | 1.49mi |
Listing history 15 events
-
2026-05-13status Pending
-
2026-05-02price $219,900
-
2026-04-21price $224,900
-
2026-03-19$249,900 Active
-
2018-02-05soldstatus $125,000
-
2018-01-31soldstatus $125,000 399-char remark
Show marketing remark (399 chars)
BEAUTIFUL LIKE NEW HOME 3/2 SPLIT PLAN, CATHEDRAL CEILING, OPEN FLOOR PLAN, WOOD LAMINATE FLOORS THROUGHOUT, PORCELAIN TILE IN BATHROOMS, BEAUTIFUL GRANITE COUNTERTOPS, MAPLE CABINETS WITH CROWN MOLDING. FRENCH DOORS FROM DINING AREA LEADS YOU TO A LARGE ENCLOSED FLORIDA ROOM OVERLOOKING BEAUTIFUL LANDSCAPED BACKYARD WITH WOOD PRIVACY FENCE. THIS HOME WAS COMPLETELY RENOVATED IN 2010. A MUST SEE.
-
2017-11-08$138,800 399-char remark
Show marketing remark (399 chars)
BEAUTIFUL LIKE NEW HOME 3/2 SPLIT PLAN, CATHEDRAL CEILING, OPEN FLOOR PLAN, WOOD LAMINATE FLOORS THROUGHOUT, PORCELAIN TILE IN BATHROOMS, BEAUTIFUL GRANITE COUNTERTOPS, MAPLE CABINETS WITH CROWN MOLDING. FRENCH DOORS FROM DINING AREA LEADS YOU TO A LARGE ENCLOSED FLORIDA ROOM OVERLOOKING BEAUTIFUL LANDSCAPED BACKYARD WITH WOOD PRIVACY FENCE. THIS HOME WAS COMPLETELY RENOVATED IN 2010. A MUST SEE.
-
2014-02-14soldstatus $72,000
-
2014-02-10soldstatus $72,000 133-char remark
Show marketing remark (133 chars)
Like new condition, split bedroom plan, cathedral ceilings, wood floors, large covered patio on back. Wood fence around back of home.
-
2014-01-03$79,900 133-char remark
Show marketing remark (133 chars)
Like new condition, split bedroom plan, cathedral ceilings, wood floors, large covered patio on back. Wood fence around back of home.
-
2013-12-17soldstatus $43,000
-
2013-07-15$45,200
-
2001-05-15soldstatus $57,000
-
2001-05-15soldstatus $57,000
-
1991-01-01soldstatus $11,000
ⓘ Source: listings_history table (triggers on properties + properties_extension) + one-shot
backfill from property_details.listing_events for pre-trigger history.
Tax reassessment forecast FL · Resets to sale price
- Current annual tax
- $2,292 · $191/mo
- Projected year-2 tax
- $2,292 · $191/mo
- Expected delta
- $0/yr ($0/mo · 0.0%)
ⓘ Screening estimate from a state-policy table — verify with the county assessor before closing.
Climate risk First Street
- Flood 1/10 Low FEMA zone X (unshaded) · 0% chance over 30 yrs
- Wildfire 5/10 Major
- Heat 8/10 Severe 7 d/yr ≥108°F today · 21 d/yr by 30 yrs out
- Wind 9/10 Extreme 99% chance of damaging wind over 30 yrs
- Air quality 3/10 Moderate 3 unhealthy d/yr today · 4 by 30 yrs out
Nearby sold comps map
Loading sold comps map…
Walkable amenities ~0.75 mi
Loading nearby amenities…
Taxation est. · year 1
- Rental income
- $19,212
- − Mortgage interest
- −$12,318
- − Property taxes
- −$2,292
- − Insurance
- −$1,100
- − Repairs & maintenance
- −$1,537
- − Management
- −$1,537
- − Depreciation
- −$6,397
- Taxable loss
- −$5,968
- Est. tax savings @ 24.0%
- +$1,432
- After-tax cash flow
- $-620/yr
For passive investors: Depreciation is non-cash, so a rental often shows a tax loss while cash-flowing — sheltering income. Rental losses are passive: they offset passive income freely, and up to $25,000/yr can offset ordinary (W-2) income if you actively participate and your MAGI is under $100k (phasing out to $0 by $150k); unused losses carry forward. On sale, claimed depreciation is recaptured at up to 25%, and gains may owe capital-gains tax (a 1031 exchange can defer both). Figures are a year-1 estimate at your 24.0% rate — not tax advice; consult a CPA.
Schools (NCES district)
- District
- Marion
- NCES district ID
- 1201260
- Math proficiency
- 42% ▼ -7.00%
- Reading proficiency
- 43% ▼ -4.00%
- Median HH income
- $40,015
- Composite
- 35.61/100
- National rank
- #4890
- State rank
- #61 of 73 in FL
Livability — Silver Springs Shores
- Score
- 68/100
- State rank
- #527
- US rank
- #9854
Category grades
Schools grade is shown separately in the Schools card above.
Census & demographics
- Census place
- Silver Springs Shores, FL
- County
- Marion County · 315,796 people
- City population
- 34,665
- Metro
- Ocala, FL
- Population (ZIP)
- 35,851
- Household income
- $64,208
- Rent vs Own
- Severe rent burden
- 655.0
Population outlook (Marion County) Hauer SSP2
- Today (2025)
- 365,905 people
- By 2030
- 376,768 · +3.0%
- By 2040
- 396,555 · +8.4%
- By 2050
- 412,723 · +12.8%
- By 2075
- 446,090 · +21.9%
- By 2100
- 436,193 · +19.2%
Race, ethnicity, and origin ACS 2023
- Neighborhood character
- Diverse neighborhood (Simpson 0.65)
- Race & ethnicity
- White 50% Hispanic / Latino 25% Black 21% Two or more races 18% Asian 2%
- Hispanic origin (detail)
- Mexican 2% Puerto Rican 14% Cuban 3%
- Common ancestry
- Romanian 2% Iranian 1% Lithuanian 1%
- Foreign-born
- 11% · Canada, Jamaica, China
- Languages at home
- 78% English-only · Spanish 19% Other Indo-European 1%
Political lean MEDSL · Marion
- 2024 margin
- Solid R (+31.6) · D 33.8% · R 65.5%
- 2008→2024 swing
- -20.0pp toward R · 2008: -11.6pp · 2024: -31.6pp
- All cycles
- 2024: R+31.6 2020: R+25.9 2016: R+26.2 2012: R+16.2 2008: R+11.6
Not yet ingested
- Civics
- —
Market trends
- HPI YoY
- ▲ 5.93%
- Current HPI
- 255.0714
- Rent YoY
- ▲ 0.17%
- Metro
- Ocala, FL
- State GDP YoY
- ▲ 3.28%
- F500 in state
- 36
Industry mix (Fortune 500 HQ in FL)
| Industry | F500 HQs | Revenue |
|---|---|---|
| Industrial Technology | 2 | $29B |
|
||
| Insurance | 2 | $17B |
|
||
| Retail | 1 | $60B |
|
||
| Technology Distribution | 1 | $58B |
|
||
| Homebuilding | 1 | $35B |
|
||
| Technology Manufacturing | 1 | $35B |
|
||
Price history
+1899.1% since first listed15 events — show timeline
- 2026-05-13 Pending — Stellar MLS as Distributed by MLS Grid
- 2026-05-02 Price Changed $219,900 Stellar MLS as Distributed by MLS Grid
- 2026-04-21 Price Changed $224,900 Stellar MLS as Distributed by MLS Grid
- 2026-03-19 Listed $249,900 Stellar MLS as Distributed by MLS Grid
- 2018-02-05 Sold (Public Records) $125,000 Public Records
- 2018-01-31 Sold (MLS) $125,000 Stellar MLS as Distributed by MLS Grid
- 2017-11-08 Listed $138,800 Stellar MLS as Distributed by MLS Grid
- 2014-02-14 Sold (Public Records) $72,000 Public Records
- 2014-02-10 Sold (MLS) $72,000 Stellar MLS as Distributed by MLS Grid
- 2014-01-03 Listed $79,900 Stellar MLS as Distributed by MLS Grid
- 2013-12-17 Sold (MLS) $43,000 Stellar MLS as Distributed by MLS Grid
- 2013-07-15 Listed $45,200 Stellar MLS as Distributed by MLS Grid
- 2001-05-15 Sold (Public Records) $57,000 Public Records
- 2001-05-15 Sold (Public Records) $57,000 Public Records
- 1991-01-01 Sold (Public Records) $11,000 Public Records
Property tax history
+6.8%/yrLatest (2025): $2,292 · +12.1% YoY. Source: county tax records.
Cash-flow waterfall
monthlySold comps — $/sqft
last 12 mo · ≤1 miLoading sold comps…