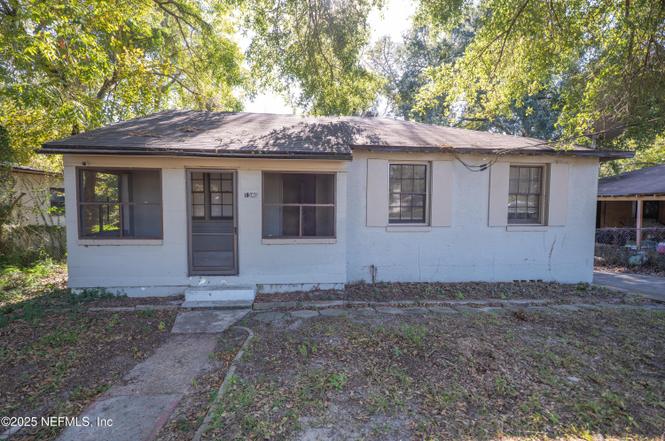
1340 Carvill Ave · Jacksonville, FL
Flood risk 4/10 · Minor
- FEMA flood zone
- X (unshaded)
- Chance of flooding over 30 yrs
- 0.21%
- Est. flood insurance / yr
- $507 – $1,088
Fire risk 3/10 · Minor
- Est. fire insurance / yr
- $947 – $1,759
Heat risk 9/10 · Severe
- Hot days now (above 107°F)
- 6 days/yr
- Hot days in 30 yrs
- 17 days/yr
Wind risk 9/10 · Severe
- Chance of severe wind over 30 yrs
- 99.0%
Air-quality risk 4/10 · Minor
- Unhealthy air days now
- 6 days/yr
- Unhealthy air days in 30 yrs
- 6 days/yr
Risk factors via First Street. Map © Google.
Why this score? — see what drove the C- grade
The composite is a weighted blend of 9 inputs, each scored 0–100. Each bar is that input's sub-score; the figure is the points it added to the 100-point composite (weight × sub-score).
- Cash flow +23.6/30.0
- DSCR +7.6/10.0
- 1% rule +6.4/10.0
- Livability +4.2/5.0
- ARV discount +4.0/15.0
- Schools +3.9/10.0
- Condition / age +2.5/5.0
- Rent growth +2.2/5.0
- Appreciation +0.0/10.0
$110,000
🖨 Deal sheet (PDF) 📄 Offer letter ✓ Due diligence
Listing remarks MLS
NICE 3-BEDROOM, 1-BATH CB STUCCO HOME WITH DETACHED GARAGE. JUST NEEDS 'TLC'.' SELLER ACQUIRED PROPERTY THROUGH FORECLOSURE. SELLER & AGENT MAKE NO REPRESENTATIONS OR WARRANTIES, UNAWARE OF ANY DEFECTS OR LEAD BASED PAINTS. BEING SOLD ''AS IS''. ALL INFO TO BE VERIFIED BY BUYER. PROOF OF FUNDS OR PRE-APPROVAL LETTER IS REQUIRED BY SELLER.
Key facts
- Multiple sheds
- No hoa restrictions
- Wood cabinetry
Tags
Property features AI
Finance
- HOA & community: Not a senior community
Exterior
- Parking: 1-car garage; Other parking
- Utilities: Other utilities
- Home design: Single-family residence; 0.6-acre lot
- Exterior features: Other structures on the property; Currently used for other purposes
Interior
- Kitchen: Other appliances
- Bedrooms: 3 bedrooms
- Bathrooms: 1 full bathroom
- Heating & cooling: Has cooling (other type)
- Interior features: Other interior features
Neighborhood map
What this means for you Summary
Snapshot
- This is a 3-bed/1.0-bath single-family listed at $110k.
Deal economics
- At list price, monthly cash flow is $207 ($2k/yr) — positive.
- The deal already cash-flows at list — no discount required.
- Meets the 1% rule at list price ($1k rent vs $110k).
- Recommended offer: $97k (12.0% below list) — sets the bar for market timing.
- Cap rate 8.5% vs local median 3.9% in Jacksonville — top-decile yield for the area; either an underpriced asset or a hidden risk that comps aren't pricing in. Stress-test before assuming the spread holds.
Location & tenants
- Location reads 83/100 on livability (#50 in FL, #911 nationally) — a professional / high-income tenant draw. Strengths: amenities A+, commute A+, housing A+.
- Duval (urban): math 46% / reading 45% proficiency, ranked #48 of 73 in FL (top 66%) — families likely to look elsewhere, expect single-tenant / working-renter base with shorter leases.
- Zoned schools: Northwestern Legends Elementary (math 21% / reading 14%, grade F, #2,117 of 2,144 statewide, top 99%, 528 students, 88% FRL); Joseph Stilwell Middle School (math 31% / reading 33%, grade F, #448 of 571 statewide, top 79%, 612 students, 68% FRL); Jean Ribault High School (math 22% / reading 25%, grade F, #533 of 667 statewide, top 80%, 1,385 students, 71% FRL) — zoned schools average 76% FRL vs 49% district-wide (27 pts higher); higher-poverty schools than district average — tighter screening recommended.
- Zoned-school proficiency averages 24% at this address vs 46% district-wide (-21 pts) — the specific schools serving this property underperform the Duval average; the district grade overstates school quality for this exact location.
- Market conditions: Rents soft (-1.4%/yr); 296 active listings in the ZIP; 40 comparable units currently listed for rent nearby; rentals at typical pace (median 20d on market — plan ~3-4 weeks tenant-placement turnaround); lower-income renter base — watch delinquency; 6,503 units permitted in Duval County in 2024 (1,131 in 5+ unit buildings).
Forward outlook
- Local home prices are declining (-3.0%/yr); year-one equity from $761 of loan paydown is wiped out by about $3k of value loss. Plan a longer hold.
- Duval County population projected at +19% by 2050 — long-run rental-demand tailwind backs the buy-and-hold thesis.
Negotiation context
- It's been on market 219 days — a 12% lower offer ($97k) is reasonable based on typical stale-listing flexibility.
- 4 sale attempts since 22y ago; this cycle's ask has dropped $50k (31%) from the opening price — seller is motivated, your offer sets the floor, not the list.
- Current owner paid $45k; list at $110k implies a 145% gain — meaningful room to come down on a strong offer.
Risks & watch-outs
- Watch-outs: built in 1947 — expect roof / HVAC / electrical / plumbing capex.
- Climate carrying-cost: severe wind risk, 99% chance of damaging wind over 30y; extreme-heat days projected 6→17/yr by 2055 (HVAC capex compounding) — expect insurance premiums to compound above CPI over the hold.
Questions for the listing agent
- It's been on market 219 days. Have you received any prior offers? Is the seller open to a 12% concession, seller financing, or rate buy-down credit?
- Built in 1947 — when were the roof, HVAC, electrical panel, plumbing, and water heater last replaced?
- Why hasn't it sold? Are there any deal-killer items the seller is aware of (foundation, flood, title, zoning, code violations)?
- Is there a deadline driving the sale (1031 exchange, divorce, estate, relocation)? That informs how much negotiation room exists.
- Schools are B-rated — typically a magnet for longer-tenancy family renters. What's the average tenant stay here, and is there a school-zone premium baked into asking?
- What's the average days-on-market for RENTAL listings here right now (not sales)? A rising rental-DOM trend means longer vacancies and softer asking-rent achievability than the comps imply.
- What's the recent tenant-quality profile in this submarket — average credit score on applications, eviction rate, late-payment / NSF rate, and stable-employment percentage? A property-management company in the area should have these aggregated.
- How much new for-sale + rental construction is in the pipeline within 1–3 miles? Heavy new supply typically softens prices + rents 12–24 months out; constrained supply supports both.
Investment metrics
- 1% rule
- 1.14% ✓
- Cap rate
- 8.55%
- Cash-on-cash
- 8.06%
- DSCR
- 1.36
- GRM
- 7.3
CMA / ARV
- ARV (on-the-fly)
- $102,120
- Comps found
- 12
Show comp detail 12 sales within ~0.75 mi
| Address | Dist | Beds/Ba | Sqft | Sold | Price | $/sf | Match |
|---|---|---|---|---|---|---|---|
| 7069 Alan Ave | 0.11mi | 3/1.0 | 872 (-2%) | 8mo | $129,900 | $149 | 85 |
| 753 Fernway St | 0.51mi | 3/1.0 | 929 (+5%) | 1mo | $110,000 | $118 | 68 |
| 7400 Fernandina Ave | 0.42mi | 2/1.0 (-1) | 933 (+5%) | 1mo | $28,000 | $30 | 66 |
| 7447 Oriole St | 0.49mi | 3/1.5 | 912 (+3%) | 8mo | $71,250 | $78 | 64 |
| 831 Ashford St | 0.40mi | 2/2.0 (-1) | 912 (+3%) | 8mo | $40,000 | $44 | 62 |
| 950 Ashton St | 0.33mi | 3/1.0 | 1,000 (+13%) | 4mo | $142,500 | $143 | 60 |
| 5752 Oprey St | 0.64mi | 3/2.0 | 912 (+3%) | 6mo | $110,000 | $121 | 57 |
| 5298 Golfbrook Dr | 0.64mi | 2/1.0 (-1) | 875 (-2%) | 8mo | $116,500 | $133 | 56 |
| 733 Escambia St | 0.68mi | 3/1.0 | 975 (+10%) | 0mo | $90,000 | $92 | 52 |
| 719 Escambia St | 0.69mi | 3/1.0 | 912 (+3%) | 19mo | $105,000 | $115 | 47 |
| 816 Ashford St | 0.43mi | 3/2.0 | 1,007 (+13%) | 10mo | $116,000 | $115 | 45 |
| 844 Crestwood St | 0.60mi | 2/1.0 (-1) | 792 (-11%) | 6mo | $75,000 | $95 | 44 |
Match score weights: distance 35% · size 25% · config 20% · recency 20%. Top-matched comps best support the ARV.
Projected returns pro-forma
-3.0% appreciation · 0.0% rent growth · sell at horizon
- IRR
- -7.5%
- Equity multiple
- 0.73×
- Total profit
- $-8,293
- Equity at exit
- $16,401
- IRR
- -2.4%
- Equity multiple
- 0.86×
- Total profit
- $-4,319
- Equity at exit
- $9,511
Cash invested: $30,800 (down + closing). Projections, not guarantees.
Landlord ↔ Tenant lean methodology
- Overall (STATE)
- 87 Strongly Landlord-Friendly
- State Florida
- 87 Strongly Landlord-Friendly · R+3
- County
- — inherits STATE
- City
- — inherits STATE
ZIP-level market 32208
- Home prices YoY
- -33.6%
- Rents YoY
- -1.4%
- Active inventory
- 296
- Price-to-rent
- 7.3×
Monthly cashflow live
- Estimated rent
- $1,253 high interval (Pro) →
- Mortgage (P&I)
- −$577
- Tax from tax record
- −$161 /mo · $1,926/yr
- Insurance
- −$46
- HOA
- −$0
- Lot rent
- −$0
- Vacancy / Maint / Mgmt
- −$263
- Net cashflow
- $207
Break-even live
Sensitivity live
| Price | -10% $269 | -5% $238 | +0% $207 | +5% $176 | +10% $145 |
|---|---|---|---|---|---|
| Rent | -10% $108 | -5% $157 | +0% $207 | +5% $256 | +10% $306 |
| Rate | -1.0pp $262 | -0.5pp $235 | base $207 | +0.5pp $178 | +1.0pp $149 |
UW: 25.0% down · 7.5% · 30yr · 1.5% tax · 5.0% vac · 8.0% maint · 8.0% mgmt
Financing live
Cash to close
- Down payment
- $27,500
- Closing costs
- $3,300
- Reserves months
- —
- Total cash needed
- —
Loan-product check · same deal, 3 products live
Conventional
25% down · 7.5% · 30yr
- Down + closing
- —
- Monthly P&I
- —
- Monthly cashflow
- —
- DSCR
- —
- Eligible?
- —
Personal DTI + credit; lowest rate.
DSCR
20% down · 8.5% · 30yr
- Down + closing
- —
- Monthly P&I
- —
- Monthly cashflow
- —
- DSCR
- —
- Eligible?
- —
No personal income docs; deal must DSCR.
Hard money
10% down · 12.0% · 12mo
- Down + closing
- —
- Monthly P&I
- —
- Monthly cashflow
- —
- DSCR
- —
- Eligible?
- —
Short-term bridge; refi at stabilization.
Rent comps 40 comps
| Address | Beds | Baths | Sqft | Rent | $/sqft | DOM | Units | Dist |
|---|---|---|---|---|---|---|---|---|
| 961 Dorchester St Jacksonville, FL | 2.0 | 1.0 | 884 | $1,025 | $1.16 | 5d | 1 | 0.23mi |
| 1059 Glencarin St Jacksonville, FL | 2.0 | 1.0 | 645 | $897 | $1.39 | 7d | 1 | 0.26mi |
| 1136 Maynard St Jacksonville, FL | 2.0 | 1.0 | 919 | $1,045 | $1.14 | 26d | 1 | 0.36mi |
| 810 Laurel St Jacksonville, FL | 3.0 | 1.0 | 962 | $1,295 | $1.35 | 0d | 1 | 0.40mi |
| 1536 W 45th St Jacksonville, FL | 2.0 | 1.0 | 800 | $1,050 | $1.31 | 26d | 1 | 0.55mi |
| 1567 Rutledge Ave Jacksonville, FL | 3.0 | 2.0 | 1050 | $1,113 | $1.06 | 26d | 1 | 0.58mi |
| 5736 Teeler Ave Jacksonville, FL | 3.0 | 1.0 | 852 | $1,000 | $1.17 | 26d | 1 | 0.75mi |
| 7210 Elwood Ave Jacksonville, FL | 2.0 | 1.0 | 831 | $995 | $1.20 | 24d | 1 | 0.76mi |
| 535 W 59th St Jacksonville, FL | 3.0 | 2.0 | 816 | $1,395 | $1.71 | 10d | 1 | 0.81mi |
| 5514 Long St Jacksonville, FL | 2.0 | 1.0 | 941 | $1,250 | $1.33 | 4d | 1 | 0.84mi |
| 5616 Calvin Ave Jacksonville, FL | 3.0 | 1.0 | 1008 | $1,195 | $1.19 | 10d | 1 | 0.85mi |
| 4813 Moncrief Rd Jacksonville, FL | 2.0–3.0 | 1.0 | 755 | $917 | $1.21 | 0d | 8 | 0.85mi |
| 7124 Lorain St Jacksonville, FL | 3.0 | 1.0 | 864 | $1,043 | $1.21 | 5d | 1 | 0.87mi |
| 6460 Lanark Ave Jacksonville, FL | 2.0 | 1.0 | 708 | $1,095 | $1.55 | 26d | 1 | 0.88mi |
| 7511 N Shore Dr Jacksonville, FL | 2.0 | 1.0 | 1014 | $1,350 | $1.33 | 7d | 1 | 0.88mi |
| 7927 Reid Ave Jacksonville, FL | 3.0 | 1.0 | 1055 | $1,500 | $1.42 | 26d | 1 | 0.89mi |
| 485 W 58th St Jacksonville, FL | 3.0 | 2.0 | 986 | $1,181 | $1.20 | 0d | 1 | 0.91mi |
| 385 Duray Ct Jacksonville, FL | 3.0 | 1.0 | 932 | $1,250 | $1.34 | 22d | 1 | 0.94mi |
| 562 W 49th St Jacksonville, FL | 3.0 | 1.0 | 1091 | $1,195 | $1.10 | 26d | 1 | 0.96mi |
| 356 Duray Ct Jacksonville, FL | 3.0 | 2.0 | 1070 | $1,425 | $1.33 | 16d | 1 | 0.98mi |
| 5352 Dodge Rd Jacksonville, FL | 3.0 | 2.0 | 1050 | $1,261 | $1.20 | 26d | 1 | 0.99mi |
| 5350 Dodge Rd Jacksonville, FL | 3.0 | 1.0 | 1000 | $1,500 | $1.50 | 26d | 1 | 1.00mi |
| 1803 W 44th St Unit 1803 Jacksonville, FL | 2.0 | 1.0 | 750 | $950 | $1.27 | 10d | 1 | 1.01mi |
| 1823 W 44th St Jacksonville, FL | 3.0 | 2.0 | 1066 | $1,500 | $1.41 | 26d | 1 | 1.02mi |
| 4721 E Castlewood Dr Jacksonville, FL | 3.0 | 1.0 | 1008 | $1,250 | $1.24 | 26d | 1 | 1.04mi |
| 425 W 47th St Jacksonville, FL | 3.0 | 1.5 | 1083 | $1,193 | $1.10 | 10d | 1 | 1.05mi |
| 1653 W 35th St Jacksonville, FL | 2.0 | 1.0 | 800 | $825 | $1.03 | 26d | 1 | 1.09mi |
| 319 W 49th St Jacksonville, FL | 2.0 | 1.0 | 977 | $1,200 | $1.23 | 26d | 1 | 1.09mi |
| 1551 W 33rd St #2 Jacksonville, FL | 2.0 | 1.0 | 842 | $795 | $0.94 | 23d | 1 | 1.11mi |
| 1417 W 31st St Jacksonville, FL | 3.0 | 1.0 | 880 | $1,100 | $1.25 | 4d | 1 | 1.13mi |
| 4114 Moncrief Rd Jacksonville, FL | 2.0 | 1.0 | 821 | $975 | $1.19 | 10d | 1 | 1.14mi |
| 4114 Moncrief Rd Unit 2 Jacksonville, FL | 2.0 | 1.0 | 821 | $1,050 | $1.28 | 26d | 1 | 1.14mi |
| 1316 W 31st St Jacksonville, FL | 2.0 | 1.0 | 906 | $998 | $1.10 | 26d | 1 | 1.14mi |
| 1959 W 45th St Jacksonville, FL | 2.0 | 1.0 | 895 | $1,245 | $1.39 | 16d | 1 | 1.15mi |
| 346 W 68th St Jacksonville, FL | 3.0 | 1.0 | 1114 | $1,305 | $1.17 | 0d | 1 | 1.17mi |
| 1196 W 30th St Jacksonville, FL | 2.0 | 1.0 | 875 | $880 | $1.01 | 20d | 1 | 1.19mi |
| 1544 Breton Rd Jacksonville, FL | 3.0 | 1.0 | 918 | $1,255 | $1.37 | 0d | 1 | 1.20mi |
| 411 W 41st St Jacksonville, FL | 3.0 | 1.0 | 1100 | $1,195 | $1.09 | 0d | 1 | 1.21mi |
| 917 W 30th St Jacksonville, FL | 2.0 | 1.0 | 672 | $1,200 | $1.79 | 20d | 1 | 1.23mi |
| 666 Basswood St Jacksonville, FL | 3.0 | 1.0 | 1002 | $1,400 | $1.40 | 26d | 1 | 1.23mi |
Listing history 25 events
-
2026-06-22days on market $110,000 Active 219 DOM
-
2026-06-21days on market $110,000 Active 218 DOM
-
2026-06-18days on market $110,000 Active 215 DOM
-
2026-06-17days on market $110,000 Active 214 DOM
-
2026-06-16days on market $110,000 Active 213 DOM
-
2026-06-15days on market $110,000 Active 212 DOM
-
2026-06-10days on market $110,000 Active 206 DOM
-
2026-06-08days on market $110,000 Active 205 DOM
-
2026-06-08days on market $110,000 Active 204 DOM
-
2026-06-03days on market $110,000 Active 200 DOM
-
2026-06-02days on market $110,000 Active 199 DOM
-
2026-06-01days on market $110,000 Active 198 DOM
-
2026-05-31days on market $110,000 Active 197 DOM
-
2026-02-21price $110,000
-
2026-01-20price $130,000
-
2025-11-15$160,000 Active
-
2008-04-19historical 344-char remark
Show marketing remark (344 chars)
NICE 3-BEDROOM, 1-BATH CB STUCCO HOME WITH DETACHED GARAGE. JUST NEEDS 'TLC'.' SELLER ACQUIRED PROPERTY THROUGH FORECLOSURE. SELLER & AGENT MAKE NO REPRESENTATIONS OR WARRANTIES, UNAWARE OF ANY DEFECTS OR LEAD BASED PAINTS. BEING SOLD ''AS IS''. ALL INFO TO BE VERIFIED BY BUYER. PROOF OF FUNDS OR PRE-APPROVAL LETTER IS REQUIRED BY SELLER.
-
2008-01-24soldstatus $44,900 344-char remark
Show marketing remark (344 chars)
NICE 3-BEDROOM, 1-BATH CB STUCCO HOME WITH DETACHED GARAGE. JUST NEEDS 'TLC'.' SELLER ACQUIRED PROPERTY THROUGH FORECLOSURE. SELLER & AGENT MAKE NO REPRESENTATIONS OR WARRANTIES, UNAWARE OF ANY DEFECTS OR LEAD BASED PAINTS. BEING SOLD ''AS IS''. ALL INFO TO BE VERIFIED BY BUYER. PROOF OF FUNDS OR PRE-APPROVAL LETTER IS REQUIRED BY SELLER.
-
2007-05-31$44,900 344-char remark
Show marketing remark (344 chars)
NICE 3-BEDROOM, 1-BATH CB STUCCO HOME WITH DETACHED GARAGE. JUST NEEDS 'TLC'.' SELLER ACQUIRED PROPERTY THROUGH FORECLOSURE. SELLER & AGENT MAKE NO REPRESENTATIONS OR WARRANTIES, UNAWARE OF ANY DEFECTS OR LEAD BASED PAINTS. BEING SOLD ''AS IS''. ALL INFO TO BE VERIFIED BY BUYER. PROOF OF FUNDS OR PRE-APPROVAL LETTER IS REQUIRED BY SELLER.
-
2005-06-02soldstatus $75,000
-
2005-05-20soldstatus $75,000 233-char remark
Show marketing remark (233 chars)
Nice 3-bedroom, 1-bath home that has been recently Rehabed. New interior/exterior paint, floor coverings, kitchen & bathroom fixtures, light fixtures and new roof. Deep lot that goes down to the creek. 1-Car Garage with Workshop.
-
2005-01-23$80,900 233-char remark
Show marketing remark (233 chars)
Nice 3-bedroom, 1-bath home that has been recently Rehabed. New interior/exterior paint, floor coverings, kitchen & bathroom fixtures, light fixtures and new roof. Deep lot that goes down to the creek. 1-Car Garage with Workshop.
-
2004-10-08soldstatus $45,000
-
2004-08-20$47,500
-
1996-01-30soldstatus $10,000
ⓘ Source: listings_history table (triggers on properties + properties_extension) + one-shot
backfill from property_details.listing_events for pre-trigger history.
Tax reassessment forecast FL · Resets to sale price
- Current annual tax
- $1,926 · $161/mo
- Projected year-2 tax
- $1,926 · $161/mo
- Expected delta
- $0/yr ($0/mo · 0.0%)
ⓘ Screening estimate from a state-policy table — verify with the county assessor before closing.
Climate risk First Street
- Flood 4/10 Moderate FEMA zone X (unshaded) · 21% chance over 30 yrs
- Wildfire 3/10 Moderate
- Heat 9/10 Extreme 6 d/yr ≥107°F today · 17 d/yr by 30 yrs out
- Wind 9/10 Extreme 99% chance of damaging wind over 30 yrs
- Air quality 4/10 Moderate 6 unhealthy d/yr today · 6 by 30 yrs out
Nearby sold comps map
Loading sold comps map…
Walkable amenities ~0.75 mi
Loading nearby amenities…
Taxation est. · year 1
- Rental income
- $15,038
- − Mortgage interest
- −$6,162
- − Property taxes
- −$1,926
- − Insurance
- −$550
- − Repairs & maintenance
- −$1,203
- − Management
- −$1,203
- − Depreciation
- −$3,200
- Taxable income
- $794
- Est. tax owed @ 24.0%
- −$191
- After-tax cash flow
- $2,291/yr
For passive investors: Depreciation is non-cash, so a rental often shows a tax loss while cash-flowing — sheltering income. Rental losses are passive: they offset passive income freely, and up to $25,000/yr can offset ordinary (W-2) income if you actively participate and your MAGI is under $100k (phasing out to $0 by $150k); unused losses carry forward. On sale, claimed depreciation is recaptured at up to 25%, and gains may owe capital-gains tax (a 1031 exchange can defer both). Figures are a year-1 estimate at your 24.0% rate — not tax advice; consult a CPA.
Schools (NCES district)
- District
- Duval
- NCES district ID
- 1200480
- Math proficiency
- 46% ▼ -11.00%
- Reading proficiency
- 45% ▼ -4.00%
- Median HH income
- $48,987
- Composite
- 38.97/100
- National rank
- #4076
- State rank
- #48 of 73 in FL
Livability — Jacksonville
- Score
- 83/100
- State rank
- #50
- US rank
- #911
Category grades
Schools grade is shown separately in the Schools card above.
Census & demographics
- Census place
- Jacksonville, FL
- County
- Duval County · 1,015,274 people
- City population
- 979,034
- Metro
- Jacksonville, FL
- Population (ZIP)
- 32,699
- Household income
- $41,324
- Rent vs Own
- Severe rent burden
- 1765.0
Population outlook (Duval County) Hauer SSP2
- Today (2025)
- 1,013,010 people
- By 2030
- 1,059,228 · +4.6%
- By 2040
- 1,141,439 · +12.7%
- By 2050
- 1,205,258 · +19.0%
- By 2075
- 1,324,282 · +30.7%
- By 2100
- 1,319,620 · +30.3%
Race, ethnicity, and origin ACS 2023
- Neighborhood character
- Predominantly Black (77%)
- Race & ethnicity
- Black 77% White 16% Two or more races 4% Hispanic / Latino 3%
- Common ancestry
- Italian 1%
- Foreign-born
- 2% · Canada
- Languages at home
- 97% English-only · Spanish 2%
Political lean MEDSL · Duval
- 2024 margin
- Toss-up / Even · D 48.7% · R 50.1% · Other 1.2%
- 2008→2024 swing
- +0.4pp no change · 2008: -1.9pp · 2024: -1.5pp
- All cycles
- 2024: R+1.5 2020: D+3.8 2016: R+1.5 2012: R+3.6 2008: R+1.9
Not yet ingested
- Civics
- —
Market trends
- HPI YoY
- ▼ -110.56%
- Current HPI
- 217.9706
- Rent YoY
- ▼ -1.36%
- Metro
- Jacksonville, FL
- State GDP YoY
- ▲ 3.28%
- F500 in state
- 36
Industry mix (Fortune 500 HQ in FL)
| Industry | F500 HQs | Revenue |
|---|---|---|
| Industrial Technology | 2 | $29B |
|
||
| Insurance | 2 | $17B |
|
||
| Retail | 1 | $60B |
|
||
| Technology Distribution | 1 | $58B |
|
||
| Homebuilding | 1 | $35B |
|
||
| Technology Manufacturing | 1 | $35B |
|
||
Price history
+1000.0% since first listed12 events — show timeline
- 2026-02-21 Price Changed $110,000 realMLS
- 2026-01-20 Price Changed $130,000 realMLS
- 2025-11-15 Listed $160,000 realMLS
- 2008-04-19 Listing Removed — realMLS
- 2008-01-24 Sold (MLS) $44,900 realMLS
- 2007-05-31 Listed $44,900 realMLS
- 2005-06-02 Sold (Public Records) $75,000 Public Records
- 2005-05-20 Sold (MLS) $75,000 realMLS
- 2005-01-23 Listed $80,900 realMLS
- 2004-10-08 Sold (Public Records) $45,000 Public Records
- 2004-08-20 Listed $47,500 realMLS
- 1996-01-30 Sold (Public Records) $10,000 Public Records
Property tax history
+7.2%/yrLatest (2025): $1,926 · +21.0% YoY. Source: county tax records.
Cash-flow waterfall
monthlySold comps — $/sqft
last 12 mo · ≤1 miLoading sold comps…