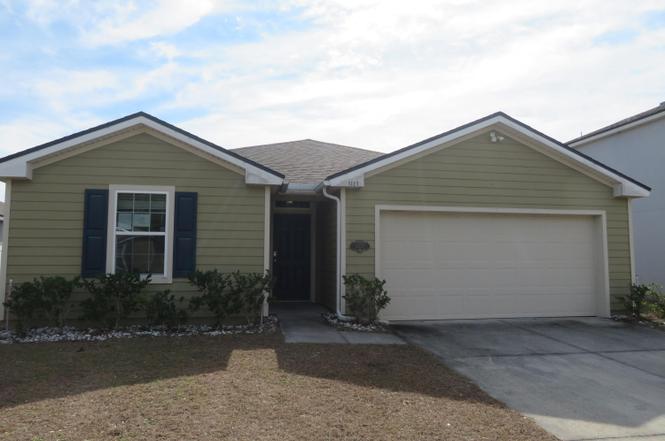
4327 Warm Springs Way · Middleburg, FL
Flood risk 1/10 · Minimal
- FEMA flood zone
- X (unshaded)
- Chance of flooding over 30 yrs
- 0.0%
- Est. flood insurance / yr
- $507 – $1,088
Fire risk 8/10 · Major
- Est. fire insurance / yr
- $947 – $1,759
Heat risk 8/10 · Major
- Hot days now (above 108°F)
- 7 days/yr
- Hot days in 30 yrs
- 19 days/yr
Wind risk 9/10 · Severe
- Chance of severe wind over 30 yrs
- 99.0%
Air-quality risk 3/10 · Minor
- Unhealthy air days now
- 3 days/yr
- Unhealthy air days in 30 yrs
- 3 days/yr
Risk factors via First Street. Map © Google.
Why this score? — see what drove the D grade
The composite is a weighted blend of 9 inputs, each scored 0–100. Each bar is that input's sub-score; the figure is the points it added to the 100-point composite (weight × sub-score).
- ARV discount +13.4/15.0
- Cash flow +10.4/30.0
- Schools +5.1/10.0
- 1% rule +3.8/10.0
- Rent growth +3.3/5.0
- Livability +3.2/5.0
- DSCR +3.0/10.0
- Condition / age +2.5/5.0
- Appreciation +0.0/10.0
$259,500
🖨 Deal sheet (PDF) 📄 Offer letter ✓ Due diligence
Listing remarks MLS
Welcome home to this 2020 split floor plan 4 bedroom, 2 bath home in a heavily sought after neighborhood! Why wait for new contractions with you can have Like-New Construction without the wait. Boasting an open floorpan, eat in kitchen area, indoor laundry room and plenty of space for family and friends - this home won't disappoint. Schedule your showing today!
Key facts
- Split-bed floorplan
- Ceiling fans
- Walk-in closets
Tags
Neighborhood map
What this means for you Summary
Snapshot
- This is a 4-bed/2.0-bath single-family listed at $260k.
Deal economics
- At list price, monthly cash flow is $-137 ($-2k/yr) — negative.
- To cash-flow at today's rent, offer at most $235k (9.3% below list).
- To meet the 1% rule (rent ≥ 1% of price), the offer needs to be $230k (11.5% below list).
- Recommended offer: $230k (11.5% below list) — sets the bar for 1% rule.
- Cap rate 5.7% vs local median 3.8% in Middleburg — top-decile yield for the area; either an underpriced asset or a hidden risk that comps aren't pricing in. Stress-test before assuming the spread holds.
Location & tenants
- Location reads 65/100 on livability (#657 in FL) — a middle-class / working-renter tenant base. Strengths: cost of living A+, housing A+; Watch: amenities F, commute F, health & safety F.
- Clay (suburban): math 58% / reading 59% proficiency, ranked #14 of 73 in FL (top 19%) — acceptable for families but not a draw, mixed tenant base, ~2y average lease.
- Zoned schools: Middleburg Elementary School (math 65% / reading 61%, grade B, #582 of 2,144 statewide, top 28%, 559 students, 100% FRL); Wilkinson Junior High School (math 54% / reading 49%, grade C, #232 of 571 statewide, top 41%, 752 students, 100% FRL); Middleburg High School (math 41% / reading 52%, grade D-, #216 of 667 statewide, top 33%, 1,852 students, 47% FRL) — zoned schools average 82% FRL vs 35% district-wide (47 pts higher); higher-poverty schools than district average — tighter screening recommended.
- Market conditions: Rents rising (+3.4%/yr); 610 active listings in the ZIP; 5 comparable units currently listed for rent nearby; rentals leasing fast (median 6d on market — plan ~1-2 weeks tenant-placement turnaround); solid renter incomes; 1,876 units permitted in Clay County in 2024 (14 in 5+ unit buildings).
- This rent runs 33% of the median local income ($84k/yr) — at the standard rent-burdened threshold; future hikes will face affordability resistance.
Forward outlook
- Local home prices are declining (-3.0%/yr); year-one equity from $2k of loan paydown is wiped out by about $8k of value loss. Plan a longer hold.
- Clay County population projected at +19% by 2050 — long-run rental-demand tailwind backs the buy-and-hold thesis.
Negotiation context
- It's been on market 41 days — a 3% lower offer ($252k) is reasonable based on typical stale-listing flexibility.
- 4 sale attempts since 6y ago with the ask held roughly flat each time — persistent listings suggest the price (not the market) is what's stuck; bring a comps-based counter.
Risks & watch-outs
- Climate carrying-cost: severe wind risk, 99% chance of damaging wind over 30y; severe wildfire risk; extreme-heat days projected 7→19/yr by 2055 (HVAC capex compounding) — expect insurance premiums to compound above CPI over the hold.
Questions for the listing agent
- What do current leases actually rent for vs. the listed asking? Can we see a recent rent roll and the last 12 months of T-12 income?
- It's been on market 41 days. Have you received any prior offers? Is the seller open to a 12% concession, seller financing, or rate buy-down credit?
- What does the HOA fee cover, when was the last increase, and are there any pending special assessments or reserve-fund shortfalls?
- Is there a deadline driving the sale (1031 exchange, divorce, estate, relocation)? That informs how much negotiation room exists.
- Schools are B-rated — typically a magnet for longer-tenancy family renters. What's the average tenant stay here, and is there a school-zone premium baked into asking?
- The area grade is low — what's the realistic commute time and amenity access for the typical tenant pool here? Any planned neighborhood developments (good or bad) we should know about?
- What's the average days-on-market for RENTAL listings here right now (not sales)? A rising rental-DOM trend means longer vacancies and softer asking-rent achievability than the comps imply.
- What's the recent tenant-quality profile in this submarket — average credit score on applications, eviction rate, late-payment / NSF rate, and stable-employment percentage? A property-management company in the area should have these aggregated.
- How much new for-sale + rental construction is in the pipeline within 1–3 miles? Heavy new supply typically softens prices + rents 12–24 months out; constrained supply supports both.
Investment metrics
- 1% rule
- 0.88% ✗
- Cap rate
- 5.66%
- Cash-on-cash
- -2.26%
- DSCR
- 0.90
- GRM
- 9.4
CMA / ARV
- ARV (on-the-fly)
- $298,375
- Comps found
- 12
Show comp detail 12 sales within ~0.75 mi
| Address | Dist | Beds/Ba | Sqft | Sold | Price | $/sf | Match |
|---|---|---|---|---|---|---|---|
| 4068 Great Falls Loop | 0.28mi | 4/2.0 | 1,705 (0%) | 2mo | $295,000 | $173 | 85 |
| 4085 Great Falls Loop | 0.29mi | 3/2.0 (-1) | 1,711 (+0%) | 2mo | $295,000 | $172 | 79 |
| 4323 Warm Springs Way | 0.01mi | 4/2.0 | 1,856 (+9%) | 10mo | $308,000 | $166 | 77 |
| 4318 Warm Springs Way | 0.04mi | 4/2.0 | 1,490 (-13%) | 5mo | $250,000 | $168 | 73 |
| 4298 Warm Springs Way | 0.08mi | 4/2.0 | 1,488 (-13%) | 6mo | $285,000 | $192 | 70 |
| 4445 Warm Springs Way | 0.16mi | 3/2.0 (-1) | 1,572 (-8%) | 8mo | $255,000 | $162 | 67 |
| 1865 Woodland Glen Rd | 0.54mi | 4/2.0 | 1,756 (+3%) | 3mo | $305,000 | $174 | 67 |
| 1866 Reed Valley Way | 0.60mi | 4/2.0 | 1,741 (+2%) | 5mo | $307,650 | $177 | 64 |
| 4060 Great Falls Loop | 0.30mi | 3/2.0 (-1) | 1,572 (-8%) | 5mo | $275,000 | $175 | 64 |
| 4228 Great Falls Loop | 0.57mi | 4/2.0 | 1,798 (+6%) | 1mo | $335,000 | $186 | 64 |
| 3994 Great Falls Loop | 0.45mi | 4/3.0 | 1,833 (+8%) | 3mo | $335,000 | $183 | 60 |
| 4188 Great Falls Loop | 0.47mi | 3/2.0 (-1) | 1,535 (-10%) | 0mo | $287,000 | $187 | 56 |
Match score weights: distance 35% · size 25% · config 20% · recency 20%. Top-matched comps best support the ARV.
Projected returns pro-forma
-3.0% appreciation · 3.35% rent growth · sell at horizon
- IRR
- -19.6%
- Equity multiple
- 0.31×
- Total profit
- $-49,838
- Equity at exit
- $38,692
- IRR
- -11.4%
- Equity multiple
- 0.30×
- Total profit
- $-50,755
- Equity at exit
- $22,437
Cash invested: $72,660 (down + closing). Projections, not guarantees.
Landlord ↔ Tenant lean methodology
- Overall (STATE)
- 87 Strongly Landlord-Friendly
- State Florida
- 87 Strongly Landlord-Friendly · R+3
- County
- — inherits STATE
- City
- — inherits STATE
ZIP-level market 32068
- Home prices YoY
- -27.5%
- Rents YoY
- 3.4%
- Active inventory
- 610
- Price-to-rent
- 9.4×
Monthly cashflow live
- Estimated rent
- $2,296 high interval (Pro) →
- Mortgage (P&I)
- −$1,361
- Tax from tax record
- −$475 /mo · $5,695/yr
- Insurance
- −$108
- HOA
- −$7
- Vacancy / Maint / Mgmt
- −$482
- Net cashflow
- $-137
Break-even live
Sensitivity live
| Price | -10% $10 | -5% $-64 | +0% $-137 | +5% $-211 | +10% $-284 |
|---|---|---|---|---|---|
| Rent | -10% $-318 | -5% $-228 | +0% $-137 | +5% $-46 | +10% $44 |
| Rate | -1.0pp $-6 | -0.5pp $-71 | base $-137 | +0.5pp $-204 | +1.0pp $-273 |
UW: 25.0% down · 7.5% · 30yr · 1.5% tax · 5.0% vac · 8.0% maint · 8.0% mgmt
Financing live
Cash to close
- Down payment
- $64,875
- Closing costs
- $7,785
- Reserves months
- —
- Total cash needed
- —
Loan-product check · same deal, 3 products live
Conventional
25% down · 7.5% · 30yr
- Down + closing
- —
- Monthly P&I
- —
- Monthly cashflow
- —
- DSCR
- —
- Eligible?
- —
Personal DTI + credit; lowest rate.
DSCR
20% down · 8.5% · 30yr
- Down + closing
- —
- Monthly P&I
- —
- Monthly cashflow
- —
- DSCR
- —
- Eligible?
- —
No personal income docs; deal must DSCR.
Hard money
10% down · 12.0% · 12mo
- Down + closing
- —
- Monthly P&I
- —
- Monthly cashflow
- —
- DSCR
- —
- Eligible?
- —
Short-term bridge; refi at stabilization.
Rent comps 5 comps
| Address | Beds | Baths | Sqft | Rent | $/sqft | DOM | Units | Dist |
|---|---|---|---|---|---|---|---|---|
| 1944 Rock Springs Way Middleburg, FL | 4.0 | 2.0 | 1856 | $2,020 | $1.09 | 6d | 1 | 0.37mi |
| 1892 High Prairie Ln Middleburg, FL | 4.0 | 2.5 | 2013 | $2,200 | $1.09 | 6d | 1 | 0.44mi |
| 2234 Windward Cay Ln Middleburg, FL | 3.0 | 2.5 | 1782 | $1,730 | $0.97 | 25d | 1 | 0.88mi |
| 2113 Windward Cay Ln Middleburg, FL | 3.0 | 2.5 | 1707 | $1,750 | $1.03 | 9d | 1 | 0.99mi |
| 931 Voyager Trl Middleburg, FL | 2.0–3.0 | 2.5 | 1618 | $2,147 | $1.33 | 3d | 6 | 1.30mi |
HOA detail
- Monthly dues
- $7 · $84/yr
Listing history 14 events
-
2026-03-27status Pending
-
2026-03-24historical Active Under Contract
-
2026-03-20price $259,500
-
2026-02-13$272,000 Active
-
2024-02-24historical 371-char remark
Show marketing remark (371 chars)
Welcome home to this 2020 split floor plan 4 bedroom, 2 bath home in a heavily sought after neighborhood! Why wait for new contractions with you can have Like-New Construction without the wait. Boasting an open floorpan, eat in kitchen area, indoor laundry room and plenty of space for family and friends - this home won't disappoint. Schedule your showing today!
-
2024-01-23price $299,900 371-char remark
Show marketing remark (371 chars)
Welcome home to this 2020 split floor plan 4 bedroom, 2 bath home in a heavily sought after neighborhood! Why wait for new contractions with you can have Like-New Construction without the wait. Boasting an open floorpan, eat in kitchen area, indoor laundry room and plenty of space for family and friends - this home won't disappoint. Schedule your showing today!
-
2024-01-13$310,000 Active 371-char remark
Show marketing remark (371 chars)
Welcome home to this 2020 split floor plan 4 bedroom, 2 bath home in a heavily sought after neighborhood! Why wait for new contractions with you can have Like-New Construction without the wait. Boasting an open floorpan, eat in kitchen area, indoor laundry room and plenty of space for family and friends - this home won't disappoint. Schedule your showing today!
-
2023-03-20historical 268-char remark
Show marketing remark (268 chars)
Welcome home to this 2020 split floor plan home. Looking for a newer home but don't want to wait on the build time ? You are in luck ! Home is in heavily sought after neighborhood.Seller is motivated, offering $10,000 toward buyers closing cost with full price offer.
-
2023-03-10price $310,000 268-char remark
Show marketing remark (268 chars)
Welcome home to this 2020 split floor plan home. Looking for a newer home but don't want to wait on the build time ? You are in luck ! Home is in heavily sought after neighborhood.Seller is motivated, offering $10,000 toward buyers closing cost with full price offer.
-
2023-02-13$319,000 Active 268-char remark
Show marketing remark (268 chars)
Welcome home to this 2020 split floor plan home. Looking for a newer home but don't want to wait on the build time ? You are in luck ! Home is in heavily sought after neighborhood.Seller is motivated, offering $10,000 toward buyers closing cost with full price offer.
-
2020-06-10soldstatus $225,990 Sold
-
2020-04-29status Pending
-
2020-04-09price $230,990
-
2020-03-18$229,990 Active
ⓘ Source: listings_history table (triggers on properties + properties_extension) + one-shot
backfill from property_details.listing_events for pre-trigger history.
Tax reassessment forecast FL · Resets to sale price
- Current annual tax
- $5,695 · $475/mo
- Projected year-2 tax
- $5,695 · $475/mo
- Expected delta
- $0/yr ($0/mo · 0.0%)
ⓘ Screening estimate from a state-policy table — verify with the county assessor before closing.
Climate risk First Street
- Flood 1/10 Low FEMA zone X (unshaded) · 0% chance over 30 yrs
- Wildfire 8/10 Severe
- Heat 8/10 Severe 7 d/yr ≥108°F today · 19 d/yr by 30 yrs out
- Wind 9/10 Extreme 99% chance of damaging wind over 30 yrs
- Air quality 3/10 Moderate 3 unhealthy d/yr today · 3 by 30 yrs out
Nearby sold comps map
Loading sold comps map…
Walkable amenities ~0.75 mi
Loading nearby amenities…
Taxation est. · year 1
- Rental income
- $27,547
- − Mortgage interest
- −$14,536
- − Property taxes
- −$5,695
- − Insurance
- −$1,298
- − Repairs & maintenance
- −$2,204
- − Management
- −$2,204
- − HOA
- −$84
- − Depreciation
- −$7,549
- Taxable loss
- −$6,023
- Est. tax savings @ 24.0%
- +$1,445
- After-tax cash flow
- $-200/yr
For passive investors: Depreciation is non-cash, so a rental often shows a tax loss while cash-flowing — sheltering income. Rental losses are passive: they offset passive income freely, and up to $25,000/yr can offset ordinary (W-2) income if you actively participate and your MAGI is under $100k (phasing out to $0 by $150k); unused losses carry forward. On sale, claimed depreciation is recaptured at up to 25%, and gains may owe capital-gains tax (a 1031 exchange can defer both). Figures are a year-1 estimate at your 24.0% rate — not tax advice; consult a CPA.
Schools (NCES district)
- District
- Clay
- NCES district ID
- 1200300
- Math proficiency
- 58% ▼ -8.00%
- Reading proficiency
- 59% ▼ -3.00%
- Median HH income
- $59,379
- Composite
- 50.73/100
- National rank
- #1815
- State rank
- #14 of 73 in FL
Livability — Middleburg
- Score
- 65/100
- State rank
- #657
- US rank
- #13174
Category grades
Schools grade is shown separately in the Schools card above.
Census & demographics
- County
- Clay County · 208,450 people
- City population
- 58,983
- Metro
- Jacksonville, FL
- Population (ZIP)
- 58,983
- Household income
- $84,431
- Rent vs Own
- Severe rent burden
- 975.0
Population outlook (Clay County) Hauer SSP2
- Today (2025)
- 230,495 people
- By 2030
- 242,427 · +5.2%
- By 2040
- 262,244 · +13.8%
- By 2050
- 275,148 · +19.4%
- By 2075
- 295,397 · +28.2%
- By 2100
- 287,592 · +24.8%
Race, ethnicity, and origin ACS 2023
- Neighborhood character
- Predominantly White (74%)
- Race & ethnicity
- White 74% Hispanic / Latino 13% Two or more races 10% Black 7%
- Hispanic origin (detail)
- Mexican 2% Puerto Rican 5%
- Common ancestry
- Slovak 2% Romanian 2% Lithuanian 2%
- Foreign-born
- 7% · Canada, Jamaica
- Languages at home
- 87% English-only · Spanish 9% Arabic 1% German/W. Germanic 1%
Political lean MEDSL · Clay
- 2024 margin
- Solid R (+39.3) · D 29.9% · R 69.2%
- 2008→2024 swing
- +3.6pp toward D · 2008: -42.8pp · 2024: -39.3pp
- All cycles
- 2024: R+39.3 2020: R+37.1 2016: R+44.3 2012: R+45.8 2008: R+42.8
Not yet ingested
- Civics
- —
Market trends
- HPI YoY
- ▼ -115.99%
- Current HPI
- 305.2531
- Rent YoY
- ▲ 3.35%
- Metro
- Jacksonville, FL
- State GDP YoY
- ▲ 3.28%
- F500 in state
- 36
Industry mix (Fortune 500 HQ in FL)
| Industry | F500 HQs | Revenue |
|---|---|---|
| Industrial Technology | 2 | $29B |
|
||
| Insurance | 2 | $17B |
|
||
| Retail | 1 | $60B |
|
||
| Technology Distribution | 1 | $58B |
|
||
| Homebuilding | 1 | $35B |
|
||
| Technology Manufacturing | 1 | $35B |
|
||
Price history
+12.8% since first listed14 events — show timeline
- 2026-03-27 Pending — realMLS
- 2026-03-24 Contingent — realMLS
- 2026-03-20 Price Changed $259,500 realMLS
- 2026-02-13 Listed $272,000 realMLS
- 2024-02-24 Listing Removed — realMLS
- 2024-01-23 Price Changed $299,900 realMLS
- 2024-01-13 Listed $310,000 realMLS
- 2023-03-20 Listing Removed — realMLS
- 2023-03-10 Price Changed $310,000 realMLS
- 2023-02-13 Listed $319,000 realMLS
- 2020-06-10 Sold (MLS) $225,990 realMLS
- 2020-04-29 Pending — realMLS
- 2020-04-09 Price Changed $230,990 realMLS
- 2020-03-18 Listed $229,990 realMLS
Property tax history
+37.9%/yrLatest (2025): $5,695 · +2.9% YoY. Source: county tax records.
Cash-flow waterfall
monthlySold comps — $/sqft
last 12 mo · ≤1 miLoading sold comps…