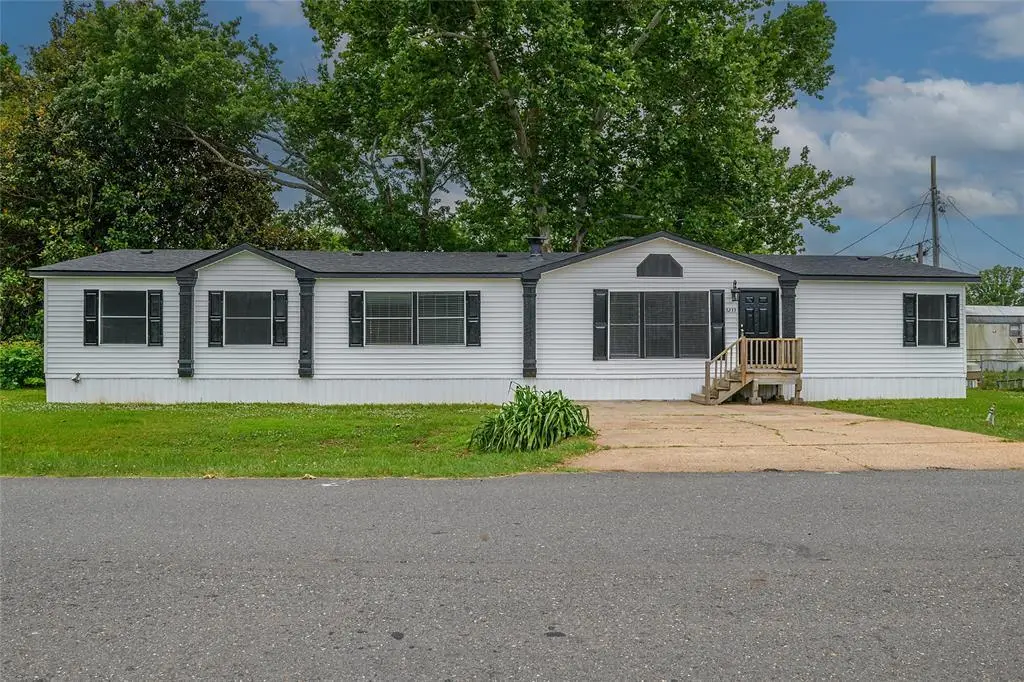
5233 Timothy Trl · Bossier City, LA
Flood risk 1/10 · Minimal
- FEMA flood zone
- X (unshaded)
- Chance of flooding over 30 yrs
- 0.0%
- Est. flood insurance / yr
- $507 – $1,088
Fire risk 3/10 · Minor
- Est. fire insurance / yr
- $1,269 – $2,357
Heat risk 7/10 · Major
- Hot days now (above 110°F)
- 7 days/yr
- Hot days in 30 yrs
- 22 days/yr
Wind risk 6/10 · Moderate
- Chance of severe wind over 30 yrs
- 68.0%
Air-quality risk 2/10 · Minimal
- Unhealthy air days now
- 1 days/yr
- Unhealthy air days in 30 yrs
- 1 days/yr
Risk factors via First Street. Map © Google.
Why this score? — see what drove the B+ grade
The composite is a weighted blend of 9 inputs, each scored 0–100. Each bar is that input's sub-score; the figure is the points it added to the 100-point composite (weight × sub-score).
- Cash flow +30.0/30.0
- ARV discount +11.4/15.0
- 1% rule +10.0/10.0
- DSCR +10.0/10.0
- Rent growth +4.1/5.0
- Schools +3.8/10.0
- Livability +3.6/5.0
- Condition / age +2.5/5.0
- Appreciation +0.0/10.0
$144,900
🖨 Deal sheet 📄 Offer letter ✓ Due diligence
Listing remarks
Check out this steal of a deal!!!!! Beautifully renovated and move-in ready, this lovely home offers the perfect blend of style and space for a large family. This home is located in a Blue Ribbon school district and Kingston elementary. Featuring 4 bedrooms and 2 living areas and a separate office ideal for working from homes, this home was designed for comfort and entertaining. Recent updates include a new roof, new siding, fresh interior paint, new carpet and luxury plank flooring, and gorgeous quartz countertops in the kitchen. Step outside to enjoy the large back deck with mature trees- perfect setting for the family cookouts or morning coffee. This property is turn-key ready and wait
Key facts
- New siding
- New carpet
- Fresh interior paint
Tags
Property features AI
Finance
- HOA & community: No association (None)
Exterior
- Parking: Driveway (no garage or covered/carport spaces listed)
- Utilities: City water; City sewer; Electricity connected; Asphalt access
- Home design: Manufactured home; Residential property; Single-story
- Construction: Built in 1995; Siding exterior; Asphalt roof; Pillar/post/pier foundation
- Exterior features: Deck; Corner lot
Interior
- Kitchen: Dishwasher; Refrigerator; Kitchen island; Pantry; Granite counters
- Bedrooms: 4 bedrooms (all on the main level)
- Flooring: Luxury vinyl plank; Vinyl
- Bathrooms: 3 full bathrooms
- Heating & cooling: Central heating; Central air conditioning
- Interior features: Decorative lighting; Granite counters; Kitchen island; Pantry; Walk-in closet(s); Two living areas; One dining area; Total of 8 rooms; Double-sided fireplace
- Laundry & utility: Full-size washer/dryer area; Electric dryer hookup; Utility room
Neighborhood map
What this means for you Summary
Snapshot
- This is a 4-bed/3.0-bath manufactured listed at $145k.
Deal economics
- At list price, monthly cash flow is $1k ($12k/yr) — positive.
- The deal already cash-flows at list — no discount required.
- Meets the 1% rule at list price ($2k rent vs $145k).
- Recommended offer: $143k (1.5% below list) — sets the bar for market timing.
- Cap rate 14.6% vs local median 4.7% in Bossier City — top-decile yield for the area; either an underpriced asset or a hidden risk that comps aren't pricing in. Stress-test before assuming the spread holds.
Location & tenants
- Location reads 71/100 on livability (#47 in LA) — a middle-class / working-renter tenant base. Strengths: commute A+, cost of living A+, housing A+; Watch: employment D+, crime F, amenities F.
- Bossier Parish (urban): math 40% / reading 47% proficiency, ranked #17 of 98 in LA (top 17%) — families likely to look elsewhere, expect single-tenant / working-renter base with shorter leases.
- Zoned schools: Bossier Elementary School (math 8% / reading 17%, grade F, #550 of 646 statewide, top 88%, 222 students, 93% FRL) — zoned schools average 93% FRL vs 41% district-wide (52 pts higher); higher-poverty schools than district average — tighter screening recommended.
- Zoned-school proficiency averages 12% at this address vs 44% district-wide (-31 pts) — the specific schools serving this property underperform the Bossier Parish average; the district grade overstates school quality for this exact location.
- Market conditions: Rents rising fast (+6.6%/yr); 421 active listings in the ZIP; 4 comparable units currently listed for rent nearby; rentals at typical pace (median 21d on market — plan ~3-4 weeks tenant-placement turnaround); 716 units permitted in Bossier Parish in 2024 (0 in 5+ unit buildings).
Forward outlook
- Local home prices are declining (-3.0%/yr); year-one equity from $1k of loan paydown is wiped out by about $4k of value loss. Plan a longer hold.
- Bossier County population projected at +28% by 2050 — long-run rental-demand tailwind backs the buy-and-hold thesis.
- At projected returns (-3.0% appreciation + 6.6% rent growth), your $41k cash investment doubles in ~4 years — after that, you're playing with house money.
Negotiation context
- It's been on market 27 days — a 2% lower offer ($143k) is reasonable based on typical stale-listing flexibility.
- 4 sale attempts; this cycle's ask has dropped $20k (12%) from the opening price — seller is motivated, your offer sets the floor, not the list.
- Current owner paid $43k; list at $145k implies a 235% gain — meaningful room to come down on a strong offer.
Risks & watch-outs
- Climate carrying-cost: major wind risk, 68% chance of damaging wind over 30y; extreme-heat days projected 7→22/yr by 2055 (HVAC capex compounding) — expect insurance premiums to compound above CPI over the hold.
Questions for the listing agent
- Is there a deadline driving the sale (1031 exchange, divorce, estate, relocation)? That informs how much negotiation room exists.
- Schools are B-rated — typically a magnet for longer-tenancy family renters. What's the average tenant stay here, and is there a school-zone premium baked into asking?
- Crime grade is F in this area — have there been break-ins, vandalism, or insurance claims at this property in the last 3 years? What carrier currently insures it and at what premium?
- What's the average days-on-market for RENTAL listings here right now (not sales)? A rising rental-DOM trend means longer vacancies and softer asking-rent achievability than the comps imply.
- What's the recent tenant-quality profile in this submarket — average credit score on applications, eviction rate, late-payment / NSF rate, and stable-employment percentage? A property-management company in the area should have these aggregated.
- How much new for-sale + rental construction is in the pipeline within 1–3 miles? Heavy new supply typically softens prices + rents 12–24 months out; constrained supply supports both.
Investment metrics
- 1% rule
- 1.62% ✓
- Cap rate
- 14.65%
- Cash-on-cash
- 29.83%
- DSCR
- 2.33
- GRM
- 5.1
CMA / ARV
- ARV (on-the-fly)
- $158,688
- Comps found
- 1
Show comp detail 1 sale within ~0.75 mi
| Address | Dist | Beds/Ba | Sqft | Sold | Price | $/sf | Match |
|---|---|---|---|---|---|---|---|
| 5253 Alfalfa Dr | 0.20mi | 3/2.0 (-1) | 1,848 (+1%) | 21mo | $159,900 | $87 | 62 |
Match score weights: distance 35% · size 25% · config 20% · recency 20%. Top-matched comps best support the ARV.
Projected returns pro-forma
-3.0% appreciation · 6.56% rent growth · sell at horizon
- IRR
- 28.0%
- Equity multiple
- 2.22×
- Total profit
- $49,416
- Equity at exit
- $21,605
- IRR
- 37.4%
- Equity multiple
- 5.04×
- Total profit
- $163,989
- Equity at exit
- $12,528
Cash invested: $40,572 (down + closing). Projections, not guarantees.
Landlord ↔ Tenant lean methodology
- Overall (STATE)
- 90 Strongly Landlord-Friendly
- State Louisiana
- 90 Strongly Landlord-Friendly · R+12
- County
- — inherits STATE
- City
- — inherits STATE
ZIP-level market 71111
- Home prices YoY
- -34.8%
- Rents YoY
- 6.6%
- Active inventory
- 421
- Price-to-rent
- 5.1×
Monthly cashflow live
- Estimated rent
- $2,349 medium interval (Pro) →
- Mortgage (P&I)
- −$760
- Tax from tax record
- −$27 /mo · $322/yr
- Insurance
- −$60
- HOA
- −$0
- Vacancy / Maint / Mgmt
- −$493
- Net cashflow
- $1,009
Break-even live
UW: 25.0% down · 7.5% · 30yr · 1.5% tax · 5.0% vac · 8.0% maint · 8.0% mgmt
Financing live
Cash to close
- Down payment
- $36,225
- Closing costs
- $4,347
- Reserves months
- —
- Total cash needed
- —
Loan-product check · same deal, 3 products live
Conventional
25% down · 7.5% · 30yr
- Down + closing
- —
- Monthly P&I
- —
- Monthly cashflow
- —
- DSCR
- —
- Eligible?
- —
Personal DTI + credit; lowest rate.
DSCR
20% down · 8.5% · 30yr
- Down + closing
- —
- Monthly P&I
- —
- Monthly cashflow
- —
- DSCR
- —
- Eligible?
- —
No personal income docs; deal must DSCR.
Hard money
10% down · 12.0% · 12mo
- Down + closing
- —
- Monthly P&I
- —
- Monthly cashflow
- —
- DSCR
- —
- Eligible?
- —
Short-term bridge; refi at stabilization.
Rent comps 4 comps
| Address | Beds | Baths | Sqft | Rent | $/sqft | DOM | Units | Dist |
|---|---|---|---|---|---|---|---|---|
| 303 Plum Orchard Ln Benton, LA | 4.0 | 3.0 | 2073 | $2,600 | $1.25 | 20d | 1 | 0.71mi |
| 606 Acacia Dr Bossier City, LA | 3.0 | 2.0 | 1765 | $2,200 | $1.25 | 20d | 1 | 0.82mi |
| 217 Norwell Ln Bossier City, LA | 4.0 | 2.5 | 1851 | $2,400 | $1.30 | 20d | 1 | 1.05mi |
| 90 Kingston Xing Bossier City, LA | 1.0–3.0 | 1.0–2.0 | 1150 | $2,015 | $1.75 | 13d | 14 | 1.08mi |
Listing history 34 events
-
2026-06-18days on market $144,900 Active 27 DOM
-
2026-06-17days on market $144,900 Active 26 DOM
-
2026-06-16pricedays on market $144,900 Active 25 DOM
-
2026-06-15days on market $149,900 Active 24 DOM
-
2026-06-14days on market $149,900 Active 22 DOM
-
2026-06-13days on market $149,900 Active 21 DOM
-
2026-06-10pricedays on market $149,900 Active 19 DOM
-
2026-06-09days on market $150,900 Active 18 DOM
-
2026-06-08days on market $150,900 Active 17 DOM
-
2026-06-07days on market $150,900 Active 16 DOM
-
2026-06-02days on market $150,900 Active 11 DOM
-
2026-06-01days on market $150,900 Active 10 DOM
-
2026-06-01remarks 699-char remark
-
2026-06-01price $150,900 Active 9 DOM
-
2026-05-31days on market $164,900 Active 9 DOM
-
2026-05-30days on market $164,900 Active 8 DOM
-
2026-05-21$164,900 Active
-
2025-12-24historical
-
2025-12-16status Active
-
2025-11-26status Pending
-
2025-11-26price $135,000
-
2025-10-11price $130,900
-
2025-10-10status Active
-
2025-10-07status Pending
-
2025-10-07price $150,000
-
2025-09-25price $130,900
-
2025-09-17price $134,900
-
2025-09-06price $139,000
-
2025-08-02price $139,900
-
2025-07-27price $149,900
-
2025-07-17price $157,000
-
2025-07-14price $165,000
-
2025-06-24$175,000 Active
-
2003-05-01soldstatus $43,200
ⓘ Source: listings_history table (triggers on properties + properties_extension) + one-shot
backfill from property_details.listing_events for pre-trigger history.
Tax reassessment forecast LA · Resets to sale price
- Current annual tax
- $322 · $27/mo
- Projected year-2 tax
- $797 · $66/mo
- Expected delta
- +$475/yr (+$40/mo · 147.3%)
ⓘ Screening estimate from a state-policy table — verify with the county assessor before closing.
Climate risk First Street
- Flood 1/10 Low FEMA zone X (unshaded) · 0% chance over 30 yrs
- Wildfire 3/10 Moderate
- Heat 7/10 Severe 7 d/yr ≥110°F today · 22 d/yr by 30 yrs out
- Wind 6/10 Major 68% chance of damaging wind over 30 yrs
- Air quality 2/10 Low 1 unhealthy d/yr today · 1 by 30 yrs out
Nearby sold comps map
Loading sold comps map…
Walkable amenities ~0.75 mi
Loading nearby amenities…
Taxation est. · year 1
- Rental income
- $28,188
- − Mortgage interest
- −$8,117
- − Property taxes
- −$322
- − Insurance
- −$724
- − Repairs & maintenance
- −$2,255
- − Management
- −$2,255
- − Depreciation
- −$4,215
- Taxable income
- $10,300
- Est. tax owed @ 24.0%
- −$2,472
- After-tax cash flow
- $9,632/yr
For passive investors: Depreciation is non-cash, so a rental often shows a tax loss while cash-flowing — sheltering income. Rental losses are passive: they offset passive income freely, and up to $25,000/yr can offset ordinary (W-2) income if you actively participate and your MAGI is under $100k (phasing out to $0 by $150k); unused losses carry forward. On sale, claimed depreciation is recaptured at up to 25%, and gains may owe capital-gains tax (a 1031 exchange can defer both). Figures are a year-1 estimate at your 24.0% rate — not tax advice; consult a CPA.
Schools (NCES district)
- District
- Bossier Parish
- NCES district ID
- 2200270
- Math proficiency
- 40% ▼ -32.00%
- Reading proficiency
- 47% ▼ -28.00%
- Median HH income
- $51,326
- Composite
- 37.5/100
- National rank
- #4402
- State rank
- #17 of 98 in LA
Livability — Bossier City
- Score
- 71/100
- State rank
- #47
- US rank
- #7044
Category grades
Schools grade is shown separately in the Schools card above.
Census & demographics
- County
- Bossier Parish · 98,704 people
- City population
- 91,925
- Metro
- Shreveport-Bossier City, LA
- Population (ZIP)
- 43,925
- Household income
- $65,292
- Rent vs Own
- Severe rent burden
- 1942.0
Population outlook (Bossier County) Hauer SSP2
- Today (2025)
- 143,247 people
- By 2030
- 151,802 · +6.0%
- By 2040
- 168,194 · +17.4%
- By 2050
- 183,533 · +28.1%
- By 2075
- 217,009 · +51.5%
- By 2100
- 230,091 · +60.6%
Race, ethnicity, and origin ACS 2023
- Neighborhood character
- Diverse neighborhood (Simpson 0.60)
- Race & ethnicity
- White 56% Black 29% Hispanic / Latino 9% Two or more races 8% Asian 3%
- Hispanic origin (detail)
- Mexican 5%
- Common ancestry
- Lithuanian 2% Iranian 1% Slovak 1%
- Foreign-born
- 5% · Canada, Vietnam
- Languages at home
- 90% English-only · Spanish 7% Vietnamese 1% French/Haitian/Cajun 1%
Political lean MEDSL · Bossier
- 2024 margin
- Solid R (+43.3) · D 27.7% · R 71.0% · Other 1.3%
- 2008→2024 swing
- +0.3pp no change · 2008: -43.7pp · 2024: -43.3pp
- All cycles
- 2024: R+43.3 2020: R+41.0 2016: R+45.8 2012: R+45.4 2008: R+43.7
Not yet ingested
- Civics
- —
Market trends
- HPI YoY
- ▼ -79.78%
- Current HPI
- 149.4336
- Rent YoY
- ▲ 6.56%
- Metro
- Shreveport-Bossier City, LA
- State GDP YoY
- ▲ 3.29%
- F500 in state
- 10
Industry mix (Fortune 500 HQ in LA)
| Industry | F500 HQs | Revenue |
|---|---|---|
| Telecommunications | 2 | $23B |
|
||
| Utilities | 1 | $12B |
|
||
| Wholesale / Distribution | 1 | $5B |
|
||
| Advertising | 1 | $2B |
|
||
Price history
+281.7% since first listed18 events — show timeline
- 2026-05-21 Listed $164,900 NTREIS
- 2025-12-24 Listing Removed — NTREIS
- 2025-12-16 Relisted — NTREIS
- 2025-11-26 Pending — NTREIS
- 2025-11-26 Price Changed $135,000 NTREIS
- 2025-10-11 Price Changed $130,900 NTREIS
- 2025-10-10 Relisted — NTREIS
- 2025-10-07 Pending — NTREIS
- 2025-10-07 Price Changed $150,000 NTREIS
- 2025-09-25 Price Changed $130,900 NTREIS
- 2025-09-17 Price Changed $134,900 NTREIS
- 2025-09-06 Price Changed $139,000 NTREIS
- 2025-08-02 Price Changed $139,900 NTREIS
- 2025-07-27 Price Changed $149,900 NTREIS
- 2025-07-17 Price Changed $157,000 NTREIS
- 2025-07-14 Price Changed $165,000 NTREIS
- 2025-06-24 Listed $175,000 NTREIS
- 2003-05-01 Sold (Public Records) $43,200 Public Records
Property tax history
-3.3%/yrLatest (2025): $322 · -0.9% YoY. Source: county tax records.
Cash-flow waterfall
monthlySold comps — $/sqft
last 12 mo · ≤1 miLoading sold comps…