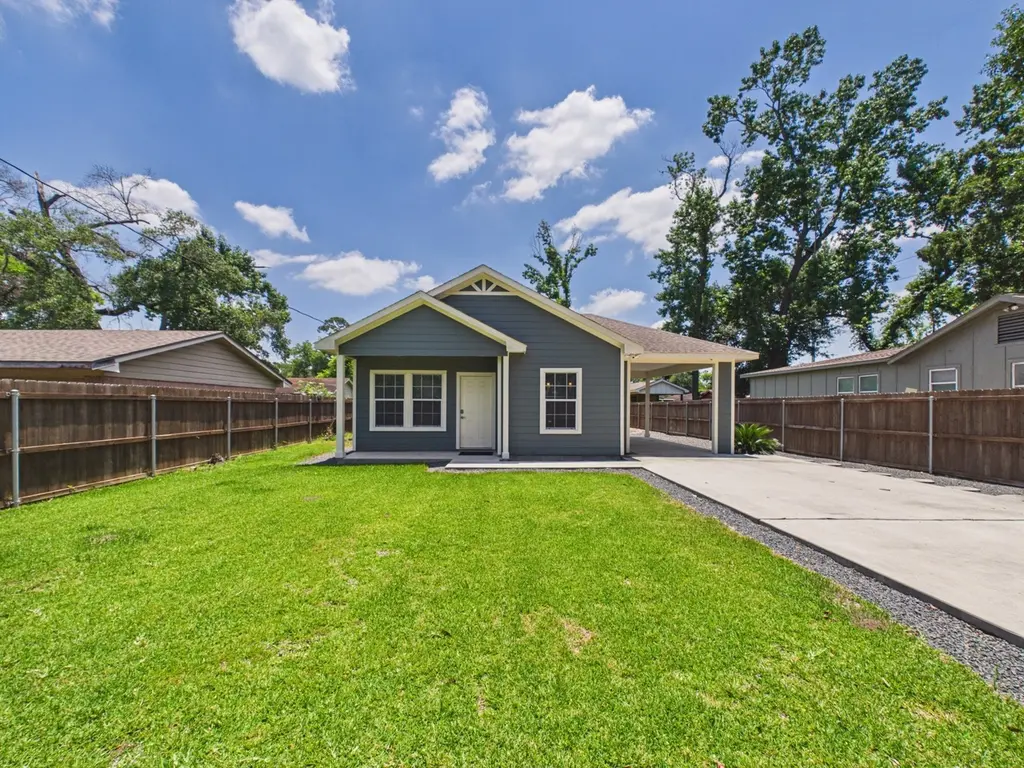
9214 Firnat St · Houston, TX
Flood risk 1/10 · Minimal
- FEMA flood zone
- X (unshaded)
- Chance of flooding over 30 yrs
- 0.0%
- Est. flood insurance / yr
- $507 – $1,088
Fire risk 1/10 · Minimal
- Est. fire insurance / yr
- $1,222 – $2,270
Heat risk 9/10 · Severe
- Hot days now (above 111°F)
- 7 days/yr
- Hot days in 30 yrs
- 24 days/yr
Wind risk 9/10 · Severe
- Chance of severe wind over 30 yrs
- 99.0%
Air-quality risk 3/10 · Minor
- Unhealthy air days now
- 2 days/yr
- Unhealthy air days in 30 yrs
- 3 days/yr
Risk factors via First Street. Map © Google.
Why this score? — see what drove the F grade
The composite is a weighted blend of 9 inputs, each scored 0–100. Each bar is that input's sub-score; the figure is the points it added to the 100-point composite (weight × sub-score).
- Appreciation +9.3/10.0
- Cash flow +7.0/30.0
- Livability +3.7/5.0
- Schools +2.7/10.0
- Rent growth +2.6/5.0
- Condition / age +2.5/5.0
- 1% rule +2.4/10.0
- DSCR +1.2/10.0
- ARV discount +0.0/15.0
$225,000
🖨 Deal sheet (PDF) 📄 Offer letter ✓ Due diligence
Listing remarks MLS
* * New Built in a rapid growing and rehab area * * shown pictures are from a previous home this builder built closed by and the floor plan will be the same as per builder and floor plans * * this home comes with a very nice touch of elegance and pride of ownership * * DISCLOSURE * * this home is being built by humans therefore the finish product may not look the same * * colors, features and elevation may change * * For complete details please call your realtor of Call Us TODAY!
Key facts
- High efficiency hvac
- Low-e windows
- Great insulation
Tags
Property features AI
Exterior
- Parking: Attached carport; Additional parking; Carport (1 space); Electric gate
- Utilities: Public water; Public sewer
- Home design: Residential property; One-story entry (all main rooms listed on first floor)
- Construction: Built in 2020; Cement siding; Composition roof; Slab foundation
- Exterior features: Fully fenced yard with backyard fencing; Private yard; Front porch
Interior
- Kitchen: Dishwasher; Garbage disposal; Microwave
- Bedrooms: Primary bedroom on first floor (approx. 12 x 13); Bedroom on first floor (approx. 11 x 11); Bedroom on first floor (approx. 11 x 11)
- Bathrooms: 2 full bathrooms; Primary bathroom on first floor (approx. 5 x 11); Bathroom on first floor (approx. 5 x 8)
- Heating & cooling: Central heating (gas); Central air conditioning (electric)
- Interior features: Breakfast bar; Granite counters; Kitchen/family room combo; Pantry; Tub with shower; Ceiling fans; Low-E windows
- Laundry & utility: Washer hookup; Electric dryer hookup; Gas dryer hookup; Utility room on first floor (approx. 7 x 3)
Neighborhood map
What this means for you Summary
Snapshot
- This is a 3-bed/2.0-bath single-family listed at $225k.
Deal economics
- At list price, monthly cash flow is $-334 ($-4k/yr) — negative.
- To cash-flow at today's rent, offer at most $166k (26.2% below list).
- To meet the 1% rule (rent ≥ 1% of price), the offer needs to be $166k (26.4% below list).
- Recommended offer: $166k (26.4% below list) — sets the bar for 1% rule.
- Cap rate 4.5% vs local median 3.2% in Houston — top-decile yield for the area; either an underpriced asset or a hidden risk that comps aren't pricing in. Stress-test before assuming the spread holds.
Location & tenants
- Location reads 74/100 on livability (#184 in TX, #4,771 nationally) — a middle-class / working-renter tenant base. Strengths: amenities A+, cost of living A+, housing A+; Watch: crime F.
- Houston ISD (urban): math 27% / reading 35% proficiency, ranked #593 of 826 in TX (top 72%) — families likely to look elsewhere, expect single-tenant / working-renter base with shorter leases; 71% free/reduced lunch — lower-income household profile, screen leases tightly.
- Zoned schools: Shadydale El (math 11% / reading 20%, grade F, #3,990 of 4,322 statewide, top 93%, 631 students, 95% FRL); Forest Brook Middle (math 12% / reading 14%, grade F, #1,609 of 1,662 statewide, top 97%, 613 students, 98% FRL); North Forest H S (math 13% / reading 18%, grade F, #1,505 of 1,632 statewide, top 92%, 974 students, 97% FRL) — zoned schools average 97% FRL vs 71% district-wide (26 pts higher); higher-poverty schools than district average — tighter screening recommended.
- Zoned-school proficiency averages 15% at this address vs 31% district-wide (-16 pts) — the specific schools serving this property underperform the Houston ISD average; the district grade overstates school quality for this exact location.
- Market conditions: Rents flat; 376 active listings in the ZIP; 30 comparable units currently listed for rent nearby; rentals at typical pace (median 26d on market — plan ~3-4 weeks tenant-placement turnaround); 47% of comp listings sitting > 30 days — soft ceiling on asking rent; 29,883 units permitted in Harris County in 2024 (8,621 in 5+ unit buildings).
- This rent runs 42% of the median local income ($48k/yr) — at the standard rent-burdened threshold; future hikes will face affordability resistance.
Forward outlook
- In year one you build about $21k of equity ($2k loan paydown + $19k appreciation (8.7% local appreciation)).
- Harris County population projected at +47% by 2050 — long-run rental-demand tailwind backs the buy-and-hold thesis.
- By year 2, paydown + projected appreciation supports a ~$34k cash-out refi (75% LTV) — recoverable capital for the next deal without selling this one.
Negotiation context
- It's been on market 19 days — a 2% lower offer ($222k) is reasonable based on typical stale-listing flexibility.
- 7 sale attempts since 15y ago with the ask held roughly flat each time — persistent listings suggest the price (not the market) is what's stuck; bring a comps-based counter.
Risks & watch-outs
- Climate carrying-cost: severe wind risk, 99% chance of damaging wind over 30y; extreme-heat days projected 7→24/yr by 2055 (HVAC capex compounding) — expect insurance premiums to compound above CPI over the hold.
Questions for the listing agent
- What do current leases actually rent for vs. the listed asking? Can we see a recent rent roll and the last 12 months of T-12 income?
- Is there a deadline driving the sale (1031 exchange, divorce, estate, relocation)? That informs how much negotiation room exists.
- Schools are D-rated, which usually means shorter tenancies and higher turnover. Who's the typical renter profile here, and what's been the actual vacancy rate?
- Crime grade is F in this area — have there been break-ins, vandalism, or insurance claims at this property in the last 3 years? What carrier currently insures it and at what premium?
- The area grade is low — what's the realistic commute time and amenity access for the typical tenant pool here? Any planned neighborhood developments (good or bad) we should know about?
- What's the average days-on-market for RENTAL listings here right now (not sales)? A rising rental-DOM trend means longer vacancies and softer asking-rent achievability than the comps imply.
- What's the recent tenant-quality profile in this submarket — average credit score on applications, eviction rate, late-payment / NSF rate, and stable-employment percentage? A property-management company in the area should have these aggregated.
- How much new for-sale + rental construction is in the pipeline within 1–3 miles? Heavy new supply typically softens prices + rents 12–24 months out; constrained supply supports both.
Investment metrics
- 1% rule
- 0.74% ✗
- Cap rate
- 4.51%
- Cash-on-cash
- -6.36%
- DSCR
- 0.72
- GRM
- 11.3
CMA / ARV
- ARV (on-the-fly)
- $177,060
- Comps found
- 12
Show comp detail 12 sales within ~0.75 mi
| Address | Dist | Beds/Ba | Sqft | Sold | Price | $/sf | Match |
|---|---|---|---|---|---|---|---|
| 7410 Glen Manor Dr | 0.37mi | 3/2.0 | 1,140 (+0%) | 6mo | $225,000 | $197 | 77 |
| 7314 Bigwood St | 0.65mi | 3/1.0 | 1,122 (-1%) | 2mo | $90,000 | $80 | 62 |
| 7421 Claiborne St | 0.61mi | 3/1.0 | 1,070 (-6%) | 0mo | $129,900 | $121 | 58 |
| 7429 Springdale St | 0.49mi | 3/2.0 | 1,230 (+8%) | 9mo | $190,000 | $154 | 56 |
| 9818 Degas Ln | 0.65mi | 4/1.5 (+1) | 1,160 (+2%) | 4mo | $190,000 | $164 | 55 |
| 7229 Springdale St | 0.44mi | 3/1.0 | 1,247 (+10%) | 6mo | $195,000 | $156 | 54 |
| 9009 Compton St | 0.47mi | 2/1.0 (-1) | 1,040 (-8%) | 5mo | $130,000 | $125 | 51 |
| 7534 Bywood St | 0.71mi | 3/1.0 | 1,107 (-2%) | 10mo | $179,000 | $162 | 50 |
| 7242 Bretshire Dr | 0.62mi | 4/2.0 (+1) | 1,216 (+7%) | 7mo | $210,000 | $173 | 49 |
| 7206 Bywood St | 0.59mi | 3/2.0 | 1,266 (+12%) | 7mo | $230,000 | $182 | 48 |
| 7218 Bretshire Dr | 0.62mi | 3/1.0 | 1,013 (-11%) | 3mo | $109,000 | $108 | 47 |
| 9611 Bertwood St | 0.73mi | 3/1.0 | 1,277 (+12%) | 7mo | $174,990 | $137 | 35 |
Match score weights: distance 35% · size 25% · config 20% · recency 20%. Top-matched comps best support the ARV.
Projected returns pro-forma
8.65% appreciation · 0.44% rent growth · sell at horizon
- IRR
- 16.0%
- Equity multiple
- 2.22×
- Total profit
- $76,749
- Equity at exit
- $180,962
- IRR
- 14.9%
- Equity multiple
- 4.68×
- Total profit
- $231,648
- Equity at exit
- $369,213
Cash invested: $63,000 (down + closing). Projections, not guarantees.
Landlord ↔ Tenant lean methodology
- Overall (STATE)
- 87 Strongly Landlord-Friendly
- State Texas
- 87 Strongly Landlord-Friendly · R+5
- County
- — inherits STATE
- City
- — inherits STATE
ZIP-level market 77016
- Home prices YoY
- 2.8%
- Rents YoY
- 0.4%
- Active inventory
- 376
- Price-to-rent
- 11.3×
Monthly cashflow live
- Estimated rent
- $1,656 high interval (Pro) →
- Mortgage (P&I)
- −$1,180
- Tax from tax record
- −$368 /mo · $4,420/yr
- Insurance
- −$94
- HOA
- −$0
- Vacancy / Maint / Mgmt
- −$348
- Net cashflow
- $-334
Break-even live
Sensitivity live
| Price | -10% $-207 | -5% $-270 | +0% $-334 | +5% $-398 | +10% $-461 |
|---|---|---|---|---|---|
| Rent | -10% $-465 | -5% $-400 | +0% $-334 | +5% $-269 | +10% $-203 |
| Rate | -1.0pp $-221 | -0.5pp $-277 | base $-334 | +0.5pp $-392 | +1.0pp $-452 |
UW: 25.0% down · 7.5% · 30yr · 1.5% tax · 5.0% vac · 8.0% maint · 8.0% mgmt
Financing live
Cash to close
- Down payment
- $56,250
- Closing costs
- $6,750
- Reserves months
- —
- Total cash needed
- —
Loan-product check · same deal, 3 products live
Conventional
25% down · 7.5% · 30yr
- Down + closing
- —
- Monthly P&I
- —
- Monthly cashflow
- —
- DSCR
- —
- Eligible?
- —
Personal DTI + credit; lowest rate.
DSCR
20% down · 8.5% · 30yr
- Down + closing
- —
- Monthly P&I
- —
- Monthly cashflow
- —
- DSCR
- —
- Eligible?
- —
No personal income docs; deal must DSCR.
Hard money
10% down · 12.0% · 12mo
- Down + closing
- —
- Monthly P&I
- —
- Monthly cashflow
- —
- DSCR
- —
- Eligible?
- —
Short-term bridge; refi at stabilization.
Rent comps 30 comps
| Address | Beds | Baths | Sqft | Rent | $/sqft | DOM | Units | Dist |
|---|---|---|---|---|---|---|---|---|
| 9410 Firnat St Unit A Houston, TX | 3.0 | 2.5 | 1500 | $1,900 | $1.27 | 0d | 1 | 0.16mi |
| 9410 Firnat St Unit B Houston, TX | 3.0 | 2.5 | 1500 | $1,900 | $1.27 | 45d | 1 | 0.16mi |
| 7201 Hallshire Dr Unit 235 Houston, TX | 3.0 | 1.0 | 1100 | $850 | $0.77 | 45d | 1 | 0.41mi |
| 7201 Hallshire Dr Houston, TX | 2.0 | 1.0 | 985 | $740 | $0.75 | 45d | 1 | 0.41mi |
| 7201 Hallshire Dr Unit 222 Houston, TX | 2.0 | 1.0 | 985 | $700 | $0.71 | 45d | 1 | 0.41mi |
| 7119 Bywood St Unit A Houston, TX | 3.0 | 2.5 | 1150 | $1,795 | $1.56 | 45d | 1 | 0.58mi |
| 7418 Bywood St Houston, TX | 3.0 | 2.0 | 1300 | $1,800 | $1.38 | 25d | 1 | 0.63mi |
| 7601 Springdale St Houston, TX | 3.0 | 2.0 | 1224 | $1,200 | $0.98 | 16d | 1 | 0.64mi |
| 7176 Parker Rd Houston, TX | 4.0 | 2.0 | 1152 | $1,200 | $1.04 | 45d | 1 | 0.78mi |
| 8015 Elbert St Unit A Houston, TX | 2.0 | 2.0 | 1021 | $1,650 | $1.62 | 9d | 1 | 0.79mi |
| 7252 Parker Rd Houston, TX | 3.0 | 1.0 | 916 | $1,650 | $1.80 | 45d | 1 | 0.85mi |
| 9422 Sandra St Unit B Houston, TX | 3.0 | 2.5 | 1461 | $1,875 | $1.28 | 45d | 1 | 0.88mi |
| 7804 Crestview Dr Unit A Houston, TX | 3.0 | 2.0 | 1150 | $1,550 | $1.35 | 23d | 1 | 0.97mi |
| 9550 N Wayside Dr Houston, TX | 1.0–3.0 | 1.0–2.0 | 896 | $1,399 | $1.56 | 2d | 5 | 0.98mi |
| 7914 Laura Koppe Rd Houston, TX | 3.0 | 2.0 | 1400 | $1,850 | $1.32 | 45d | 1 | 1.01mi |
| 8006 Lynette St Houston, TX | 3.0 | 1.0 | 1400 | $1,475 | $1.05 | 25d | 1 | 1.02mi |
| 10221 Bretton Dr Houston, TX | 3.0 | 1.0 | 1350 | $1,700 | $1.26 | 25d | 1 | 1.03mi |
| 8639 Peachtree St Unit A Houston, TX | 3.0 | 2.5 | 1150 | $1,750 | $1.52 | 45d | 1 | 1.10mi |
| 10329 Wicklowe St Houston, TX | 3.0 | 2.0 | 1266 | $1,400 | $1.11 | 22d | 1 | 1.25mi |
| 7314 Saunders Rd Houston, TX | 4.0 | 2.0 | 1339 | $1,723 | $1.29 | 15d | 1 | 1.28mi |
| 10314 Woodwick St Unit 1283919P Houston, TX | 3.0 | 2.5 | 1496 | $3,865 | $2.58 | 0d | 1 | 1.31mi |
| 5609 Denmark St Unit A Houston, TX | 3.0 | 2.0 | 1410 | $1,595 | $1.13 | 45d | 1 | 1.41mi |
| 8213 Linda Vista Rd Houston, TX | 3.0 | 2.0 | 1298 | $1,625 | $1.25 | 25d | 1 | 1.44mi |
| 8122 Sterlingshire St Unit B Houston, TX | 3.0 | 2.0 | 1160 | $1,450 | $1.25 | 16d | 1 | 1.46mi |
| 8122 Sterlingshire St Unit A Houston, TX | 3.0 | 2.0 | 1160 | $1,525 | $1.31 | 16d | 1 | 1.46mi |
| 8126 Sterlingshire St Unit B Houston, TX | 3.0 | 2.0 | 1150 | $1,350 | $1.17 | 25d | 1 | 1.47mi |
| 8113 Denton St Houston, TX | 3.0 | 2.0 | 1150 | $1,750 | $1.52 | 45d | 1 | 1.47mi |
| 7740 Wileyvale Rd Unit B Houston, TX | 3.0 | 2.0 | 1500 | $3,000 | $2.00 | 45d | 1 | 1.48mi |
| 8216 Richland Dr Unit B Houston, TX | 3.0 | 2.0 | 1150 | $1,750 | $1.52 | 45d | 1 | 1.48mi |
| 7726 Spinet St Houston, TX | 4.0 | 2.0 | 1456 | $2,375 | $1.63 | 9d | 1 | 1.50mi |
Listing history 13 events
-
2026-06-21days on market $225,000 Pending 19 DOM
-
2026-06-18days on market $225,000 Pending 16 DOM
-
2026-06-17status $225,000 Pending 15 DOM
-
2026-06-17days on market $225,000 Active 15 DOM
-
2026-06-16days on market $225,000 Active 14 DOM
-
2026-06-15days on market $225,000 Active 13 DOM
-
2026-06-13days on market $225,000 Active 11 DOM
-
2026-06-09days on market $225,000 Active 7 DOM
-
2026-06-08days on market $225,000 Active 6 DOM
-
2026-06-07days on market $225,000 Active 5 DOM
-
2026-06-04days on market $225,000 Active 2 DOM
-
2026-06-02remarks 695-char remark
-
2026-06-02$225,000 Active 1 DOM
ⓘ Source: listings_history table (triggers on properties + properties_extension) + one-shot
backfill from property_details.listing_events for pre-trigger history.
Tax reassessment forecast TX · Resets to sale price
- Current annual tax
- $4,420 · $368/mo
- Projected year-2 tax
- $4,420 · $368/mo
- Expected delta
- $0/yr ($0/mo · 0.0%)
ⓘ Screening estimate from a state-policy table — verify with the county assessor before closing.
Climate risk First Street
- Flood 1/10 Low FEMA zone X (unshaded) · 0% chance over 30 yrs
- Wildfire 1/10 Low
- Heat 9/10 Extreme 7 d/yr ≥111°F today · 24 d/yr by 30 yrs out
- Wind 9/10 Extreme 99% chance of damaging wind over 30 yrs
- Air quality 3/10 Moderate 2 unhealthy d/yr today · 3 by 30 yrs out
Nearby sold comps map
Loading sold comps map…
Walkable amenities ~0.75 mi
Loading nearby amenities…
Taxation est. · year 1
- Rental income
- $19,867
- − Mortgage interest
- −$12,603
- − Property taxes
- −$4,420
- − Insurance
- −$1,125
- − Repairs & maintenance
- −$1,589
- − Management
- −$1,589
- − Depreciation
- −$6,545
- Taxable loss
- −$8,006
- Est. tax savings @ 24.0%
- +$1,921
- After-tax cash flow
- $-2,088/yr
For passive investors: Depreciation is non-cash, so a rental often shows a tax loss while cash-flowing — sheltering income. Rental losses are passive: they offset passive income freely, and up to $25,000/yr can offset ordinary (W-2) income if you actively participate and your MAGI is under $100k (phasing out to $0 by $150k); unused losses carry forward. On sale, claimed depreciation is recaptured at up to 25%, and gains may owe capital-gains tax (a 1031 exchange can defer both). Figures are a year-1 estimate at your 24.0% rate — not tax advice; consult a CPA.
Schools (NCES district)
- District
- Houston ISD
- NCES district ID
- 4823640
- Math proficiency
- 27% ▼ -18.00%
- Reading proficiency
- 35% ▼ -6.00%
- Median HH income
- $46,054
- Composite
- 26.63/100
- National rank
- #7173
- State rank
- #593 of 826 in TX
Livability — Houston
- Score
- 74/100
- State rank
- #184
- US rank
- #4771
Category grades
Schools grade is shown separately in the Schools card above.
Census & demographics
- Census place
- Houston, TX
- County
- Harris County · 4,702,590 people
- City population
- 3,226,434
- Metro
- Houston-The Woodlands-Sugar Land, TX
- Population (ZIP)
- 29,841
- Household income
- $47,677
- Rent vs Own
- Severe rent burden
- 1297.0
Population outlook (Harris County) Hauer SSP2
- Today (2025)
- 5,571,493 people
- By 2030
- 6,089,821 · +9.3%
- By 2040
- 7,142,806 · +28.2%
- By 2050
- 8,185,864 · +46.9%
- By 2075
- 10,574,329 · +89.8%
- By 2100
- 12,109,958 · +117.4%
Race, ethnicity, and origin ACS 2023
- Neighborhood character
- Majority Black (56%)
- Race & ethnicity
- Black 56% Hispanic / Latino 42% Two or more races 28%
- Hispanic origin (detail)
- Mexican 34%
- Foreign-born
- 18% · Canada
- Languages at home
- 61% English-only · Spanish 37%
Political lean MEDSL · Harris
- 2024 margin
- Lean D (+5.5) · D 52.0% · R 46.4% · Other 1.6%
- 2008→2024 swing
- +3.9pp toward D · 2008: 1.6pp · 2024: 5.5pp
- All cycles
- 2024: D+5.5 2020: D+13.3 2016: D+12.4 2012: D+0.1 2008: D+1.6
Not yet ingested
- Civics
- —
Market trends
- HPI YoY
- ▲ 8.65%
- Current HPI
- 315.6765
- Rent YoY
- ▲ 0.44%
- Metro
- Houston-The Woodlands-Sugar Land, TX
- State GDP YoY
- ▲ 3.95%
- F500 in state
- 110
Industry mix (Fortune 500 HQ in TX)
| Industry | F500 HQs | Revenue |
|---|---|---|
| Energy | 16 | $1,198B |
|
||
| Technology | 5 | $198B |
|
||
| Engineering / Construction | 4 | $72B |
|
||
| Energy Services | 3 | $60B |
|
||
| Utilities | 3 | $41B |
|
||
| Healthcare | 2 | $330B |
|
||
Price history
+1507.1% since first listed25 events — show timeline
- 2026-06-02 Listed $225,000 HARMLS
- 2021-02-12 Sold (Public Records) — Public Records
- 2021-02-11 Sold (MLS) — HARMLS
- 2021-01-29 Pending — HARMLS
- 2021-01-19 Pending — HARMLS
- 2020-07-13 Listed $184,900 HARMLS
- 2020-02-04 Sold (Public Records) — Public Records
- 2020-02-03 Sold (MLS) — HARMLS
- 2020-01-16 Pending — HARMLS
- 2020-01-08 Pending — HARMLS
- 2020-01-07 Listed $20,000 HARMLS
- 2018-07-16 Sold (Public Records) — Public Records
- 2018-07-12 Sold (MLS) — HARMLS
- 2018-06-17 Pending — HARMLS
- 2018-06-05 Listed $14,000 HARMLS
- 2017-06-20 Pending — HARMLS
- 2017-06-16 Pending — HARMLS
- 2017-06-12 Listing Removed — HARMLS
- 2013-08-03 Relisted — HARMLS
- 2013-07-31 Listing Removed — HARMLS
- 2012-06-19 Listed $13,500 HARMLS
- 2011-11-16 Listing Removed — HARMLS
- 2011-05-15 Listed $14,000 HARMLS
- 2010-06-10 Sold (Public Records) — Public Records
- 1988-01-02 Sold (Public Records) — Public Records
Property tax history
+16.5%/yrLatest (2025): $4,420 · +2.4% YoY. Source: county tax records.
Cash-flow waterfall
monthlySold comps — $/sqft
last 12 mo · ≤1 miLoading sold comps…