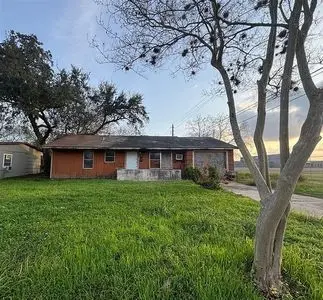
1701 E Walnut Ave · Victoria, TX
Flood risk 4/10 · Minor
- FEMA flood zone
- X
- Chance of flooding over 30 yrs
- 0.22%
- Est. flood insurance / yr
- $507 – $1,088
Fire risk 1/10 · Minimal
- Est. fire insurance / yr
- $1,222 – $2,270
Heat risk 9/10 · Severe
- Hot days now (above 111°F)
- 7 days/yr
- Hot days in 30 yrs
- 21 days/yr
Wind risk 8/10 · Major
- Chance of severe wind over 30 yrs
- 99.0%
Air-quality risk 1/10 · Minimal
- Unhealthy air days now
- 0 days/yr
- Unhealthy air days in 30 yrs
- 0 days/yr
Risk factors via First Street. Map © Google.
Why this score? — see what drove the B- grade
The composite is a weighted blend of 9 inputs, each scored 0–100. Each bar is that input's sub-score; the figure is the points it added to the 100-point composite (weight × sub-score).
- Cash flow +30.0/30.0
- 1% rule +10.0/10.0
- DSCR +10.0/10.0
- ARV discount +7.5/15.0
- Livability +3.6/5.0
- Schools +2.5/10.0
- Condition / age +2.5/5.0
- Rent growth +2.3/5.0
- Appreciation +0.0/10.0
$55,000
🖨 Deal sheet (PDF) 📄 Offer letter ✓ Due diligence
Listing remarks
For Sale & acirc; & euro; & rdquo; Victoria, TX Affordable Fixer-Upper with Huge Potential! Great opportunity for a family looking to invest, a first-time buyer, or a contractor/artist for a flip. 3 Bedrooms / 1 Bathroom Spacious Garage Sold AS-IS Property Size: Approximately 1,200 sq. ft. of living space Large lot of about 7,500 sq. ft. Enjoy extra outdoor space & acirc; & euro; & rdquo; ideal for kids, pets, or future upgrades. Location: Situated in a well-established neighborhood near UHV, with easy access to schools, shopping, and major roads. Price: $55,000 Open to reasonable discussion for serious buyers.
Key facts
- Extra outdoor space
- Large lot
- Spacious garage
Tags
Neighborhood map
What this means for you Summary
Snapshot
- This is a 2-bed/1.0-bath single-family listed at $55k.
Deal economics
- At list price, monthly cash flow is $361 ($4k/yr) — positive.
- The deal already cash-flows at list — no discount required.
- Meets the 1% rule at list price ($1k rent vs $55k).
- Recommended offer: $53k (3.0% below list) — sets the bar for market timing.
- Cap rate 14.2% vs local median 3.7% in Victoria — top-decile yield for the area; either an underpriced asset or a hidden risk that comps aren't pricing in. Stress-test before assuming the spread holds.
Location & tenants
- Location reads 71/100 on livability (#309 in TX) — a middle-class / working-renter tenant base. Strengths: cost of living A+, housing A+, health & safety A+; Watch: crime D+, amenities F, commute F.
- Victoria ISD (urban): math 24% / reading 33% proficiency, ranked #645 of 826 in TX (top 78%) — low school quality limits family demand, transient renter base, plan for 1-2y turnover.
- Zoned schools: Crain El (math 23% / reading 24%, grade F, #3,247 of 4,322 statewide, top 76%, 416 students, 89% FRL); Patti Welder Middle (math 8% / reading 23%, grade F, #1,556 of 1,662 statewide, top 94%, 638 students, 79% FRL); Victoria West H S (math 18% / reading 39%, grade F, #1,157 of 1,632 statewide, top 72%, 1,766 students, 59% FRL) — zoned schools average 76% FRL vs 58% district-wide (17 pts higher); higher-poverty schools than district average — tighter screening recommended.
- Market conditions: Rents soft (-0.8%/yr); 201 active listings in the ZIP; 29 comparable units currently listed for rent nearby; rentals lingering (median 46d on market — plan ~5-8 weeks vacancy on turnover, expect pricing pressure); 100% of comp listings sitting > 30 days — soft ceiling on asking rent; 43 units permitted in Victoria County in 2024 (0 in 5+ unit buildings).
Forward outlook
- Local home prices are declining (-3.0%/yr); year-one equity from $380 of loan paydown is wiped out by about $2k of value loss. Plan a longer hold.
- Victoria County population projected at +34% by 2050 — long-run rental-demand tailwind backs the buy-and-hold thesis.
- At projected returns (-3.0% appreciation + 0.0% rent growth), your $15k cash investment doubles in ~5 years — after that, you're playing with house money.
Negotiation context
- It's been on market 32 days — a 3% lower offer ($53k) is reasonable based on typical stale-listing flexibility.
- 2 sale attempts with the ask held roughly flat each time — persistent listings suggest the price (not the market) is what's stuck; bring a comps-based counter.
Risks & watch-outs
- Watch-outs: property tax is 4.2% of price; built in 1959 — expect roof / HVAC / electrical / plumbing capex.
- Climate carrying-cost: severe wind risk, 99% chance of damaging wind over 30y; extreme-heat days projected 7→21/yr by 2055 (HVAC capex compounding) — expect insurance premiums to compound above CPI over the hold.
Questions for the listing agent
- It's been on market 32 days. Have you received any prior offers? Is the seller open to a 3% concession, seller financing, or rate buy-down credit?
- Built in 1959 — when were the roof, HVAC, electrical panel, plumbing, and water heater last replaced?
- Property tax is high relative to price — has the assessment been appealed recently, and will the sale trigger a re-assessment?
- Is there a deadline driving the sale (1031 exchange, divorce, estate, relocation)? That informs how much negotiation room exists.
- Schools are D-rated, which usually means shorter tenancies and higher turnover. Who's the typical renter profile here, and what's been the actual vacancy rate?
- Crime grade is D in this area — have there been break-ins, vandalism, or insurance claims at this property in the last 3 years? What carrier currently insures it and at what premium?
- What's the average days-on-market for RENTAL listings here right now (not sales)? A rising rental-DOM trend means longer vacancies and softer asking-rent achievability than the comps imply.
- What's the recent tenant-quality profile in this submarket — average credit score on applications, eviction rate, late-payment / NSF rate, and stable-employment percentage? A property-management company in the area should have these aggregated.
- How much new for-sale + rental construction is in the pipeline within 1–3 miles? Heavy new supply typically softens prices + rents 12–24 months out; constrained supply supports both.
Investment metrics
- 1% rule
- 1.99% ✓
- Cap rate
- 14.17%
- Cash-on-cash
- 28.12%
- DSCR
- 2.25
- GRM
- 4.2
CMA / ARV
- ARV (on-the-fly)
- $110,760
- Comps found
- 4
Show comp detail 4 sales within ~0.75 mi
| Address | Dist | Beds/Ba | Sqft | Sold | Price | $/sf | Match |
|---|---|---|---|---|---|---|---|
| 3401 Redwood Dr | 0.18mi | 3/1.0 (+1) | 956 (+12%) | 2mo | $116,000 | $121 | 65 |
| 1608 Sam Houston Dr | 0.56mi | 3/1.0 (+1) | 920 (+8%) | 3mo | $130,000 | $141 | 53 |
| 708 E Loma Vista Ave | 0.70mi | 2/1.0 | 964 (+13%) | 3mo | $125,000 | $130 | 43 |
| 1509 Bowie Dr | 0.69mi | 3/1.0 (+1) | 917 (+8%) | 21mo | $99,900 | $109 | 32 |
Match score weights: distance 35% · size 25% · config 20% · recency 20%. Top-matched comps best support the ARV.
Projected returns pro-forma
-3.0% appreciation · 0.0% rent growth · sell at horizon
- IRR
- 18.4%
- Equity multiple
- 1.71×
- Total profit
- $10,956
- Equity at exit
- $8,201
- IRR
- 24.2%
- Equity multiple
- 2.76×
- Total profit
- $27,106
- Equity at exit
- $4,755
Cash invested: $15,400 (down + closing). Projections, not guarantees.
Landlord ↔ Tenant lean methodology
- Overall (STATE)
- 87 Strongly Landlord-Friendly
- State Texas
- 87 Strongly Landlord-Friendly · R+5
- County
- — inherits STATE
- City
- — inherits STATE
ZIP-level market 77901
- Rents YoY
- -0.8%
- Active inventory
- 201
- Price-to-rent
- 4.2×
Monthly cashflow live
- Estimated rent
- $1,096 high interval (Pro) →
- Mortgage (P&I)
- −$288
- Tax from tax record
- −$193 /mo · $2,321/yr
- Insurance
- −$23
- HOA
- −$0
- Lot rent
- −$0
- Vacancy / Maint / Mgmt
- −$230
- Net cashflow
- $361
Break-even live
Sensitivity live
| Price | -10% $392 | -5% $376 | +0% $361 | +5% $345 | +10% $330 |
|---|---|---|---|---|---|
| Rent | -10% $274 | -5% $318 | +0% $361 | +5% $404 | +10% $447 |
| Rate | -1.0pp $389 | -0.5pp $375 | base $361 | +0.5pp $347 | +1.0pp $332 |
UW: 25.0% down · 7.5% · 30yr · 1.5% tax · 5.0% vac · 8.0% maint · 8.0% mgmt
Financing live
Cash to close
- Down payment
- $13,750
- Closing costs
- $1,650
- Reserves months
- —
- Total cash needed
- —
Loan-product check · same deal, 3 products live
Conventional
25% down · 7.5% · 30yr
- Down + closing
- —
- Monthly P&I
- —
- Monthly cashflow
- —
- DSCR
- —
- Eligible?
- —
Personal DTI + credit; lowest rate.
DSCR
20% down · 8.5% · 30yr
- Down + closing
- —
- Monthly P&I
- —
- Monthly cashflow
- —
- DSCR
- —
- Eligible?
- —
No personal income docs; deal must DSCR.
Hard money
10% down · 12.0% · 12mo
- Down + closing
- —
- Monthly P&I
- —
- Monthly cashflow
- —
- DSCR
- —
- Eligible?
- —
Short-term bridge; refi at stabilization.
Rent comps 29 comps
| Address | Beds | Baths | Sqft | Rent | $/sqft | DOM | Units | Dist |
|---|---|---|---|---|---|---|---|---|
| 3001 Arroyo Dr Victoria, TX | 1.0–2.0 | 1.0–2.0 | 857 | $1,330 | $1.55 | 46d | 4 | 0.50mi |
| 2303 N Louis St Unit 2307 Victoria, TX | 2.0 | 1.0 | 820 | $850 | $1.04 | 46d | 1 | 0.58mi |
| 2303 N Louis St Unit 2303 Victoria, TX | 3.0 | 1.0 | 850 | $950 | $1.12 | 46d | 1 | 0.58mi |
| 1906 Sam Houston Dr Victoria, TX | 1.0–2.0 | 1.0–2.0 | 678 | $1,255 | $1.85 | 46d | 9 | 0.68mi |
| 118 Milann St Unit B Victoria, TX | 3.0 | 1.0 | 936 | $1,175 | $1.26 | 46d | 1 | 0.84mi |
| 1810 E Colorado St Victoria, TX | 1.0–3.0 | 1.0–2.0 | 907 | $1,112 | $1.23 | 46d | 8 | 0.88mi |
| 1605 Bexar Ave Victoria, TX | 3.0 | 1.0 | 762 | $1,395 | $1.83 | 46d | 1 | 0.91mi |
| 1603 E Brazos St Victoria, TX | 1.0–2.0 | 1.0 | 796 | $975 | $1.22 | 46d | 6 | 0.93mi |
| 2107 N Ben Jordan St Victoria, TX | 1.0 | 1.0 | 616 | $745 | $1.21 | 46d | 1 | 0.93mi |
| 1303 E Colorado St Victoria, TX | 2.0 | 1.0 | 525 | $675 | $1.29 | 46d | 1 | 1.02mi |
| 111 Monterrey Dr Unit A Victoria, TX | 2.0 | 2.0 | 1014 | $1,295 | $1.28 | 46d | 1 | 1.07mi |
| 903 Linwood Dr Victoria, TX | 1.0 | 1.0 | 700 | $899 | $1.28 | 46d | 1 | 1.10mi |
| 903 Linwood Dr Victoria, TX | 2.0 | 2.0 | 950 | $1,150 | $1.21 | 46d | 1 | 1.10mi |
| 903 Linwood Dr Apt 406 Victoria, TX | 2.0 | 1.0 | 866 | $975 | $1.13 | 46d | 1 | 1.10mi |
| 2601 Leary Ln #14 Victoria, TX | 3.0 | 2.0 | 950 | $1,195 | $1.26 | 46d | 1 | 1.10mi |
| 3104 Sam Houston Dr Victoria, TX | 2.0–3.0 | 1.0–1.5 | 925 | $975 | $1.05 | 46d | 2 | 1.14mi |
| 301 Westwood St Victoria, TX | 2.0 | 1.0 | 987 | $1,145 | $1.16 | 46d | 1 | 1.19mi |
| 301 Westwood St Apt D Victoria, TX | 2.0 | 1.5 | 987 | $1,145 | $1.16 | 46d | 1 | 1.20mi |
| 102 Palmwood Dr Victoria, TX | 2.0 | 2.0 | 1100 | $1,045 | $0.95 | 46d | 1 | 1.20mi |
| 203 Palmwood Dr Unit B Victoria, TX | 3.0 | 2.0 | 1110 | $1,350 | $1.22 | 46d | 1 | 1.21mi |
| 306 Sam Houston Dr Victoria, TX | 1.0–2.0 | 1.0–2.0 | 770 | $1,370 | $1.78 | 46d | 4 | 1.25mi |
| 308 Westwood St Unit D Victoria, TX | 2.0 | 1.5 | 1010 | $1,175 | $1.16 | 46d | 1 | 1.27mi |
| 2406 E Mockingbird Ln Victoria, TX | 1.0–3.0 | 1.0–2.0 | 1032 | $1,062 | $1.03 | 46d | 4 | 1.27mi |
| 212 Sam Houston Dr Unit 209 Victoria, TX | 2.0 | 1.0 | 974 | $963 | $0.99 | 46d | 1 | 1.29mi |
| 212 Sam Houston Dr Unit 125 Victoria, TX | 1.0 | 1.0 | 674 | $863 | $1.28 | 46d | 1 | 1.29mi |
| 212 Sam Houston Dr Unit 220 Victoria, TX | 2.0 | 1.0 | 974 | $1,013 | $1.04 | 46d | 1 | 1.29mi |
| 2402 N Ben Wilson St Victoria, TX | 1.0–2.0 | 1.0–2.0 | 987 | $1,580 | $1.60 | 46d | 20 | 1.30mi |
| 1002 Pine St Victoria, TX | 1.0 | 1.0 | 650 | $575 | $0.88 | 46d | 1 | 1.44mi |
| 1702 N Moody St Apt C1 Victoria, TX | 2.0 | 1.5 | 945 | $1,050 | $1.11 | 46d | 1 | 1.48mi |
Listing history 22 events
-
2026-06-23days on market $55,000 Active 32 DOM
-
2026-06-21days on market $55,000 Active 31 DOM
-
2026-06-19days on market $55,000 Active 29 DOM
-
2026-06-18days on market $55,000 Active 28 DOM
-
2026-06-17days on market $55,000 Active 27 DOM
-
2026-06-16days on market $55,000 Active 26 DOM
-
2026-06-15days on market $55,000 Active 25 DOM
-
2026-06-14days on market $55,000 Active 23 DOM
-
2026-06-13days on market $55,000 Active 22 DOM
-
2026-06-10days on market $55,000 Active 20 DOM
-
2026-06-09days on market $55,000 Active 19 DOM
-
2026-06-08days on market $55,000 Active 18 DOM
-
2026-06-07days on market $55,000 Active 17 DOM
-
2026-06-03days on market $55,000 Active 13 DOM
-
2026-06-02days on market $55,000 Active 12 DOM
-
2026-06-01days on market $55,000 Active 11 DOM
-
2026-05-31days on market $55,000 Active 10 DOM
-
2026-05-30days on market $55,000 Active 9 DOM
-
2026-05-22$55,000 Active
-
2026-03-31historical
-
2026-03-25historical Active Under Contract
-
2026-02-09$60,000 Active
ⓘ Source: listings_history table (triggers on properties + properties_extension) + one-shot
backfill from property_details.listing_events for pre-trigger history.
Tax reassessment forecast TX · Resets to sale price
- Current annual tax
- $2,321 · $193/mo
- Projected year-2 tax
- $2,321 · $193/mo
- Expected delta
- $0/yr ($0/mo · 0.0%)
ⓘ Screening estimate from a state-policy table — verify with the county assessor before closing.
Climate risk First Street
- Flood 4/10 Moderate FEMA zone X · 22% chance over 30 yrs
- Wildfire 1/10 Low
- Heat 9/10 Extreme 7 d/yr ≥111°F today · 21 d/yr by 30 yrs out
- Wind 8/10 Severe 99% chance of damaging wind over 30 yrs
- Air quality 1/10 Low 0 unhealthy d/yr today · 0 by 30 yrs out
Nearby sold comps map
Loading sold comps map…
Walkable amenities ~0.75 mi
Loading nearby amenities…
Taxation est. · year 1
- Rental income
- $13,149
- − Mortgage interest
- −$3,081
- − Property taxes
- −$2,321
- − Insurance
- −$275
- − Repairs & maintenance
- −$1,052
- − Management
- −$1,052
- − Depreciation
- −$1,600
- Taxable income
- $3,769
- Est. tax owed @ 24.0%
- −$904
- After-tax cash flow
- $3,426/yr
For passive investors: Depreciation is non-cash, so a rental often shows a tax loss while cash-flowing — sheltering income. Rental losses are passive: they offset passive income freely, and up to $25,000/yr can offset ordinary (W-2) income if you actively participate and your MAGI is under $100k (phasing out to $0 by $150k); unused losses carry forward. On sale, claimed depreciation is recaptured at up to 25%, and gains may owe capital-gains tax (a 1031 exchange can defer both). Figures are a year-1 estimate at your 24.0% rate — not tax advice; consult a CPA.
Schools (NCES district)
- District
- Victoria ISD
- NCES district ID
- 4844150
- Math proficiency
- 24% ▼ -12.00%
- Reading proficiency
- 33% ▼ -2.00%
- Median HH income
- $50,534
- Composite
- 24.98/100
- National rank
- #7562
- State rank
- #645 of 826 in TX
Livability — Victoria
- Score
- 71/100
- State rank
- #309
- US rank
- #6960
Category grades
Schools grade is shown separately in the Schools card above.
Census & demographics
- Census place
- Victoria, TX
- County
- Victoria County · 69,915 people
- City population
- 69,915
- Metro
- Victoria, TX
- Population (ZIP)
- 39,854
- Household income
- $57,923
- Rent vs Own
- Severe rent burden
- 1802.0
Population outlook (Victoria County) Hauer SSP2
- Today (2025)
- 106,119 people
- By 2030
- 113,161 · +6.6%
- By 2040
- 127,402 · +20.1%
- By 2050
- 141,953 · +33.8%
- By 2075
- 179,410 · +69.1%
- By 2100
- 200,127 · +88.6%
Race, ethnicity, and origin ACS 2023
- Neighborhood character
- Predominantly Hispanic (66%)
- Race & ethnicity
- Hispanic / Latino 66% Two or more races 30% White 24% Black 7% Asian 2%
- Hispanic origin (detail)
- Mexican 60%
- Common ancestry
- Serbian 2% Lithuanian 1% Italian 1%
- Foreign-born
- 10% · Canada, China
- Languages at home
- 64% English-only · Spanish 35% Chinese 1%
Political lean MEDSL · Victoria
- 2024 margin
- Solid R (+42.6) · D 28.4% · R 71.0%
- 2008→2024 swing
- -9.0pp toward R · 2008: -33.6pp · 2024: -42.6pp
- All cycles
- 2024: R+42.6 2020: R+38.0 2016: R+40.0 2012: R+37.8 2008: R+33.6
Not yet ingested
- Civics
- —
Market trends
- HPI YoY
- ▼ -127.62%
- Current HPI
- 138.3569
- Rent YoY
- ▼ -0.79%
- Metro
- Victoria, TX
- State GDP YoY
- ▲ 3.95%
- F500 in state
- 110
Industry mix (Fortune 500 HQ in TX)
| Industry | F500 HQs | Revenue |
|---|---|---|
| Energy | 16 | $1,198B |
|
||
| Technology | 5 | $198B |
|
||
| Engineering / Construction | 4 | $72B |
|
||
| Energy Services | 3 | $60B |
|
||
| Utilities | 3 | $41B |
|
||
| Healthcare | 2 | $330B |
|
||
Price history
-8.3% since first listed4 events — show timeline
- 2026-05-22 Listed $55,000 FSBO.com
- 2026-03-31 Listing Removed — CTXMLS
- 2026-03-25 Contingent — CTXMLS
- 2026-02-09 Listed $60,000 CTXMLS
Property tax history
+4.8%/yrLatest (2025): $2,321 · -7.6% YoY. Source: county tax records.
Cash-flow waterfall
monthlySold comps — $/sqft
last 12 mo · ≤1 miLoading sold comps…