 🏗️ New Construction
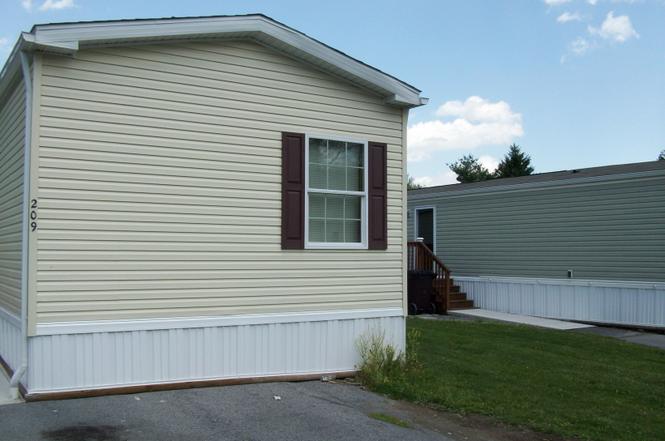
Eagle River Cross Keys Village Plan · Cross Keys, PA
Flood risk 4/10 · Minor
- FEMA flood zone
- A
- Chance of flooding over 30 yrs
- 0.21%
- Est. flood insurance / yr
- $1,009 – $1,996
Fire risk 1/10 · Minimal
- Est. fire insurance / yr
- $511 – $949
Heat risk 4/10 · Minor
- Hot days now (above 95°F)
- 7 days/yr
- Hot days in 30 yrs
- 18 days/yr
Wind risk 2/10 · Minimal
- Chance of severe wind over 30 yrs
- —
Air-quality risk 2/10 · Minimal
- Unhealthy air days now
- 1 days/yr
- Unhealthy air days in 30 yrs
- 3 days/yr
Risk factors via First Street. Map © Google.
Why this score? — see what drove the B- grade
The composite is a weighted blend of 9 inputs, each scored 0–100. Each bar is that input's sub-score; the figure is the points it added to the 100-point composite (weight × sub-score).
- Cash flow +30.0/30.0
- 1% rule +10.0/10.0
- DSCR +10.0/10.0
- ARV discount +7.5/15.0
- Schools +4.6/10.0
- Rent growth +2.5/5.0
- Livability +2.5/5.0
- Condition / age +2.5/5.0
- Appreciation +0.0/10.0
$65,900
🖨 Deal sheet 📄 Offer letter ✓ Due diligence
Listing remarks
Embark on a new way of life, at our Cross Keys Village manufactured homes in Duncansville, PA. This community by UMH Properties, Inc. is located close to the spectacular Appalachian mountains, providing residents with views to inspire, and an escape to the outdoors. Cross Keys Village is a community in Pennsylvania with a variety of homes that include open-concept floor plans, full kitchen appliance packages, kitchen pantries, and spacious dining areas. Cross Keys Village offers well crafted and appealing exteriors with front and back decks, driveways, storage sheds, and shaker shingle roofing to give each home features that our residents love. Stop by our community office or give us a call
Property features AI
Finance
- Other: Address: Eagle River Cross Keys Village, Duncansville, PA 16635; Plan inventory type
- Financial info: List price $64,300
Exterior
- Utilities: Central air conditioning
- Home design: Plan: EAGLE RIVER Cross Keys Village; Active listing
- Construction: Living area approximately 1,184
- Exterior features: Shake roof
Interior
- Bedrooms: 3 bedrooms
- Bathrooms: 2 bathrooms
- Heating & cooling: Central air
- Interior features: Central air conditioning
Neighborhood map
What this means for you Summary
Snapshot
- This is a 3-bed/2.0-bath manufactured listed at $66k.
Deal economics
- At list price, monthly cash flow is $240 ($3k/yr) — positive.
- The deal already cash-flows at list — no discount required.
- Meets the 1% rule at list price ($1k rent vs $66k).
Location & tenants
- Location reads: area grade B — affects rentability + tenant quality, not the cash-flow math above.
- Hollidaysburg Area SD (suburban): math 45% / reading 63% proficiency, ranked #129 of 539 in PA (top 24%) — acceptable for families but not a draw, mixed tenant base, ~2y average lease.
- Market conditions: 92 active listings in the ZIP; 2 comparable units currently listed for rent nearby; 99 units permitted in Blair County in 2024 (0 in 5+ unit buildings).
Forward outlook
- Local home prices are declining (-3.0%/yr); year-one equity from $456 of loan paydown is wiped out by about $2k of value loss. Plan a longer hold.
- Blair County population projected at -18% by 2050 — secular population decline; favor cash flow + early exit over multi-decade hold.
- At projected returns (-3.0% appreciation + 3.0% rent growth), your $18k cash investment doubles in ~8 years — after that, you're playing with house money.
Negotiation context
- Only 1 days on market — expect competitive offers; lowballing is unlikely to land.
Risks & watch-outs
- Watch-outs: flood insurance adds $125/mo.
- Climate carrying-cost: in FEMA flood zone A (mandatory federal flood insurance) — expect insurance premiums to compound above CPI over the hold.
Questions for the listing agent
- What's the actual annual flood-insurance premium (NFIP or private), and is the property in a SFHA with mandatory coverage?
- Is there a deadline driving the sale (1031 exchange, divorce, estate, relocation)? That informs how much negotiation room exists.
- What's the average days-on-market for RENTAL listings here right now (not sales)? A rising rental-DOM trend means longer vacancies and softer asking-rent achievability than the comps imply.
- What's the recent tenant-quality profile in this submarket — average credit score on applications, eviction rate, late-payment / NSF rate, and stable-employment percentage? A property-management company in the area should have these aggregated.
- How much new for-sale + rental construction is in the pipeline within 1–3 miles? Heavy new supply typically softens prices + rents 12–24 months out; constrained supply supports both.
Investment metrics
- 1% rule
- 1.58% ✓
- Cap rate
- 12.95%
- Cash-on-cash
- 23.76%
- DSCR
- 2.06
- GRM
- 5.3
CMA / ARV
No comps found within radius.
Projected returns pro-forma
-3.0% appreciation · 3.0% rent growth · sell at horizon
- IRR
- 6.5%
- Equity multiple
- 1.26×
- Total profit
- $4,712
- Equity at exit
- $9,826
- IRR
- 16.0%
- Equity multiple
- 2.31×
- Total profit
- $24,178
- Equity at exit
- $5,698
Cash invested: $18,452 (down + closing). Projections, not guarantees.
Landlord ↔ Tenant lean methodology
- Overall (STATE)
- 62 Landlord-Friendly
- State Pennsylvania
- 62 Landlord-Friendly · EVEN
- County
- — inherits STATE
- City
- — inherits STATE
ZIP-level market 16635
- Home prices YoY
- -4.0%
- Active inventory
- 92
- Price-to-rent
- 5.3×
Monthly cashflow live
- Estimated rent
- $1,039 medium interval (Pro) →
- Mortgage (P&I)
- −$346
- Tax est. 1.5%
- −$82 /mo · $988/yr
- Insurance
- −$27
- Flood insurance flood zone
- −$125 /mo · $1,502/yr
- HOA
- −$0
- Vacancy / Maint / Mgmt
- −$218
- Net cashflow
- $240
Break-even live
UW: 25.0% down · 7.5% · 30yr · 1.5% tax · 5.0% vac · 8.0% maint · 8.0% mgmt
Financing live
Cash to close
- Down payment
- $16,475
- Closing costs
- $1,977
- Reserves months
- —
- Total cash needed
- —
Loan-product check · same deal, 3 products live
Conventional
25% down · 7.5% · 30yr
- Down + closing
- —
- Monthly P&I
- —
- Monthly cashflow
- —
- DSCR
- —
- Eligible?
- —
Personal DTI + credit; lowest rate.
DSCR
20% down · 8.5% · 30yr
- Down + closing
- —
- Monthly P&I
- —
- Monthly cashflow
- —
- DSCR
- —
- Eligible?
- —
No personal income docs; deal must DSCR.
Hard money
10% down · 12.0% · 12mo
- Down + closing
- —
- Monthly P&I
- —
- Monthly cashflow
- —
- DSCR
- —
- Eligible?
- —
Short-term bridge; refi at stabilization.
Rent comps 2 comps
| Address | Beds | Baths | Sqft | Rent | $/sqft | DOM | Units | Dist |
|---|---|---|---|---|---|---|---|---|
| 259 Brown Swiss Cir Duncansville, PA | 2.0–3.0 | 1.0–2.0 | 784 | $1,025 | $1.31 | 44d | 1 | 0.02mi |
| 1024 3rd Ave Unit 2nd Fl Duncansville, PA | 2.0 | 1.0 | 1000 | $1,200 | $1.20 | 44d | 1 | 1.47mi |
Listing history 14 events
-
2026-06-19pricedays on market $65,900 Active 1 DOM
-
2026-06-18days on market $64,300 Active 33 DOM
-
2026-06-17days on market $64,300 Active 32 DOM
-
2026-06-16days on market $64,300 Active 31 DOM
-
2026-06-15days on market $64,300 Active 30 DOM
-
2026-06-14days on market $64,300 Active 28 DOM
-
2026-06-13days on market $64,300 Active 27 DOM
-
2026-06-10days on market $64,300 Active 25 DOM
-
2026-06-09days on market $64,300 Active 24 DOM
-
2026-06-08days on market $64,300 Active 23 DOM
-
2026-06-07days on market $64,300 Active 22 DOM
-
2026-06-05days on market $64,300 Active 19 DOM
-
2026-06-03remarks 699-char remark
-
2026-06-03$64,300 Active 18 DOM
ⓘ Source: listings_history table (triggers on properties + properties_extension) + one-shot
backfill from property_details.listing_events for pre-trigger history.
Climate risk First Street
- Flood 4/10 Moderate FEMA zone A · 21% chance over 30 yrs
- Wildfire 1/10 Low
- Heat 4/10 Moderate 7 d/yr ≥95°F today · 18 d/yr by 30 yrs out
- Wind 2/10 Low
- Air quality 2/10 Low 1 unhealthy d/yr today · 3 by 30 yrs out
Nearby sold comps map
Loading sold comps map…
Walkable amenities ~0.75 mi
Loading nearby amenities…
Taxation est. · year 1
- Rental income
- $12,468
- − Mortgage interest
- −$3,691
- − Property taxes
- −$988
- − Insurance
- −$1,832
- − Repairs & maintenance
- −$997
- − Management
- −$997
- − Depreciation
- −$1,917
- Taxable income
- $2,044
- Est. tax owed @ 24.0%
- −$491
- After-tax cash flow
- $2,392/yr
For passive investors: Depreciation is non-cash, so a rental often shows a tax loss while cash-flowing — sheltering income. Rental losses are passive: they offset passive income freely, and up to $25,000/yr can offset ordinary (W-2) income if you actively participate and your MAGI is under $100k (phasing out to $0 by $150k); unused losses carry forward. On sale, claimed depreciation is recaptured at up to 25%, and gains may owe capital-gains tax (a 1031 exchange can defer both). Figures are a year-1 estimate at your 24.0% rate — not tax advice; consult a CPA.
Schools (NCES district)
- District
- Hollidaysburg Area SD
- NCES district ID
- 4211940
- Math proficiency
- 45% ▼ -9.00%
- Reading proficiency
- 63% ▼ -8.00%
- Median HH income
- $50,676
- Composite
- 46.1/100
- National rank
- #2511
- State rank
- #129 of 539 in PA
Livability — Cross Keys
No livability data for this city. (Only ~50 U.S. cities are tracked.)
Census & demographics
- Census place
- Cross Keys, PA
- Population (ZIP)
- 12,115
Population outlook (Blair County) Hauer SSP2
- Today (2025)
- 121,571 people
- By 2030
- 117,966 · -3.0%
- By 2040
- 109,174 · -10.2%
- By 2050
- 99,542 · -18.1%
- By 2075
- 76,775 · -36.8%
- By 2100
- 54,326 · -55.3%
Race, ethnicity, and origin ACS 2023
- Neighborhood character
- Predominantly White (94%)
- Race & ethnicity
- White 94% Two or more races 3% Asian 2% Hispanic / Latino 2%
- Common ancestry
- Romanian 3% Slovak 2% Lithuanian 1%
- Foreign-born
- 2% · China
- Languages at home
- 96% English-only · Other Indo-European 2% Chinese 1% Spanish 1%
Political lean MEDSL · Blair
- 2024 margin
- Solid R (+43.5) · D 27.9% · R 71.4%
- 2008→2024 swing
- -19.2pp toward R · 2008: -24.3pp · 2024: -43.5pp
- All cycles
- 2024: R+43.5 2020: R+43.5 2016: R+46.4 2012: R+33.5 2008: R+24.3
Not yet ingested
- Civics
- —
Market trends
- HPI YoY
- ▼ -10.69%
- Current HPI
- 258.7396
- Rent YoY
- —
- Metro
- —
- State GDP YoY
- ▲ 1.68%
- F500 in state
- 34
Industry mix (Fortune 500 HQ in PA)
| Industry | F500 HQs | Revenue |
|---|---|---|
| Healthcare | 2 | $309B |
|
||
| Insurance | 2 | $27B |
|
||
| Telecommunications / Media | 1 | $124B |
|
||
| Industrial Distribution | 1 | $22B |
|
||
| Financial Services | 1 | $20B |
|
||
| Chemicals / Materials | 1 | $18B |
|
||
Cash-flow waterfall
monthlySold comps — $/sqft
last 12 mo · ≤1 miLoading sold comps…