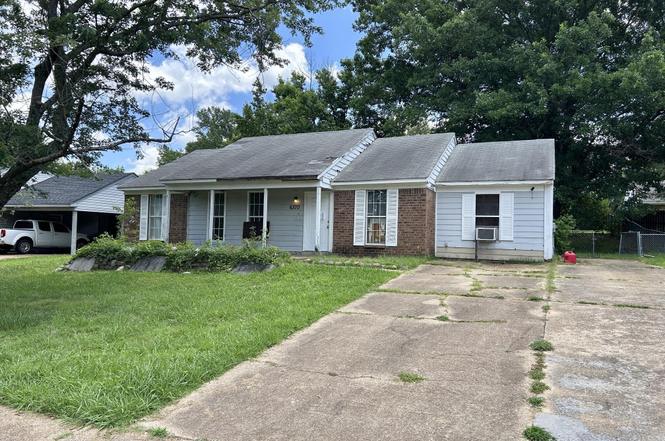
6370 Sandhurst Rd · Horn Lake, MS
Flood risk 1/10 · Minimal
- FEMA flood zone
- X (unshaded)
- Chance of flooding over 30 yrs
- 0.0%
- Est. flood insurance / yr
- $507 – $1,088
Fire risk 4/10 · Minor
- Est. fire insurance / yr
- $1,241 – $2,305
Heat risk 6/10 · Moderate
- Hot days now (above 109°F)
- 7 days/yr
- Hot days in 30 yrs
- 21 days/yr
Wind risk 4/10 · Minor
- Chance of severe wind over 30 yrs
- 18.0%
Air-quality risk 2/10 · Minimal
- Unhealthy air days now
- 2 days/yr
- Unhealthy air days in 30 yrs
- 2 days/yr
Risk factors via First Street. Map © Google.
Why this score? — see what drove the B+ grade
The composite is a weighted blend of 9 inputs, each scored 0–100. Each bar is that input's sub-score; the figure is the points it added to the 100-point composite (weight × sub-score).
- Cash flow +29.8/30.0
- ARV discount +15.0/15.0
- DSCR +10.0/10.0
- 1% rule +8.5/10.0
- Schools +4.0/10.0
- Livability +3.1/5.0
- Condition / age +2.5/5.0
- Rent growth +2.3/5.0
- Appreciation +0.0/10.0
$120,000
🖨 Deal sheet (PDF) 📄 Offer letter ✓ Due diligence
Listing remarks
Investor special on this 4 bedroom, 2 bath home that is strictly being sold as-is. The square footage does not include a finished attic room with a stairway. The enclosed carport could serve as the 4th bedroom or as a den area. The HVAC system age is unknown but it looks newer. Do not miss this opportunity.
Key facts
- 9,583 sq ft lot
- Built 1988
- Listed 3 days
Property features AI
Exterior
- Parking: Driveway on concrete
- Utilities: Public water; Public sewer; Electricity connected; Water connected; Sewer connected
- Home design: Single-family house; One story; Living area reported by appraiser
- Construction: Brick veneer and lap siding exterior; Asphalt shingle roof; Slab foundation; Built year reported by assessor
- Exterior features: Front porch; Patio; Lot about 0.22 acres
Interior
- Bathrooms: 2 full bathrooms
- Heating & cooling: Central heating; Central air conditioning
- Interior features: Includes miscellaneous appliance(s); Fixer condition
Neighborhood map
What this means for you Summary
Snapshot
- This is a 3-bed/2.0-bath single-family listed at $120k.
Deal economics
- At list price, monthly cash flow is $441 ($5k/yr) — positive.
- The deal already cash-flows at list — no discount required.
- Meets the 1% rule at list price ($2k rent vs $120k).
- Cap rate 10.7% vs local median 5.9% in Horn Lake — top-decile yield for the area; either an underpriced asset or a hidden risk that comps aren't pricing in. Stress-test before assuming the spread holds.
Location & tenants
- Location reads 61/100 on livability (#196 in MS) — a middle-class / working-renter tenant base. Strengths: cost of living A+, housing A+, crime A; Watch: employment D, amenities F, commute F.
- Desoto County School District (suburban): math 48% / reading 42% proficiency, ranked #20 of 130 in MS (top 15%) — families likely to look elsewhere, expect single-tenant / working-renter base with shorter leases.
- Zoned schools: Shadow Oaks Elementary School (459 students, 99% FRL); Horn Lake Middle School (math 37% / reading 21%, grade F, #90 of 179 statewide, top 52%, 1,021 students, 100% FRL); Horn Lake High (math 28% / reading 30%, grade F, #98 of 197 statewide, top 49%, 1,361 students, 100% FRL) — zoned schools average 100% FRL vs 43% district-wide (56 pts higher); higher-poverty schools than district average — tighter screening recommended.
- Zoned-school proficiency averages 29% at this address vs 45% district-wide (-16 pts) — the specific schools serving this property underperform the Desoto County School District average; the district grade overstates school quality for this exact location.
- Market conditions: Rents soft (-0.7%/yr); 97 active listings in the ZIP; 40 comparable units currently listed for rent nearby; rentals at typical pace (median 22d on market — plan ~3-4 weeks tenant-placement turnaround); 1,155 units permitted in DeSoto County in 2024 (0 in 5+ unit buildings).
- This rent runs 36% of the median local income ($53k/yr) — at the standard rent-burdened threshold; future hikes will face affordability resistance.
Forward outlook
- Local home prices are declining (-3.0%/yr); year-one equity from $830 of loan paydown is wiped out by about $4k of value loss. Plan a longer hold.
- DeSoto County population projected at +33% by 2050 — long-run rental-demand tailwind backs the buy-and-hold thesis.
Negotiation context
- Only 3 days on market — expect competitive offers; lowballing is unlikely to land.
- 2 sale attempts since 23y ago with the ask held roughly flat each time — persistent listings suggest the price (not the market) is what's stuck; bring a comps-based counter.
Risks & watch-outs
- Climate carrying-cost: extreme-heat days projected 7→21/yr by 2055 (HVAC capex compounding) — expect insurance premiums to compound above CPI over the hold.
Questions for the listing agent
- Is there a deadline driving the sale (1031 exchange, divorce, estate, relocation)? That informs how much negotiation room exists.
- Schools are F-rated, which usually means shorter tenancies and higher turnover. Who's the typical renter profile here, and what's been the actual vacancy rate?
- What's the average days-on-market for RENTAL listings here right now (not sales)? A rising rental-DOM trend means longer vacancies and softer asking-rent achievability than the comps imply.
- What's the recent tenant-quality profile in this submarket — average credit score on applications, eviction rate, late-payment / NSF rate, and stable-employment percentage? A property-management company in the area should have these aggregated.
- How much new for-sale + rental construction is in the pipeline within 1–3 miles? Heavy new supply typically softens prices + rents 12–24 months out; constrained supply supports both.
Investment metrics
- 1% rule
- 1.35% ✓
- Cap rate
- 10.71%
- Cash-on-cash
- 15.76%
- DSCR
- 1.70
- GRM
- 6.2
CMA / ARV
- ARV (on-the-fly)
- $193,050
- Comps found
- 12
Show comp detail 12 sales within ~0.75 mi
| Address | Dist | Beds/Ba | Sqft | Sold | Price | $/sf | Match |
|---|---|---|---|---|---|---|---|
| 6325 Collinwood Rd | 0.09mi | 3/2.0 | 1,162 (-1%) | 2mo | $202,000 | $174 | 93 |
| 3530 Woodmont Cv | 0.27mi | 3/1.5 | 1,100 (-6%) | 7mo | $189,500 | $172 | 70 |
| 3430 Mayfair Dr | 0.34mi | 3/2.0 | 1,089 (-7%) | 3mo | $204,900 | $188 | 70 |
| 6160 Lynnfield Rd | 0.58mi | 3/1.5 | 1,183 (+1%) | 2mo | $190,000 | $161 | 68 |
| 6395 Kensington Rd | 0.23mi | 3/2.0 | 1,322 (+13%) | 1mo | $242,000 | $183 | 67 |
| 6570 Westbury Ave | 0.26mi | 3/2.0 | 1,320 (+13%) | 0mo | $200,000 | $152 | 66 |
| 3140 Forest Glen Dr | 0.60mi | 3/1.5 | 1,206 (+3%) | 2mo | $170,000 | $141 | 63 |
| 6795 Dunbarton Dr | 0.47mi | 3/2.0 | 1,260 (+8%) | 4mo | $208,000 | $165 | 62 |
| 3405 Woodbine Cv | 0.53mi | 3/2.0 | 1,246 (+6%) | 4mo | $194,900 | $156 | 61 |
| 3415 Edenshire Ln | 0.73mi | 2/2.0 (-1) | 1,195 (+2%) | 1mo | $194,900 | $163 | 56 |
| 6701 Tulane Rd | 0.55mi | 4/2.0 (+1) | 1,236 (+6%) | 6mo | $219,000 | $177 | 55 |
| 3045 Normandy Dr | 0.69mi | 4/1.5 (+1) | 1,238 (+6%) | 2mo | $160,000 | $129 | 50 |
Match score weights: distance 35% · size 25% · config 20% · recency 20%. Top-matched comps best support the ARV.
Projected returns pro-forma
-3.0% appreciation · 0.0% rent growth · sell at horizon
- IRR
- 3.2%
- Equity multiple
- 1.12×
- Total profit
- $3,943
- Equity at exit
- $17,892
- IRR
- 9.6%
- Equity multiple
- 1.64×
- Total profit
- $21,389
- Equity at exit
- $10,375
Cash invested: $33,600 (down + closing). Projections, not guarantees.
Landlord ↔ Tenant lean methodology
- Overall (STATE)
- 90 Strongly Landlord-Friendly
- State Mississippi
- 90 Strongly Landlord-Friendly · R+11
- County
- — inherits STATE
- City
- — inherits STATE
ZIP-level market 38637
- Home prices YoY
- -13.4%
- Rents YoY
- -0.7%
- Active inventory
- 97
- Price-to-rent
- 6.2×
Monthly cashflow live
- Estimated rent
- $1,622 high interval (Pro) →
- Mortgage (P&I)
- −$629
- Tax from tax record
- −$160 /mo · $1,924/yr
- Insurance
- −$50
- HOA
- −$0
- Vacancy / Maint / Mgmt
- −$341
- Net cashflow
- $441
Break-even live
Sensitivity live
| Price | -10% $509 | -5% $475 | +0% $441 | +5% $407 | +10% $373 |
|---|---|---|---|---|---|
| Rent | -10% $313 | -5% $377 | +0% $441 | +5% $505 | +10% $569 |
| Rate | -1.0pp $502 | -0.5pp $472 | base $441 | +0.5pp $410 | +1.0pp $379 |
UW: 25.0% down · 7.5% · 30yr · 1.5% tax · 5.0% vac · 8.0% maint · 8.0% mgmt
Financing live
Cash to close
- Down payment
- $30,000
- Closing costs
- $3,600
- Reserves months
- —
- Total cash needed
- —
Loan-product check · same deal, 3 products live
Conventional
25% down · 7.5% · 30yr
- Down + closing
- —
- Monthly P&I
- —
- Monthly cashflow
- —
- DSCR
- —
- Eligible?
- —
Personal DTI + credit; lowest rate.
DSCR
20% down · 8.5% · 30yr
- Down + closing
- —
- Monthly P&I
- —
- Monthly cashflow
- —
- DSCR
- —
- Eligible?
- —
No personal income docs; deal must DSCR.
Hard money
10% down · 12.0% · 12mo
- Down + closing
- —
- Monthly P&I
- —
- Monthly cashflow
- —
- DSCR
- —
- Eligible?
- —
Short-term bridge; refi at stabilization.
Rent comps 40 comps
| Address | Beds | Baths | Sqft | Rent | $/sqft | DOM | Units | Dist |
|---|---|---|---|---|---|---|---|---|
| 6420 Sandhurst Rd Horn Lake, MS | 3.0 | 2.0 | 1101 | $1,623 | $1.47 | 22d | 1 | 0.03mi |
| 6455 Walnut Grove Rd Horn Lake, MS | 3.0 | 2.0 | 1178 | $1,600 | $1.36 | 44d | 1 | 0.06mi |
| 6445 Collinwood Rd Horn Lake, MS | 3.0 | 2.0 | 1450 | $1,593 | $1.10 | 3d | 1 | 0.08mi |
| 6290 Sandhurst Rd Horn Lake, MS | 3.0 | 2.0 | 1178 | $1,600 | $1.36 | 5d | 1 | 0.11mi |
| 6420 Cornwall Rd Horn Lake, MS | 3.0 | 2.0 | 1189 | $1,550 | $1.30 | 15d | 1 | 0.15mi |
| 6225 Sandhurst Rd Horn Lake, MS | 3.0 | 2.0 | 1200 | $1,395 | $1.16 | 44d | 1 | 0.19mi |
| 3530 Mayfair Dr Horn Lake, MS | 4.0 | 2.0 | 1300 | $1,595 | $1.23 | 15d | 1 | 0.20mi |
| 3780 Southbrook Dr Horn Lake, MS | 4.0 | 2.0 | 1444 | $1,550 | $1.07 | 5d | 1 | 0.22mi |
| 3560 Lakehurst Dr Horn Lake, MS | 4.0 | 2.0 | 1300 | $1,425 | $1.10 | 18d | 1 | 0.26mi |
| 6585 Fairwood Cv Horn Lake, MS | 3.0 | 2.0 | 1473 | $1,553 | $1.05 | 24d | 1 | 0.27mi |
| 6270 Jamestown Ave Horn Lake, MS | 3.0 | 2.0 | 1053 | $1,523 | $1.45 | 44d | 1 | 0.30mi |
| 6165 Forestgate Rd Horn Lake, MS | 3.0 | 1.5 | 1079 | $1,400 | $1.30 | 44d | 1 | 0.34mi |
| 6420 Forestgate Rd Horn Lake, MS | 3.0 | 2.0 | 1120 | $1,573 | $1.40 | 22d | 1 | 0.34mi |
| 3915 Woodland Dr Horn Lake, MS | 3.0 | 2.0 | 1400 | $1,775 | $1.27 | 44d | 1 | 0.42mi |
| 3437 Laurelwood St Horn Lake, MS | 3.0 | 2.0 | 1200 | $1,480 | $1.23 | 12d | 1 | 0.44mi |
| 4355 Shadow Ridge Dr Horn Lake, MS | 3.0 | 2.0 | 1350 | $1,760 | $1.30 | 5d | 1 | 0.54mi |
| 6475 Forest Glen Dr Horn Lake, MS | 3.0 | 1.5 | 1100 | $1,395 | $1.27 | 44d | 1 | 0.56mi |
| 3305 Laurel Dr Horn Lake, MS | 3.0 | 2.0 | 1085 | $1,450 | $1.34 | 24d | 1 | 0.59mi |
| 3060 Fairmeadow Dr Horn Lake, MS | 3.0 | 1.5 | 1104 | $1,663 | $1.51 | 3d | 1 | 0.63mi |
| 6230 Somerset Dr Horn Lake, MS | 3.0 | 2.0 | 1204 | $1,593 | $1.32 | 4d | 1 | 0.64mi |
| 6392 Manchester Dr Horn Lake, MS | 3.0 | 2.0 | 1352 | $1,715 | $1.27 | 3d | 1 | 0.66mi |
| 6360 Greenbriar Dr Horn Lake, MS | 3.0 | 1.5 | 1328 | $1,465 | $1.10 | 44d | 1 | 0.73mi |
| 4506 Shadow Hollow Dr Horn Lake, MS | 3.0 | 2.0 | 1300 | $1,645 | $1.27 | 3d | 1 | 0.76mi |
| 2890 Meadowbrook Dr Horn Lake, MS | 3.0 | 2.0 | 1171 | $1,375 | $1.17 | 4d | 1 | 0.77mi |
| 3285 Edenshire Ln Horn Lake, MS | 2.0 | 2.0 | 1407 | $1,573 | $1.12 | 24d | 1 | 0.78mi |
| 7080 Benji Ave Horn Lake, MS | 3.0 | 2.0 | 1276 | $1,550 | $1.21 | 44d | 1 | 0.81mi |
| 5905 Tulane Rd Horn Lake, MS | 2.0 | 2.0 | 1342 | $1,300 | $0.97 | 22d | 1 | 0.81mi |
| 2921 Normandy Dr Horn Lake, MS | 3.0 | 1.5 | 1250 | $1,200 | $0.96 | 24d | 1 | 0.83mi |
| 3914 Santa Fe Loop Horn Lake, MS | 3.0 | 3.0 | 1238 | $1,673 | $1.35 | 24d | 1 | 0.88mi |
| 2900 Brachton Cv W Horn Lake, MS | 2.0 | 2.0 | 1000 | $1,225 | $1.23 | 24d | 1 | 0.88mi |
| 2905 Brook Cv Horn Lake, MS | 3.0 | 1.0 | 1112 | $1,195 | $1.07 | 3d | 1 | 0.89mi |
| 2905 Brook Cv Horn Lake, MS | 3.0 | 1.0 | 1112 | $1,195 | $1.07 | 22d | 1 | 0.89mi |
| 7163 Layne Dr Horn Lake, MS | 3.0 | 2.0 | 1320 | $1,595 | $1.21 | 24d | 1 | 0.89mi |
| 2881 Normandy Dr Horn Lake, MS | 3.0 | 1.5 | 1283 | $1,450 | $1.13 | 44d | 1 | 0.90mi |
| 7101 Tulane Rd N Horn Lake, MS | 2.0–3.0 | 2.0 | 1189 | $1,750 | $1.47 | 3d | 6 | 0.91mi |
| 7340 Durango Dr Horn Lake, MS | 3.0 | 2.0 | 1362 | $1,705 | $1.25 | 5d | 1 | 0.94mi |
| 2912 Waverly Dr Horn Lake, MS | 3.0 | 2.0 | 1366 | $1,793 | $1.31 | 5d | 1 | 0.94mi |
| 7202 Brenwood Dr Horn Lake, MS | 3.0 | 2.0 | 1490 | $1,705 | $1.14 | 22d | 1 | 0.98mi |
| 7341 Lee Ann Dr Horn Lake, MS | 3.0 | 2.0 | 1247 | $1,660 | $1.33 | 3d | 1 | 0.98mi |
| 2675 Ridgewood Cv Horn Lake, MS | 3.0 | 1.0 | 1035 | $1,195 | $1.15 | 24d | 1 | 0.98mi |
Listing history 6 events
-
2026-06-19status $120,000 Pending 3 DOM
-
2026-06-18days on market $120,000 Active 3 DOM
-
2026-06-17status $120,000 Active 2 DOM
-
2026-06-15statusdays on market $120,000 Pending 2 DOM
-
2026-06-13remarks 308-char remark
-
2026-06-13$120,000 Active 1 DOM
ⓘ Source: listings_history table (triggers on properties + properties_extension) + one-shot
backfill from property_details.listing_events for pre-trigger history.
Tax reassessment forecast MS · Resets to sale price
- Current annual tax
- $1,924 · $160/mo
- Projected year-2 tax
- $1,924 · $160/mo
- Expected delta
- $0/yr ($0/mo · 0.0%)
ⓘ Screening estimate from a state-policy table — verify with the county assessor before closing.
Climate risk First Street
- Flood 1/10 Low FEMA zone X (unshaded) · 0% chance over 30 yrs
- Wildfire 4/10 Moderate
- Heat 6/10 Major 7 d/yr ≥109°F today · 21 d/yr by 30 yrs out
- Wind 4/10 Moderate 18% chance of damaging wind over 30 yrs
- Air quality 2/10 Low 2 unhealthy d/yr today · 2 by 30 yrs out
Nearby sold comps map
Loading sold comps map…
Walkable amenities ~0.75 mi
Loading nearby amenities…
Taxation est. · year 1
- Rental income
- $19,458
- − Mortgage interest
- −$6,722
- − Property taxes
- −$1,924
- − Insurance
- −$600
- − Repairs & maintenance
- −$1,557
- − Management
- −$1,557
- − Depreciation
- −$3,491
- Taxable income
- $3,608
- Est. tax owed @ 24.0%
- −$866
- After-tax cash flow
- $4,430/yr
For passive investors: Depreciation is non-cash, so a rental often shows a tax loss while cash-flowing — sheltering income. Rental losses are passive: they offset passive income freely, and up to $25,000/yr can offset ordinary (W-2) income if you actively participate and your MAGI is under $100k (phasing out to $0 by $150k); unused losses carry forward. On sale, claimed depreciation is recaptured at up to 25%, and gains may owe capital-gains tax (a 1031 exchange can defer both). Figures are a year-1 estimate at your 24.0% rate — not tax advice; consult a CPA.
Schools (NCES district)
- District
- Desoto County School District
- NCES district ID
- 2801320
- Math proficiency
- 48% ▼ -13.00%
- Reading proficiency
- 42% ▼ -6.00%
- Median HH income
- $59,272
- Composite
- 39.56/100
- National rank
- #3933
- State rank
- #20 of 130 in MS
Livability — Horn Lake
- Score
- 61/100
- State rank
- #196
- US rank
- #17977
Category grades
Schools grade is shown separately in the Schools card above.
Census & demographics
- Census place
- Horn Lake, MS
- County
- DeSoto County · 176,513 people
- City population
- 26,647
- Metro
- Memphis, TN-MS-AR
- Population (ZIP)
- 26,647
- Household income
- $53,311
- Rent vs Own
- Severe rent burden
- 1052.0
Population outlook (DeSoto County) Hauer SSP2
- Today (2025)
- 203,338 people
- By 2030
- 217,692 · +7.1%
- By 2040
- 245,320 · +20.6%
- By 2050
- 270,133 · +32.8%
- By 2075
- 323,341 · +59.0%
- By 2100
- 348,742 · +71.5%
Race, ethnicity, and origin ACS 2023
- Neighborhood character
- Diverse neighborhood (Simpson 0.62)
- Race & ethnicity
- Black 44% White 42% Hispanic / Latino 9% Two or more races 5% Asian 1%
- Hispanic origin (detail)
- Mexican 7%
- Common ancestry
- Slovak 2% Lithuanian 1% Serbian 1%
- Foreign-born
- 7% · Canada
- Languages at home
- 91% English-only · Spanish 8%
Political lean MEDSL · DeSoto
- 2024 margin
- Strong R (+24.1) · D 36.7% · R 60.8% · Other 2.5%
- 2008→2024 swing
- +14.2pp toward D · 2008: -38.2pp · 2024: -24.1pp
- All cycles
- 2024: R+24.1 2020: R+23.9 2016: R+34.8 2012: R+33.5 2008: R+38.2
Not yet ingested
- Civics
- —
Market trends
- HPI YoY
- ▼ -32.08%
- Current HPI
- 206.5542
- Rent YoY
- ▼ -0.66%
- Metro
- Memphis, TN-MS-AR
- State GDP YoY
- —
- F500 in state
- 0
Price history
+84.6% since first listed4 events — show timeline
- 2026-06-12 Listed $120,000 MLSU
- 2003-07-10 Sold (Public Records) — Public Records
- 2003-06-12 Sold (MLS) — MLSU
- 2003-05-02 Listed $65,000 MLSU
Property tax history
+5.5%/yrLatest (2025): $1,924 · +15.3% YoY. Source: county tax records.
Cash-flow waterfall
monthlySold comps — $/sqft
last 12 mo · ≤1 miLoading sold comps…