135 Kiowa Trl · Lockhart, TX
Flood risk 1/10 · Minimal
- FEMA flood zone
- X (unshaded)
- Chance of flooding over 30 yrs
- 0.0%
- Est. flood insurance / yr
- $507 – $1,088
Fire risk 5/10 · Moderate
- Est. fire insurance / yr
- $1,222 – $2,270
Heat risk 8/10 · Major
- Hot days now (above 108°F)
- 7 days/yr
- Hot days in 30 yrs
- 22 days/yr
Wind risk 8/10 · Major
- Chance of severe wind over 30 yrs
- 80.0%
Air-quality risk 1/10 · Minimal
- Unhealthy air days now
- 0 days/yr
- Unhealthy air days in 30 yrs
- 0 days/yr
Risk factors via First Street. Map © Google.
Why this score? — see what drove the B- grade
The composite is a weighted blend of 9 inputs, each scored 0–100. Each bar is that input's sub-score; the figure is the points it added to the 100-point composite (weight × sub-score).
- Cash flow +30.0/30.0
- 1% rule +10.0/10.0
- DSCR +10.0/10.0
- ARV discount +7.5/15.0
- Livability +3.4/5.0
- Rent growth +2.5/5.0
- Condition / age +2.5/5.0
- Schools +2.4/10.0
- Appreciation +0.0/10.0
$75,000
🖨 Deal sheet (PDF) 📄 Offer letter ✓ Due diligence
Listing remarks MLS
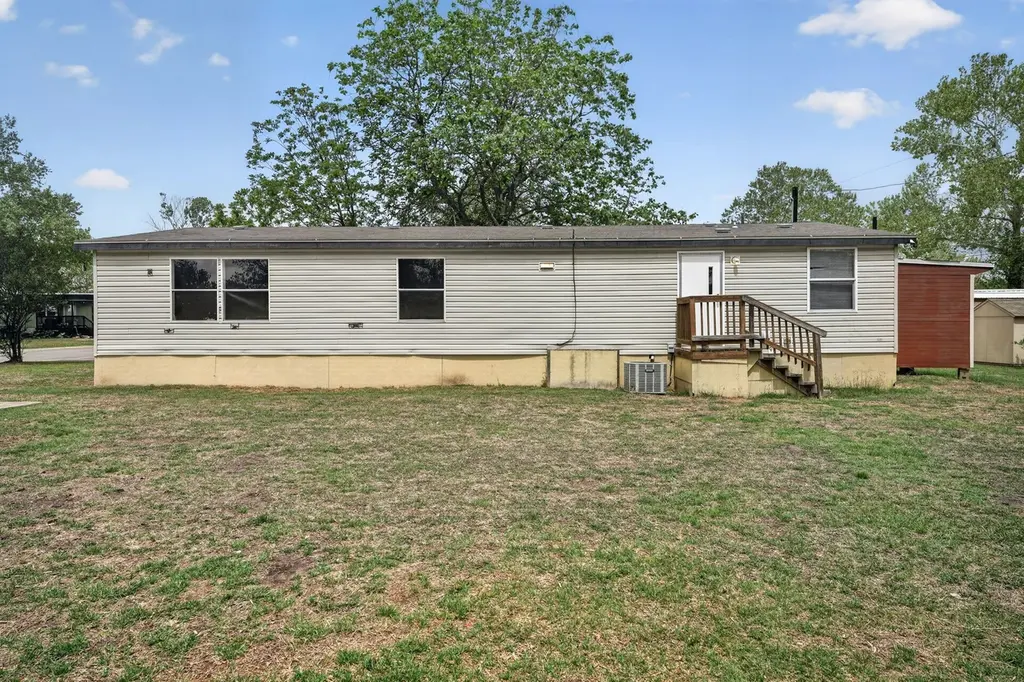
Discover the potential at 135 Kiowa Trl! This 1,568 sqft home in Lockhart ISD offers a spacious layout with a breakfast bar kitchen and primary suite garden tub. While it’s ready for some updates and personal touches, it serves as a fantastic value-add opportunity for your next project. Featuring city utilities and a level lot with existing decks, this property is a great canvas for those looking to build equity. Unlock the value today!
Key facts
- Existing decks
- Level lot
- Built 2012
Tags
Neighborhood map
What this means for you Summary
Snapshot
- This is a 4-bed/2.0-bath manufactured listed at $75k.
Deal economics
- At list price, monthly cash flow is $1k ($12k/yr) — positive.
- The deal already cash-flows at list — no discount required.
- Meets the 1% rule at list price ($2k rent vs $75k).
- Recommended offer: $73k (3.0% below list) — sets the bar for market timing.
- Cap rate 22.8% vs local median 3.0% in Lockhart — top-decile yield for the area; either an underpriced asset or a hidden risk that comps aren't pricing in. Stress-test before assuming the spread holds.
Location & tenants
- Location reads 67/100 on livability (#535 in TX) — a middle-class / working-renter tenant base. Strengths: cost of living A+, housing A+, crime B+; Watch: amenities F, commute F, health & safety F.
- Lockhart ISD (town): math 27% / reading 29% proficiency, ranked #657 of 826 in TX (top 80%) — low school quality limits family demand, transient renter base, plan for 1-2y turnover; 62% free/reduced lunch — lower-income household profile, screen leases tightly.
- Zoned schools: Navarro El (math 27% / reading 30%, grade F, #2,706 of 4,322 statewide, top 63%, 580 students, 72% FRL); Lockhart J H (math 22% / reading 26%, grade F, #1,301 of 1,662 statewide, top 79%, 1,433 students, 74% FRL); Lockhart H S (math 21% / reading 33%, grade F, #1,204 of 1,632 statewide, top 75%, 1,968 students, 69% FRL).
- Market conditions: 458 active listings in the ZIP; 20 comparable units currently listed for rent nearby; rentals lingering (median 45d on market — plan ~5-8 weeks vacancy on turnover, expect pricing pressure); 50% of comp listings sitting > 30 days — soft ceiling on asking rent; 529 units permitted in Caldwell County in 2024 (6 in 5+ unit buildings).
- This rent runs 30% of the median local income ($75k/yr) — at the standard rent-burdened threshold; future hikes will face affordability resistance.
Forward outlook
- Local home prices are declining (-3.0%/yr); year-one equity from $519 of loan paydown is wiped out by about $2k of value loss. Plan a longer hold.
- Caldwell County population projected at +33% by 2050 — long-run rental-demand tailwind backs the buy-and-hold thesis.
- At projected returns (-3.0% appreciation + 3.0% rent growth), your $21k cash investment doubles in ~2 years — after that, you're playing with house money.
Negotiation context
- It's been on market 57 days — a 3% lower offer ($73k) is reasonable based on typical stale-listing flexibility.
Risks & watch-outs
- Climate carrying-cost: severe wind risk, 80% chance of damaging wind over 30y; moderate wildfire risk; extreme-heat days projected 7→22/yr by 2055 (HVAC capex compounding) — expect insurance premiums to compound above CPI over the hold.
Questions for the listing agent
- It's been on market 57 days. Have you received any prior offers? Is the seller open to a 3% concession, seller financing, or rate buy-down credit?
- Is there a deadline driving the sale (1031 exchange, divorce, estate, relocation)? That informs how much negotiation room exists.
- Schools are D-rated, which usually means shorter tenancies and higher turnover. Who's the typical renter profile here, and what's been the actual vacancy rate?
- What's the average days-on-market for RENTAL listings here right now (not sales)? A rising rental-DOM trend means longer vacancies and softer asking-rent achievability than the comps imply.
- What's the recent tenant-quality profile in this submarket — average credit score on applications, eviction rate, late-payment / NSF rate, and stable-employment percentage? A property-management company in the area should have these aggregated.
- How much new for-sale + rental construction is in the pipeline within 1–3 miles? Heavy new supply typically softens prices + rents 12–24 months out; constrained supply supports both.
Investment metrics
- 1% rule
- 2.53% ✓
- Cap rate
- 22.80%
- Cash-on-cash
- 58.96%
- DSCR
- 3.62
- GRM
- 3.3
CMA / ARV
No comps found within radius.
Projected returns pro-forma
-3.0% appreciation · 3.0% rent growth · sell at horizon
- IRR
- 57.6%
- Equity multiple
- 3.55×
- Total profit
- $53,558
- Equity at exit
- $11,183
- IRR
- 62.5%
- Equity multiple
- 7.25×
- Total profit
- $131,243
- Equity at exit
- $6,485
Cash invested: $21,000 (down + closing). Projections, not guarantees.
Landlord ↔ Tenant lean methodology
- Overall (STATE)
- 87 Strongly Landlord-Friendly
- State Texas
- 87 Strongly Landlord-Friendly · R+5
- County
- — inherits STATE
- City
- — inherits STATE
ZIP-level market 78644
- Home prices YoY
- -29.4%
- Active inventory
- 458
- Price-to-rent
- 3.3×
Monthly cashflow live
- Estimated rent
- $1,897 high interval (Pro) →
- Mortgage (P&I)
- −$393
- Tax from tax record
- −$42 /mo · $507/yr
- Insurance
- −$31
- HOA
- −$0
- Vacancy / Maint / Mgmt
- −$398
- Net cashflow
- $1,032
Break-even live
Sensitivity live
| Price | -10% $1,074 | -5% $1,053 | +0% $1,032 | +5% $1,011 | +10% $989 |
|---|---|---|---|---|---|
| Rent | -10% $882 | -5% $957 | +0% $1,032 | +5% $1,107 | +10% $1,182 |
| Rate | -1.0pp $1,070 | -0.5pp $1,051 | base $1,032 | +0.5pp $1,012 | +1.0pp $993 |
UW: 25.0% down · 7.5% · 30yr · 1.5% tax · 5.0% vac · 8.0% maint · 8.0% mgmt
Financing live
Cash to close
- Down payment
- $18,750
- Closing costs
- $2,250
- Reserves months
- —
- Total cash needed
- —
Loan-product check · same deal, 3 products live
Conventional
25% down · 7.5% · 30yr
- Down + closing
- —
- Monthly P&I
- —
- Monthly cashflow
- —
- DSCR
- —
- Eligible?
- —
Personal DTI + credit; lowest rate.
DSCR
20% down · 8.5% · 30yr
- Down + closing
- —
- Monthly P&I
- —
- Monthly cashflow
- —
- DSCR
- —
- Eligible?
- —
No personal income docs; deal must DSCR.
Hard money
10% down · 12.0% · 12mo
- Down + closing
- —
- Monthly P&I
- —
- Monthly cashflow
- —
- DSCR
- —
- Eligible?
- —
Short-term bridge; refi at stabilization.
Rent comps 20 comps
| Address | Beds | Baths | Sqft | Rent | $/sqft | DOM | Units | Dist |
|---|---|---|---|---|---|---|---|---|
| 150 Tonkawa Trl Unit 150 Lockhart, TX | 3.0 | 2.0 | 1216 | $1,499 | $1.23 | 45d | 1 | 0.15mi |
| 606 Guadalimar St Lockhart, TX | 4.0 | 2.0 | 1036 | $1,700 | $1.64 | 45d | 1 | 0.43mi |
| 1100 Monte Vista Dr Lockhart, TX | 3.0 | 2.0 | 1154 | $1,850 | $1.60 | 19d | 1 | 0.47mi |
| 1309 Monte Vista Dr Lockhart, TX | 3.0 | 2.0 | 1349 | $1,550 | $1.15 | 45d | 1 | 0.62mi |
| 1207 Camden Ln Lockhart, TX | 4.0 | 2.0 | 1544 | $1,799 | $1.17 | 16d | 1 | 0.97mi |
| 210 Addison Pl Lockhart, TX | 4.0 | 2.0 | 1542 | $1,845 | $1.20 | 45d | 1 | 0.97mi |
| 100 N Brazos St Lockhart, TX | 3.0 | 1.0 | 1299 | $1,600 | $1.23 | 25d | 1 | 1.02mi |
| 1327 Camden Ln Lockhart, TX | 4.0 | 2.0 | 1778 | $1,950 | $1.10 | 46d | 1 | 1.09mi |
| 117 Quail Cv Unit A Lockhart, TX | 3.0 | 2.0 | 1250 | $1,575 | $1.26 | 19d | 1 | 1.12mi |
| 1337 Camden Ln Lockhart, TX | 4.0 | 2.0 | 1544 | $1,800 | $1.17 | 25d | 1 | 1.16mi |
| 1314 Prescott Pl Lockhart, TX | 4.0 | 2.0 | 1780 | $2,190 | $1.23 | 45d | 1 | 1.18mi |
| 331 N Richland Dr Lockhart, TX | 3.0 | 2.0 | 1281 | $1,800 | $1.41 | 45d | 1 | 1.24mi |
| 1702 Miller Ter Lockhart, TX | 3.0 | 2.0 | 1253 | $1,895 | $1.51 | 45d | 1 | 1.26mi |
| 413 Abbey Ln Lockhart, TX | 3.0 | 2.0 | 1297 | $1,750 | $1.35 | 25d | 1 | 1.27mi |
| 221 Wirecrested Dr Lockhart, TX | 4.0 | 2.5 | 1816 | $2,190 | $1.21 | 0d | 1 | 1.30mi |
| 305 Wirecrested Dr Lockhart, TX | 4.0 | 2.5 | 1816 | $2,190 | $1.21 | 6d | 1 | 1.31mi |
| 903 E Live Oak St Unit B Lockhart, TX | 3.0 | 1.0 | 1200 | $1,450 | $1.21 | 45d | 1 | 1.33mi |
| 1712 W San Antonio St Lockhart, TX | 3.0 | 2.5 | 1575 | $1,710 | $1.09 | 0d | 6 | 1.40mi |
| 750 S Main St Lockhart, TX | 3.0 | 2.0 | 1377 | $1,850 | $1.34 | 45d | 1 | 1.42mi |
| 543 Christopher Cv Lockhart, TX | 3.0 | 2.0 | 1830 | $2,000 | $1.09 | 12d | 1 | 1.49mi |
Listing history 11 events
-
2026-06-09days on market $75,000 Active 57 DOM
-
2026-06-08days on market $75,000 Active 56 DOM
-
2026-06-07days on market $75,000 Active 55 DOM
-
2026-06-04days on market $75,000 Active 52 DOM
-
2026-06-03days on market $75,000 Active 51 DOM
-
2026-06-02days on market $75,000 Active 50 DOM
-
2026-06-01days on market $75,000 Active 49 DOM
-
2026-05-31days on market $75,000 Active 48 DOM
-
2026-04-29price $75,000 446-char remark
Show marketing remark (446 chars)
Discover the potential at 135 Kiowa Trl! This 1,568 sqft home in Lockhart ISD offers a spacious layout with a breakfast bar kitchen and primary suite garden tub. While it’s ready for some updates and personal touches, it serves as a fantastic value-add opportunity for your next project. Featuring city utilities and a level lot with existing decks, this property is a great canvas for those looking to build equity. Unlock the value today!
-
2026-04-22price $85,000 446-char remark
Show marketing remark (446 chars)
Discover the potential at 135 Kiowa Trl! This 1,568 sqft home in Lockhart ISD offers a spacious layout with a breakfast bar kitchen and primary suite garden tub. While it’s ready for some updates and personal touches, it serves as a fantastic value-add opportunity for your next project. Featuring city utilities and a level lot with existing decks, this property is a great canvas for those looking to build equity. Unlock the value today!
-
2026-04-10$90,000 Active 446-char remark
Show marketing remark (446 chars)
Discover the potential at 135 Kiowa Trl! This 1,568 sqft home in Lockhart ISD offers a spacious layout with a breakfast bar kitchen and primary suite garden tub. While it’s ready for some updates and personal touches, it serves as a fantastic value-add opportunity for your next project. Featuring city utilities and a level lot with existing decks, this property is a great canvas for those looking to build equity. Unlock the value today!
ⓘ Source: listings_history table (triggers on properties + properties_extension) + one-shot
backfill from property_details.listing_events for pre-trigger history.
Tax reassessment forecast TX · Resets to sale price
- Current annual tax
- $507 · $42/mo
- Projected year-2 tax
- $1,372 · $114/mo
- Expected delta
- +$865/yr (+$72/mo · 170.6%)
ⓘ Screening estimate from a state-policy table — verify with the county assessor before closing.
Climate risk First Street
- Flood 1/10 Low FEMA zone X (unshaded) · 0% chance over 30 yrs
- Wildfire 5/10 Major
- Heat 8/10 Severe 7 d/yr ≥108°F today · 22 d/yr by 30 yrs out
- Wind 8/10 Severe 80% chance of damaging wind over 30 yrs
- Air quality 1/10 Low 0 unhealthy d/yr today · 0 by 30 yrs out
Nearby sold comps map
Loading sold comps map…
Walkable amenities ~0.75 mi
Loading nearby amenities…
Taxation est. · year 1
- Rental income
- $22,764
- − Mortgage interest
- −$4,201
- − Property taxes
- −$507
- − Insurance
- −$375
- − Repairs & maintenance
- −$1,821
- − Management
- −$1,821
- − Depreciation
- −$2,182
- Taxable income
- $11,856
- Est. tax owed @ 24.0%
- −$2,845
- After-tax cash flow
- $9,536/yr
For passive investors: Depreciation is non-cash, so a rental often shows a tax loss while cash-flowing — sheltering income. Rental losses are passive: they offset passive income freely, and up to $25,000/yr can offset ordinary (W-2) income if you actively participate and your MAGI is under $100k (phasing out to $0 by $150k); unused losses carry forward. On sale, claimed depreciation is recaptured at up to 25%, and gains may owe capital-gains tax (a 1031 exchange can defer both). Figures are a year-1 estimate at your 24.0% rate — not tax advice; consult a CPA.
Schools (NCES district)
- District
- Lockhart ISD
- NCES district ID
- 4827870
- Math proficiency
- 27% ▼ -12.00%
- Reading proficiency
- 29% ▼ -2.00%
- Median HH income
- $48,868
- Composite
- 24.44/100
- National rank
- #7674
- State rank
- #657 of 826 in TX
Livability — Lockhart
- Score
- 67/100
- State rank
- #535
- US rank
- #10453
Category grades
Schools grade is shown separately in the Schools card above.
Census & demographics
- Census place
- Lockhart, TX
- County
- Caldwell County · 25,195 people
- City population
- 22,348
- Metro
- Austin-Round Rock-Georgetown, TX
- Population (ZIP)
- 22,348
- Household income
- $74,709
- Rent vs Own
- Severe rent burden
- 324.0
Population outlook (Caldwell County) Hauer SSP2
- Today (2025)
- 46,557 people
- By 2030
- 49,673 · +6.7%
- By 2040
- 55,827 · +19.9%
- By 2050
- 61,832 · +32.8%
- By 2075
- 77,212 · +65.8%
- By 2100
- 89,225 · +91.6%
Race, ethnicity, and origin ACS 2023
- Neighborhood character
- Diverse neighborhood (Simpson 0.57)
- Race & ethnicity
- Hispanic / Latino 52% White 39% Two or more races 23% Black 4% Asian 1%
- Hispanic origin (detail)
- Mexican 45% Puerto Rican 2%
- Common ancestry
- Italian 1% Lithuanian 1% Serbian 1%
- Foreign-born
- 9% · Canada
- Languages at home
- 67% English-only · Spanish 32%
Political lean MEDSL · Caldwell
- 2024 margin
- R (+14.4) · D 42.2% · R 56.6% · Other 1.2%
- 2008→2024 swing
- -8.4pp toward R · 2008: -6.0pp · 2024: -14.4pp
- All cycles
- 2024: R+14.4 2020: R+9.1 2016: R+15.8 2012: R+11.1 2008: R+6.0
Not yet ingested
- Civics
- —
Market trends
- HPI YoY
- ▼ -99.62%
- Current HPI
- 239.7906
- Rent YoY
- —
- Metro
- Austin-Round Rock-Georgetown, TX
- State GDP YoY
- ▲ 3.95%
- F500 in state
- 110
Industry mix (Fortune 500 HQ in TX)
| Industry | F500 HQs | Revenue |
|---|---|---|
| Energy | 16 | $1,198B |
|
||
| Technology | 5 | $198B |
|
||
| Engineering / Construction | 4 | $72B |
|
||
| Energy Services | 3 | $60B |
|
||
| Utilities | 3 | $41B |
|
||
| Healthcare | 2 | $330B |
|
||
Price history
-16.7% since first listed3 events — show timeline
- 2026-04-29 Price Changed $75,000 HARMLS
- 2026-04-22 Price Changed $85,000 HARMLS
- 2026-04-10 Listed $90,000 HARMLS
Cash-flow waterfall
monthlySold comps — $/sqft
last 12 mo · ≤1 miLoading sold comps…