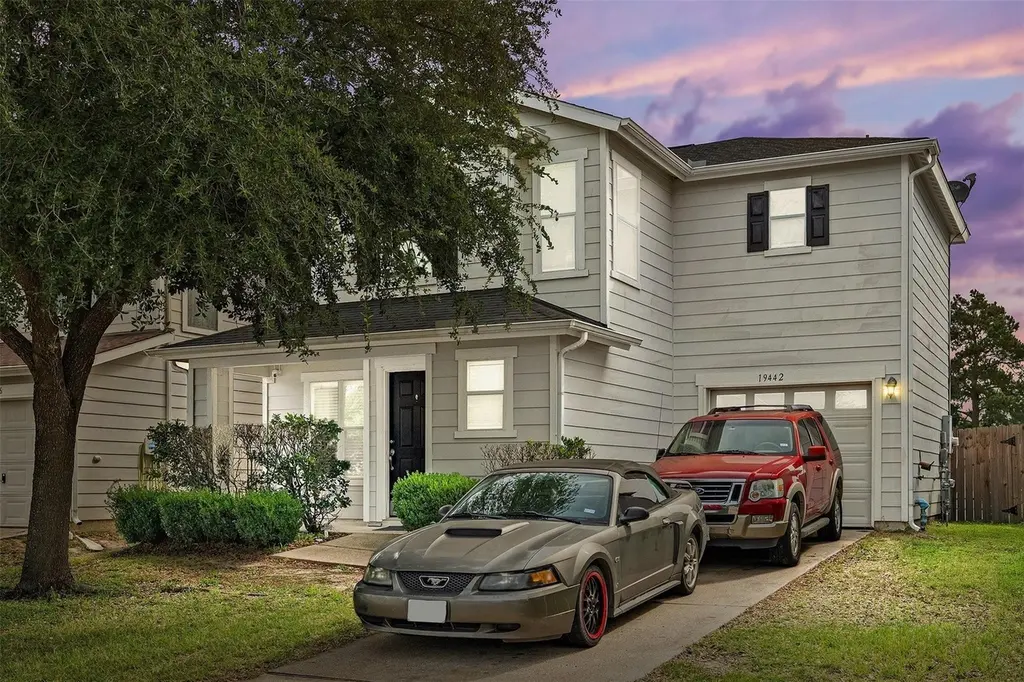
19442 Bold River Rd · Houston, TX
Flood risk 1/10 · Minimal
- FEMA flood zone
- X (unshaded)
- Chance of flooding over 30 yrs
- 0.0%
- Est. flood insurance / yr
- $507 – $1,088
Fire risk 3/10 · Minor
- Est. fire insurance / yr
- $1,222 – $2,270
Heat risk 9/10 · Severe
- Hot days now (above 110°F)
- 7 days/yr
- Hot days in 30 yrs
- 23 days/yr
Wind risk 8/10 · Major
- Chance of severe wind over 30 yrs
- 99.0%
Air-quality risk 3/10 · Minor
- Unhealthy air days now
- 2 days/yr
- Unhealthy air days in 30 yrs
- 3 days/yr
Risk factors via First Street. Map © Google.
Why this score? — see what drove the D grade
The composite is a weighted blend of 9 inputs, each scored 0–100. Each bar is that input's sub-score; the figure is the points it added to the 100-point composite (weight × sub-score).
- ARV discount +11.4/15.0
- Cash flow +9.6/30.0
- Schools +4.1/10.0
- 1% rule +4.0/10.0
- Livability +3.7/5.0
- DSCR +2.7/10.0
- Condition / age +2.5/5.0
- Rent growth +2.4/5.0
- Appreciation +0.0/10.0
$219,900
🖨 Deal sheet (PDF) 📄 Offer letter ✓ Due diligence
Listing remarks
Charming two-story home perfectly located in the nice Northern Point neighborhood. Well maintained home features 3 bedrooms up, half bath down, and two full baths up. Main floor has an open design, connecting the large living area to the kitchen and breakfast area. Kitchen has a breakfast bar, abundance of cabinets, plenty of counter space. Enjoy the large fenced in back yard with no neighbors for your privacy. Please call agent to schedule an appointment.
Key facts
- Open design
- Breakfast bar
- 4,199 sq ft lot
Tags
Property features AI
Finance
- Other: Seller disclosure available
- HOA & community: Homeowners association: Northern Point/Chaparral MGT; Annual association fee of $400
Exterior
- Parking: Attached garage (2 spaces)
- Utilities: Public water; Public sewer
- Home design: Residential property; Built in 2007; Slab foundation; Composition roof
- Construction: Brick and cement siding construction
- Exterior features: Subdivision lot; Concrete road access
Interior
- Kitchen: Dishwasher; Disposal; Microwave; Kitchen on first level (11 x 9)
- Bedrooms: Primary bedroom on second level (13 x 12); Two additional bedrooms on second level (each 10 x 10)
- Bathrooms: Two full bathrooms; One half bathroom
- Heating & cooling: Central heating (gas); Central air conditioning (electric)
- Interior features: Primary bedroom with private bath; 5 total rooms
Neighborhood map
What this means for you Summary
Snapshot
- This is a 3-bed/2.5-bath single-family listed at $220k.
Deal economics
- At list price, monthly cash flow is $-148 ($-2k/yr) — negative.
- To cash-flow at today's rent, offer at most $194k (11.9% below list).
- To meet the 1% rule (rent ≥ 1% of price), the offer needs to be $199k (9.7% below list).
- Recommended offer: $194k (11.9% below list) — sets the bar for cash-flow.
- Cap rate 5.5% vs local median 3.2% in Houston — top-decile yield for the area; either an underpriced asset or a hidden risk that comps aren't pricing in. Stress-test before assuming the spread holds.
Location & tenants
- Location reads 74/100 on livability (#184 in TX, #4,771 nationally) — a middle-class / working-renter tenant base. Strengths: amenities A+, cost of living A+, housing A+; Watch: crime F.
- Klein ISD (suburban): math 41% / reading 48% proficiency, ranked #213 of 826 in TX (top 26%) — families likely to look elsewhere, expect single-tenant / working-renter base with shorter leases.
- Zoned schools: Kohrville El (math 34% / reading 40%, grade F, #1,769 of 4,322 statewide, top 44%, 736 students, 64% FRL); Ulrich Int (math 39% / reading 47%, grade D-, #540 of 1,662 statewide, top 33%, 1,262 students, 58% FRL); Klein H S (math 58% / reading 67%, grade B-, #234 of 1,632 statewide, top 14%, 3,352 students, 45% FRL) — zoned schools average 56% FRL vs 37% district-wide (19 pts higher); higher-poverty schools than district average — tighter screening recommended.
- Market conditions: Rents soft (-0.5%/yr); 666 active listings in the ZIP; 19 comparable units currently listed for rent nearby; rentals at typical pace (median 14d on market — plan ~3-4 weeks tenant-placement turnaround); solid renter incomes; 29,883 units permitted in Harris County in 2024 (8,621 in 5+ unit buildings).
Forward outlook
- Local home prices are declining (-3.0%/yr); year-one equity from $2k of loan paydown is wiped out by about $7k of value loss. Plan a longer hold.
- Harris County population projected at +47% by 2050 — long-run rental-demand tailwind backs the buy-and-hold thesis.
Negotiation context
- Only 2 days on market — expect competitive offers; lowballing is unlikely to land.
- 8 sale attempts since 15y ago with the ask held roughly flat each time — persistent listings suggest the price (not the market) is what's stuck; bring a comps-based counter.
Risks & watch-outs
- Climate carrying-cost: severe wind risk, 99% chance of damaging wind over 30y; extreme-heat days projected 7→23/yr by 2055 (HVAC capex compounding) — expect insurance premiums to compound above CPI over the hold.
Questions for the listing agent
- What do current leases actually rent for vs. the listed asking? Can we see a recent rent roll and the last 12 months of T-12 income?
- What does the HOA fee cover, when was the last increase, and are there any pending special assessments or reserve-fund shortfalls?
- Is there a deadline driving the sale (1031 exchange, divorce, estate, relocation)? That informs how much negotiation room exists.
- Schools are D-rated, which usually means shorter tenancies and higher turnover. Who's the typical renter profile here, and what's been the actual vacancy rate?
- Crime grade is F in this area — have there been break-ins, vandalism, or insurance claims at this property in the last 3 years? What carrier currently insures it and at what premium?
- The area grade is low — what's the realistic commute time and amenity access for the typical tenant pool here? Any planned neighborhood developments (good or bad) we should know about?
- What's the average days-on-market for RENTAL listings here right now (not sales)? A rising rental-DOM trend means longer vacancies and softer asking-rent achievability than the comps imply.
- What's the recent tenant-quality profile in this submarket — average credit score on applications, eviction rate, late-payment / NSF rate, and stable-employment percentage? A property-management company in the area should have these aggregated.
- How much new for-sale + rental construction is in the pipeline within 1–3 miles? Heavy new supply typically softens prices + rents 12–24 months out; constrained supply supports both.
Investment metrics
- 1% rule
- 0.90% ✗
- Cap rate
- 5.49%
- Cash-on-cash
- -2.88%
- DSCR
- 0.87
- GRM
- 9.2
CMA / ARV
- ARV (on-the-fly)
- $240,894
- Comps found
- 12
Show comp detail 12 sales within ~0.75 mi
| Address | Dist | Beds/Ba | Sqft | Sold | Price | $/sf | Match |
|---|---|---|---|---|---|---|---|
| 11338 Log Cabin Ln | 0.15mi | 3/2.5 | 1,480 (-0%) | 2mo | $240,000 | $162 | 91 |
| 11202 Log Cabin Ln | 0.08mi | 3/2.0 | 1,440 (-3%) | 2mo | $230,000 | $160 | 88 |
| 19711 Twin Rivers Dr | 0.47mi | 3/2.0 | 1,494 (+0%) | 0mo | $235,000 | $157 | 75 |
| 11214 Kingsnorth Dr | 0.41mi | 3/2.0 | 1,390 (-6%) | 2mo | $275,000 | $198 | 66 |
| 11003 Harston Dr | 0.43mi | 3/2.0 | 1,411 (-5%) | 5mo | $240,000 | $170 | 65 |
| 19718 Moose Cove Ct | 0.33mi | 3/2.0 | 1,670 (+12%) | 0mo | $249,900 | $150 | 62 |
| 10834 Elgar Ln | 0.45mi | 3/2.0 | 1,335 (-10%) | 8mo | $245,000 | $184 | 54 |
| 19002 Ayston Dr | 0.52mi | 3/2.0 | 1,633 (+10%) | 7mo | $240,000 | $147 | 52 |
| 19815 Rocky Shores Dr | 0.54mi | 3/2.0 | 1,677 (+13%) | 1mo | $260,000 | $155 | 51 |
| 19235 Tannach Dr | 0.71mi | 4/2.5 (+1) | 1,628 (+10%) | 0mo | $295,000 | $181 | 46 |
| 11714 Sunny Stream Dr | 0.57mi | 4/2.5 (+1) | 1,678 (+13%) | 2mo | $239,900 | $143 | 45 |
| 19019 Wellock Ln | 0.59mi | 3/2.0 | 1,288 (-13%) | 4mo | $248,000 | $193 | 45 |
Match score weights: distance 35% · size 25% · config 20% · recency 20%. Top-matched comps best support the ARV.
Projected returns pro-forma
-3.0% appreciation · 0.0% rent growth · sell at horizon
- IRR
- -24.9%
- Equity multiple
- 0.18×
- Total profit
- $-50,701
- Equity at exit
- $32,788
- IRR
- -36.0%
- Equity multiple
- -0.27×
- Total profit
- $-78,134
- Equity at exit
- $19,013
Cash invested: $61,572 (down + closing). Projections, not guarantees.
Landlord ↔ Tenant lean methodology
- Overall (STATE)
- 87 Strongly Landlord-Friendly
- State Texas
- 87 Strongly Landlord-Friendly · R+5
- County
- — inherits STATE
- City
- — inherits STATE
ZIP-level market 77375
- Home prices YoY
- -33.9%
- Rents YoY
- -0.5%
- Active inventory
- 666
- Price-to-rent
- 9.2×
Monthly cashflow live
- Estimated rent
- $1,986 high interval (Pro) →
- Mortgage (P&I)
- −$1,153
- Tax from tax record
- −$439 /mo · $5,268/yr
- Insurance
- −$92
- HOA
- −$33
- Vacancy / Maint / Mgmt
- −$417
- Net cashflow
- $-148
Break-even live
Sensitivity live
| Price | -10% $-23 | -5% $-85 | +0% $-148 | +5% $-210 | +10% $-272 |
|---|---|---|---|---|---|
| Rent | -10% $-304 | -5% $-226 | +0% $-148 | +5% $-69 | +10% $9 |
| Rate | -1.0pp $-37 | -0.5pp $-92 | base $-148 | +0.5pp $-205 | +1.0pp $-263 |
UW: 25.0% down · 7.5% · 30yr · 1.5% tax · 5.0% vac · 8.0% maint · 8.0% mgmt
Financing live
Cash to close
- Down payment
- $54,975
- Closing costs
- $6,597
- Reserves months
- —
- Total cash needed
- —
Loan-product check · same deal, 3 products live
Conventional
25% down · 7.5% · 30yr
- Down + closing
- —
- Monthly P&I
- —
- Monthly cashflow
- —
- DSCR
- —
- Eligible?
- —
Personal DTI + credit; lowest rate.
DSCR
20% down · 8.5% · 30yr
- Down + closing
- —
- Monthly P&I
- —
- Monthly cashflow
- —
- DSCR
- —
- Eligible?
- —
No personal income docs; deal must DSCR.
Hard money
10% down · 12.0% · 12mo
- Down + closing
- —
- Monthly P&I
- —
- Monthly cashflow
- —
- DSCR
- —
- Eligible?
- —
Short-term bridge; refi at stabilization.
Rent comps 19 comps
| Address | Beds | Baths | Sqft | Rent | $/sqft | DOM | Units | Dist |
|---|---|---|---|---|---|---|---|---|
| 11114 Kingsnorth Dr Tomball, TX | 3.0 | 2.0 | 1620 | $1,869 | $1.15 | 9d | 1 | 0.39mi |
| 19414 Ambrosia Falls Dr Tomball, TX | 3.0 | 2.0 | 1344 | $1,695 | $1.26 | 26d | 1 | 0.44mi |
| 10921 Boudreaux Rd Tomball, TX | 1.0–3.0 | 1.0–2.0 | 1088 | $1,980 | $1.82 | 0d | 39 | 0.52mi |
| 11706 Sardis Lake Dr Unit 1570350P Tomball, TX | 3.0 | 2.0 | 1194 | $5,540 | $4.64 | 4d | 1 | 0.58mi |
| 11201 Boudreaux Cir Tomball, TX | 1.0–3.0 | 1.0–2.0 | 1069 | $1,799 | $1.68 | 45d | 1 | 0.59mi |
| 11811 Sunny Stream Dr Tomball, TX | 3.0 | 2.5 | 1740 | $1,785 | $1.03 | 45d | 1 | 0.64mi |
| 11411 Edmond Thorpe Ln Tomball, TX | 3.0 | 2.0 | 1347 | $2,750 | $2.04 | 45d | 1 | 0.67mi |
| 11810 Rolling Stream Dr Tomball, TX | 3.0 | 2.5 | 1590 | $1,700 | $1.07 | 18d | 1 | 0.67mi |
| 21035 Sweet Blossom Ln Tomball, TX | 4.0 | 2.0 | 1722 | $1,796 | $1.04 | 45d | 1 | 1.37mi |
| 9123 Crescent Clover Dr Unit 3174 Spring, TX | 3.0 | 2.0 | 1420 | $2,157 | $1.52 | 0d | 1 | 1.39mi |
| 9123 Crescent Clover Dr Unit 9146 Spring, TX | 2.0 | 2.0 | 1105 | $1,842 | $1.67 | 0d | 1 | 1.39mi |
| 9123 Crescent Clover Dr Unit 9180 Spring, TX | 2.0 | 2.0 | 1097 | $1,556 | $1.42 | 14d | 1 | 1.39mi |
| 9123 Crescent Clover Dr Unit 9160 Spring, TX | 2.0 | 2.0 | 1097 | $1,647 | $1.50 | 45d | 1 | 1.39mi |
| 9123 Crescent Clover Dr Unit 3228 Spring, TX | 3.0 | 2.0 | 1420 | $2,106 | $1.48 | 0d | 1 | 1.39mi |
| 9123 Crescent Clover Dr Unit 9156 Spring, TX | 3.0 | 2.0 | 1420 | $2,157 | $1.52 | 14d | 1 | 1.39mi |
| 9123 Crescent Clover Dr Unit 2228 Spring, TX | 2.0 | 2.0 | 1105 | $1,883 | $1.70 | 0d | 1 | 1.39mi |
| 9123 Crescent Clover Dr Unit 424 Spring, TX | 2.0 | 2.0 | 1105 | $1,858 | $1.68 | 9d | 1 | 1.39mi |
| 9123 Crescent Clover Dr Unit 2162 Spring, TX | 2.0 | 2.0 | 1105 | $1,858 | $1.68 | 7d | 1 | 1.39mi |
| 10215 Berry Hill Ln Tomball, TX | 3.0 | 2.0 | 1619 | $1,850 | $1.14 | 45d | 1 | 1.45mi |
HOA detail
- Monthly dues
- $33 · $396/yr
Listing history 2 events
-
2026-06-21remarks 460-char remark
-
2026-06-21$219,900 Active 2 DOM
ⓘ Source: listings_history table (triggers on properties + properties_extension) + one-shot
backfill from property_details.listing_events for pre-trigger history.
Tax reassessment forecast TX · Resets to sale price
- Current annual tax
- $5,268 · $439/mo
- Projected year-2 tax
- $5,268 · $439/mo
- Expected delta
- $0/yr ($0/mo · 0.0%)
ⓘ Screening estimate from a state-policy table — verify with the county assessor before closing.
Climate risk First Street
- Flood 1/10 Low FEMA zone X (unshaded) · 0% chance over 30 yrs
- Wildfire 3/10 Moderate
- Heat 9/10 Extreme 7 d/yr ≥110°F today · 23 d/yr by 30 yrs out
- Wind 8/10 Severe 99% chance of damaging wind over 30 yrs
- Air quality 3/10 Moderate 2 unhealthy d/yr today · 3 by 30 yrs out
Nearby sold comps map
Loading sold comps map…
Walkable amenities ~0.75 mi
Loading nearby amenities…
Taxation est. · year 1
- Rental income
- $23,837
- − Mortgage interest
- −$12,318
- − Property taxes
- −$5,268
- − Insurance
- −$1,100
- − Repairs & maintenance
- −$1,907
- − Management
- −$1,907
- − HOA
- −$396
- − Depreciation
- −$6,397
- Taxable loss
- −$5,456
- Est. tax savings @ 24.0%
- +$1,309
- After-tax cash flow
- $-461/yr
For passive investors: Depreciation is non-cash, so a rental often shows a tax loss while cash-flowing — sheltering income. Rental losses are passive: they offset passive income freely, and up to $25,000/yr can offset ordinary (W-2) income if you actively participate and your MAGI is under $100k (phasing out to $0 by $150k); unused losses carry forward. On sale, claimed depreciation is recaptured at up to 25%, and gains may owe capital-gains tax (a 1031 exchange can defer both). Figures are a year-1 estimate at your 24.0% rate — not tax advice; consult a CPA.
Schools (NCES district)
- District
- Klein ISD
- NCES district ID
- 4825740
- Math proficiency
- 41% ▼ -12.00%
- Reading proficiency
- 48% ▼ -3.00%
- Median HH income
- $78,288
- Composite
- 40.91/100
- National rank
- #3615
- State rank
- #213 of 826 in TX
Livability — Houston
- Score
- 74/100
- State rank
- #184
- US rank
- #4771
Category grades
Schools grade is shown separately in the Schools card above.
Census & demographics
- County
- Harris County · 4,702,590 people
- City population
- 3,226,434
- Metro
- Houston-The Woodlands-Sugar Land, TX
- Population (ZIP)
- 72,311
- Household income
- $102,488
- Rent vs Own
- Severe rent burden
- 1803.0
Population outlook (Harris County) Hauer SSP2
- Today (2025)
- 5,571,493 people
- By 2030
- 6,089,821 · +9.3%
- By 2040
- 7,142,806 · +28.2%
- By 2050
- 8,185,864 · +46.9%
- By 2075
- 10,574,329 · +89.8%
- By 2100
- 12,109,958 · +117.4%
Race, ethnicity, and origin ACS 2023
- Neighborhood character
- Diverse neighborhood (Simpson 0.65)
- Race & ethnicity
- White 48% Hispanic / Latino 33% Two or more races 13% Black 10% Asian 6% Native American 2%
- Hispanic origin (detail)
- Mexican 23%
- Common ancestry
- Italian 2% Lithuanian 2% Slovak 2%
- Foreign-born
- 17% · Canada, Vietnam, Jamaica
- Languages at home
- 72% English-only · Spanish 22% Other Indo-European 2% Vietnamese 2%
Political lean MEDSL · Harris
- 2024 margin
- Lean D (+5.5) · D 52.0% · R 46.4% · Other 1.6%
- 2008→2024 swing
- +3.9pp toward D · 2008: 1.6pp · 2024: 5.5pp
- All cycles
- 2024: D+5.5 2020: D+13.3 2016: D+12.4 2012: D+0.1 2008: D+1.6
Not yet ingested
- Civics
- —
Market trends
- HPI YoY
- ▼ -119.81%
- Current HPI
- 233.6155
- Rent YoY
- ▼ -0.49%
- Metro
- Houston-The Woodlands-Sugar Land, TX
- State GDP YoY
- ▲ 3.95%
- F500 in state
- 110
Industry mix (Fortune 500 HQ in TX)
| Industry | F500 HQs | Revenue |
|---|---|---|
| Energy | 16 | $1,198B |
|
||
| Technology | 5 | $198B |
|
||
| Engineering / Construction | 4 | $72B |
|
||
| Energy Services | 3 | $60B |
|
||
| Utilities | 3 | $41B |
|
||
| Healthcare | 2 | $330B |
|
||
Price history
+109.4% since first listed22 events — show timeline
- 2026-06-19 Listed $219,900 HARMLS
- 2026-04-16 Listing Removed — HARMLS
- 2026-03-21 Price Changed $219,900 HARMLS
- 2026-03-04 Listed $239,000 HARMLS
- 2025-11-14 Listing Removed — HARMLS
- 2025-06-17 Price Changed $240,000 HARMLS
- 2025-05-16 Listed $245,000 HARMLS
- 2023-08-09 Rental Removed $1,899 HARMLS
- 2023-08-02 Price Changed $1,899 HARMLS
- 2023-07-27 Listed for Rent $2,000 HARMLS
- 2014-04-21 Listing Removed — HARMLS
- 2014-04-16 Sold (MLS) — HARMLS
- 2014-04-04 Pending — HARMLS
- 2014-03-28 Listed $111,000 HARMLS
- 2014-02-20 Listing Removed — HARMLS
- 2014-02-05 Listed $111,000 HARMLS
- 2012-12-23 Pending — HARMLS
- 2012-12-21 Sold (MLS) — HARMLS
- 2012-12-14 Pending — HARMLS
- 2012-05-02 Listed $89,500 HARMLS
- 2012-04-28 Listing Removed — HARMLS
- 2011-11-10 Listed $105,000 HARMLS
Property tax history
+2.3%/yrLatest (2025): $5,268 · +2.4% YoY. Source: county tax records.
Cash-flow waterfall
monthlySold comps — $/sqft
last 12 mo · ≤1 miLoading sold comps…