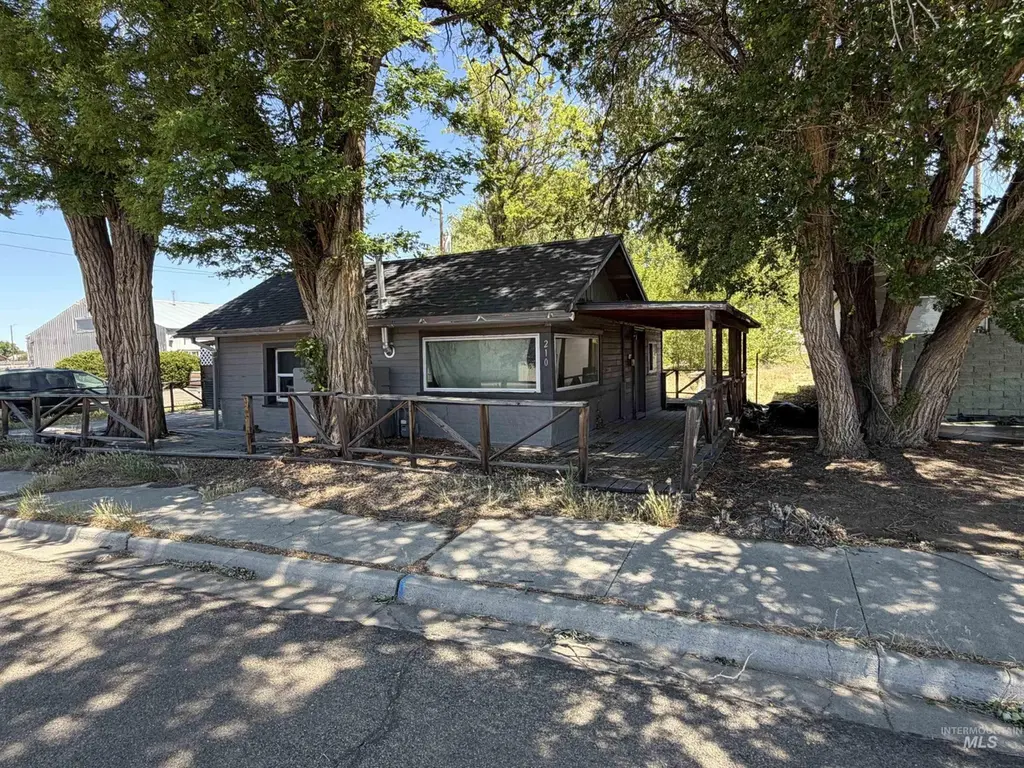
210 S 3 West · Mountain Home, ID
Flood risk No data
- FEMA flood zone
- —
- Chance of flooding over 30 yrs
- —
- Est. flood insurance / yr
- —
Fire risk No data
- Est. fire insurance / yr
- —
Heat risk No data
- Hot days now (above threshold)
- —
- Hot days in 30 yrs
- —
Wind risk No data
- Chance of severe wind over 30 yrs
- —
Air-quality risk No data
- Unhealthy air days now
- —
- Unhealthy air days in 30 yrs
- —
Risk factors via First Street. Map © Google.
Why this score? — see what drove the C- grade
The composite is a weighted blend of 9 inputs, each scored 0–100. Each bar is that input's sub-score; the figure is the points it added to the 100-point composite (weight × sub-score).
- Cash flow +18.8/30.0
- ARV discount +7.5/15.0
- DSCR +5.9/10.0
- 1% rule +4.4/10.0
- Rent growth +4.1/5.0
- Livability +3.8/5.0
- Schools +3.1/10.0
- Condition / age +2.5/5.0
- Appreciation +0.0/10.0
$140,000
🖨 Deal sheet 📄 Offer letter ✓ Due diligence
Listing remarks
GREAT LITTLE HOUSE IN TOWN WITH GARAGE AND SHED. SELLER WILL NEED 24 HOURS FOR SHOWINGS. HOUSE HAS BEEN RENTED TO SAME GENTLEMAN FOR 10 YEARS. HE IS WILLING TO STAY IF THAT IS AN OPTION. MOTIVATED SELLER. SALE TO BE "AS IS"
Key facts
- 3,484 sq ft lot
- Garage
- Built 1930
Property features AI
Finance
- Other: Public paved road frontage
- Financial info: Was not specified
- HOA & community: Subdivision: South Add Mh
Exterior
- Parking: Detached garage (1 car) — garage approx. 25 x 14; 1 covered parking space
- Security: Was not specified
- Utilities: City water service; Sewer connected
- Home design: Single-family residence; Built in 1930
- Construction: Frame construction
- Exterior features: Composition roof; Small lot with garden and dog run; Corner lot; Manual sprinkler system
Interior
- Kitchen: Oven/range (freestanding); Refrigerator
- Bedrooms: 2 bedrooms — both on the main level
- Flooring: Carpet; Vinyl
- Bathrooms: 1 bathroom
- Heating & cooling: Natural gas heating; Wall/window air conditioning unit(s)
- Interior features: Laminate counters; Electric water heater
- Laundry & utility: Was not specified
Neighborhood map
What this means for you Summary
Snapshot
- This is a 1-bed/1.0-bath other listed at $140k.
Deal economics
- At list price, monthly cash flow is $142 ($2k/yr) — positive.
- The deal already cash-flows at list — no discount required.
- To meet the 1% rule (rent ≥ 1% of price), the offer needs to be $132k (5.7% below list).
- Recommended offer: $132k (5.7% below list) — sets the bar for 1% rule.
- Cap rate 7.5% vs local median 3.1% in Mountain Home — top-decile yield for the area; either an underpriced asset or a hidden risk that comps aren't pricing in. Stress-test before assuming the spread holds.
Location & tenants
- Location reads 76/100 on livability (#26 in ID, #3,741 nationally) — a middle-class / working-renter tenant base. Strengths: cost of living A+, housing A+, health & safety A+; Watch: employment D, amenities F, commute F.
- Mountain Home District (town): math 28% / reading 44% proficiency, ranked #78 of 92 in ID (top 85%) — families likely to look elsewhere, expect single-tenant / working-renter base with shorter leases.
- Zoned schools: Mountain Home Sr High School (math 21% / reading 44%, grade F, #117 of 169 statewide, top 70%, 960 students, 33% FRL).
- Market conditions: Rents rising fast (+6.2%/yr); 347 active listings in the ZIP; 129 units permitted in Elmore County in 2024 (0 in 5+ unit buildings).
Forward outlook
- Local home prices are declining (-3.0%/yr); year-one equity from $968 of loan paydown is wiped out by about $4k of value loss. Plan a longer hold.
- Elmore County population projected at -35% by 2050 — secular population decline; favor cash flow + early exit over multi-decade hold.
Negotiation context
- It's been on market 27 days — a 2% lower offer ($138k) is reasonable based on typical stale-listing flexibility.
- 4 sale attempts since 22y ago; this cycle's ask has dropped $20k (12%) from the opening price — seller is motivated, your offer sets the floor, not the list.
Risks & watch-outs
- Watch-outs: built in 1930 — expect roof / HVAC / electrical / plumbing capex.
Questions for the listing agent
- Built in 1930 — when were the roof, HVAC, electrical panel, plumbing, and water heater last replaced?
- Is there a deadline driving the sale (1031 exchange, divorce, estate, relocation)? That informs how much negotiation room exists.
- What's the average days-on-market for RENTAL listings here right now (not sales)? A rising rental-DOM trend means longer vacancies and softer asking-rent achievability than the comps imply.
- What's the recent tenant-quality profile in this submarket — average credit score on applications, eviction rate, late-payment / NSF rate, and stable-employment percentage? A property-management company in the area should have these aggregated.
- How much new for-sale + rental construction is in the pipeline within 1–3 miles? Heavy new supply typically softens prices + rents 12–24 months out; constrained supply supports both.
Investment metrics
- 1% rule
- 0.94% ✗
- Cap rate
- 7.51%
- Cash-on-cash
- 4.35%
- DSCR
- 1.19
- GRM
- 8.8
CMA / ARV
No comps found within radius.
Projected returns pro-forma
-3.0% appreciation · 6.23% rent growth · sell at horizon
- IRR
- -6.1%
- Equity multiple
- 0.76×
- Total profit
- $-9,222
- Equity at exit
- $20,874
- IRR
- 6.9%
- Equity multiple
- 1.59×
- Total profit
- $22,967
- Equity at exit
- $12,105
Cash invested: $39,200 (down + closing). Projections, not guarantees.
Landlord ↔ Tenant lean methodology
- Overall (STATE)
- 91 Strongly Landlord-Friendly
- State Idaho
- 91 Strongly Landlord-Friendly · R+18
- County
- — inherits STATE
- City
- — inherits STATE
ZIP-level market 83647
- Home prices YoY
- -31.4%
- Rents YoY
- 6.2%
- Active inventory
- 347
- Price-to-rent
- 8.8×
Monthly cashflow live
- Estimated rent
- $1,320 medium interval (Pro) →
- Mortgage (P&I)
- −$734
- Tax from tax record
- −$108 /mo · $1,298/yr
- Insurance
- −$58
- HOA
- −$0
- Vacancy / Maint / Mgmt
- −$277
- Net cashflow
- $142
Break-even live
UW: 25.0% down · 7.5% · 30yr · 1.5% tax · 5.0% vac · 8.0% maint · 8.0% mgmt
Financing live
Cash to close
- Down payment
- $35,000
- Closing costs
- $4,200
- Reserves months
- —
- Total cash needed
- —
Loan-product check · same deal, 3 products live
Conventional
25% down · 7.5% · 30yr
- Down + closing
- —
- Monthly P&I
- —
- Monthly cashflow
- —
- DSCR
- —
- Eligible?
- —
Personal DTI + credit; lowest rate.
DSCR
20% down · 8.5% · 30yr
- Down + closing
- —
- Monthly P&I
- —
- Monthly cashflow
- —
- DSCR
- —
- Eligible?
- —
No personal income docs; deal must DSCR.
Hard money
10% down · 12.0% · 12mo
- Down + closing
- —
- Monthly P&I
- —
- Monthly cashflow
- —
- DSCR
- —
- Eligible?
- —
Short-term bridge; refi at stabilization.
Listing history 23 events
-
2026-06-19days on market $140,000 Active 27 DOM
-
2026-06-18days on market $140,000 Active 26 DOM
-
2026-06-17days on market $140,000 Active 25 DOM
-
2026-06-16days on market $140,000 Active 24 DOM
-
2026-06-15days on market $140,000 Active 23 DOM
-
2026-06-14days on market $140,000 Active 21 DOM
-
2026-06-12days on market $140,000 Active 20 DOM
-
2026-06-09days on market $140,000 Active 17 DOM
-
2026-06-09price $140,000 Active 16 DOM
-
2026-06-08days on market $160,000 Active 16 DOM
-
2026-06-07days on market $160,000 Active 15 DOM
-
2026-06-07days on market $160,000 Active 14 DOM
-
2026-06-04days on market $160,000 Active 11 DOM
-
2026-06-02days on market $160,000 Active 10 DOM
-
2026-06-01days on market $160,000 Active 9 DOM
-
2026-05-31days on market $160,000 Active 8 DOM
-
2026-05-31days on market $160,000 Active 7 DOM
-
2026-05-23$160,000 Active
-
2014-08-27soldstatus
-
2014-07-18$19,990
-
2013-09-09$17,900
-
2005-02-28soldstatus
-
2004-10-26$25,900
ⓘ Source: listings_history table (triggers on properties + properties_extension) + one-shot
backfill from property_details.listing_events for pre-trigger history.
Tax reassessment forecast ID · Resets to sale price
- Current annual tax
- $1,298 · $108/mo
- Projected year-2 tax
- $1,298 · $108/mo
- Expected delta
- $0/yr ($0/mo · 0.0%)
ⓘ Screening estimate from a state-policy table — verify with the county assessor before closing.
Nearby sold comps map
Loading sold comps map…
Walkable amenities ~0.75 mi
Loading nearby amenities…
Taxation est. · year 1
- Rental income
- $15,841
- − Mortgage interest
- −$7,842
- − Property taxes
- −$1,298
- − Insurance
- −$700
- − Repairs & maintenance
- −$1,267
- − Management
- −$1,267
- − Depreciation
- −$4,073
- Taxable loss
- −$606
- Est. tax savings @ 24.0%
- +$146
- After-tax cash flow
- $1,852/yr
For passive investors: Depreciation is non-cash, so a rental often shows a tax loss while cash-flowing — sheltering income. Rental losses are passive: they offset passive income freely, and up to $25,000/yr can offset ordinary (W-2) income if you actively participate and your MAGI is under $100k (phasing out to $0 by $150k); unused losses carry forward. On sale, claimed depreciation is recaptured at up to 25%, and gains may owe capital-gains tax (a 1031 exchange can defer both). Figures are a year-1 estimate at your 24.0% rate — not tax advice; consult a CPA.
Schools (NCES district)
- District
- Mountain Home District
- NCES district ID
- 1602250
- Math proficiency
- 28% ▼ -5.00%
- Reading proficiency
- 44% ▲ 1.00%
- Median HH income
- $44,262
- Composite
- 30.57/100
- National rank
- #6203
- State rank
- #78 of 92 in ID
Livability — Mountain Home
- Score
- 76/100
- State rank
- #26
- US rank
- #3741
Category grades
Schools grade is shown separately in the Schools card above.
Census & demographics
- Census place
- Mountain Home, ID
- County
- Elmore County · 22,952 people
- City population
- 22,952
- Metro
- Mountain Home, ID
- Population (ZIP)
- 22,952
- Household income
- $63,760
- Rent vs Own
- Severe rent burden
- 317.0
Population outlook (Elmore County) Hauer SSP2
- Today (2025)
- 22,644 people
- By 2030
- 21,112 · -6.8%
- By 2040
- 17,768 · -21.5%
- By 2050
- 14,629 · -35.4%
- By 2075
- 9,144 · -59.6%
- By 2100
- 6,006 · -73.5%
Race, ethnicity, and origin ACS 2023
- Neighborhood character
- Predominantly White (72%)
- Race & ethnicity
- White 72% Hispanic / Latino 18% Two or more races 13% Asian 3% Black 2% Native American 1%
- Hispanic origin (detail)
- Mexican 15%
- Common ancestry
- Portuguese 4% Lithuanian 3% Scotch-Irish 3%
- Foreign-born
- 10% · Canada
- Languages at home
- 85% English-only · Spanish 10% Russian/Polish/Slavic 2% Chinese 1%
Political lean MEDSL · Elmore
- 2024 margin
- Solid R (+48.5) · D 24.5% · R 73.0% · Other 2.5%
- 2008→2024 swing
- -12.1pp toward R · 2008: -36.4pp · 2024: -48.5pp
- All cycles
- 2024: R+48.5 2020: R+45.5 2016: R+47.0 2012: R+33.9 2008: R+36.4
Not yet ingested
- Civics
- —
Market trends
- HPI YoY
- ▼ -108.42%
- Current HPI
- 236.3087
- Rent YoY
- ▲ 6.23%
- Metro
- Mountain Home, ID
- State GDP YoY
- ▲ 4.51%
- F500 in state
- 6
Industry mix (Fortune 500 HQ in ID)
| Industry | F500 HQs | Revenue |
|---|---|---|
| Retail | 1 | $79B |
|
||
| Technology | 1 | $25B |
|
||
| Food / Agriculture | 1 | $6B |
|
||
Price history
+517.8% since first listed6 events — show timeline
- 2026-05-23 Listed $160,000 IMLS
- 2014-08-27 Sold (Public Records) — Public Records
- 2014-07-18 Listed $19,990 IMLS
- 2013-09-09 Listed $17,900 IMLS
- 2005-02-28 Sold (MLS) — IMLS
- 2004-10-26 Listed $25,900 IMLS
Property tax history
+8.1%/yrLatest (2025): $1,298 · -7.6% YoY. Source: county tax records.
Cash-flow waterfall
monthlySold comps — $/sqft
last 12 mo · ≤1 miLoading sold comps…