1600 SE Saint Lucie Blvd SE #211 · Stuart, FL
Flood risk 7/10 · Major
- FEMA flood zone
- X (unshaded)
- Chance of flooding over 30 yrs
- 0.74%
- Est. flood insurance / yr
- $507 – $1,088
Fire risk 1/10 · Minimal
- Est. fire insurance / yr
- $947 – $1,759
Heat risk 10/10 · Severe
- Hot days now (above 106°F)
- 7 days/yr
- Hot days in 30 yrs
- 24 days/yr
Wind risk 10/10 · Severe
- Chance of severe wind over 30 yrs
- 99.0%
Air-quality risk 2/10 · Minimal
- Unhealthy air days now
- 2 days/yr
- Unhealthy air days in 30 yrs
- 2 days/yr
Risk factors via First Street. Map © Google.
Why this score? — see what drove the B- grade
The composite is a weighted blend of 9 inputs, each scored 0–100. Each bar is that input's sub-score; the figure is the points it added to the 100-point composite (weight × sub-score).
- Cash flow +15.5/30.0
- ARV discount +15.0/15.0
- Appreciation +10.0/10.0
- 1% rule +9.3/10.0
- DSCR +4.8/10.0
- Schools +4.5/10.0
- Livability +4.2/5.0
- Rent growth +2.5/5.0
- Condition / age +2.5/5.0
$196,000
🖨 Deal sheet 📄 Offer letter ✓ Due diligence
Listing remarks
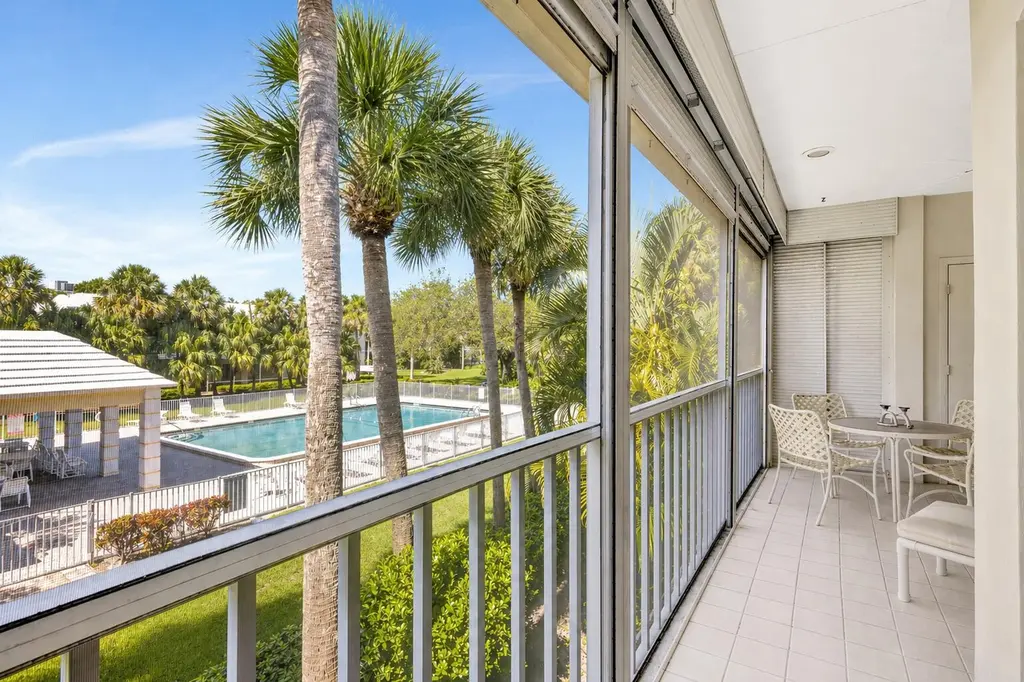
PRICED TO SELL! A Must See! Don't miss this light and bright corner 2BR/2BA condo in Stuart, FL with sparkling pool views and abundant natural light throughout. Fully furnished and turnkey, this well-maintained condo features a spacious open layout, private balcony perfect for morning coffee or sunset relaxation, and a fully equipped kitchen. Enjoy peace of mind with a newer roof (2020) and new A/C (2024). Just minutes from the beach, sunrise, sunsets, downtown shopping, fine dining, marinas, golf, parks, and recreational activities all close by. Perfect for full-time living, vacation retreats, or income-producing investment--make this your canvas and enjoy the ultimate Stuart coastal lifes
Key facts
- Sparkling pool views
- Private balcony
- Newer roof
Tags
Property features AI
Finance
- Financial info: Pets allowed with possible restrictions and number limits
- HOA & community: Association: Banyan House Condominium Assoc.; Monthly HOA fee of $793; HOA covers cable TV, insurance, grounds maintenance, pest control, and common areas; Community amenities include cabana, clubhouse, picnic area, pool, storage, tennis courts, community room, library, and sidewalks; maintenance provided
Exterior
- Parking: Assigned parking (1 open/total space); No carport
- Utilities: Public water; Public sewer; Three-phase electric; Cable available; Phone available; Electricity connected; Water available; Sewer available
- Home design: Condominium; Multi/split levels; North-facing; Single-story building
- Construction: Concrete construction; Other roof
- Exterior features: Asphalt road frontage; Private maintained road; Not waterfront
Interior
- Kitchen: Dishwasher; Electric range; Electric cooktop; Refrigerator; Electric water heater
- Bedrooms: 1 bedroom on main level
- Flooring: Tile
- Bathrooms: 2 full bathrooms (1 on main level)
- Heating & cooling: Central heating; Central air; Ceiling fan(s)
- Interior features: Walk-in closets; Split bedroom layout; Furnished
- Laundry & utility: Laundry closet with washer hookup inside
Neighborhood map
What this means for you Summary
Snapshot
- This is a 2-bed/2.0-bath condo listed at $196k.
Deal economics
- At list price, monthly cash flow is $11 ($137/yr) — positive.
- The deal already cash-flows at list — no discount required.
- Meets the 1% rule at list price ($3k rent vs $196k).
- Recommended offer: $190k (3.0% below list) — sets the bar for market timing.
Location & tenants
- Location reads 84/100 on livability (#39 in FL, #790 nationally) — a professional / high-income tenant draw. Strengths: commute A+, housing A+, health & safety A+; Watch: crime C-, employment C-, amenities D.
- Martin (suburban): math 52% / reading 53% proficiency, ranked #24 of 73 in FL (top 33%) — acceptable for families but not a draw, mixed tenant base, ~2y average lease.
- Zoned schools: Stuart Middle School (math 55% / reading 55%, grade B-, #180 of 571 statewide, top 32%, 867 students, 49% FRL); Jensen Beach High School (math 53% / reading 71%, grade B-, #98 of 667 statewide, top 15%, 1,584 students, 36% FRL) — zoned schools at 42% FRL track the district average.
- Market conditions: 251 active listings in the ZIP; 21 comparable units currently listed for rent nearby; rentals at typical pace (median 24d on market — plan ~3-4 weeks tenant-placement turnaround); solid renter incomes; 737 units permitted in Martin County in 2024 (167 in 5+ unit buildings).
Forward outlook
- In year one you build about $21k of equity ($1k loan paydown + $20k appreciation (10.0% local appreciation)).
- Martin County population projected at +19% by 2050 — long-run rental-demand tailwind backs the buy-and-hold thesis.
- At projected returns (10.0% appreciation + 3.0% rent growth), your $55k cash investment doubles in ~3 years — after that, you're playing with house money.
- By year 2, paydown + projected appreciation supports a ~$34k cash-out refi (75% LTV) — recoverable capital for the next deal without selling this one.
Negotiation context
- It's been on market 48 days — a 3% lower offer ($190k) is reasonable based on typical stale-listing flexibility.
- 3 sale attempts since 2y ago with the ask held roughly flat each time — persistent listings suggest the price (not the market) is what's stuck; bring a comps-based counter.
- Current owner paid $82k; list at $196k implies a 139% gain — meaningful room to come down on a strong offer.
Risks & watch-outs
- Watch-outs: flood insurance adds $66/mo; HOA is 28% of rent.
- Climate carrying-cost: major flood risk; severe wind risk, 99% chance of damaging wind over 30y; extreme-heat days projected 7→24/yr by 2055 (HVAC capex compounding) — expect insurance premiums to compound above CPI over the hold.
Questions for the listing agent
- It's been on market 48 days. Have you received any prior offers? Is the seller open to a 3% concession, seller financing, or rate buy-down credit?
- What's the actual annual flood-insurance premium (NFIP or private), and is the property in a SFHA with mandatory coverage?
- What does the HOA fee cover, when was the last increase, and are there any pending special assessments or reserve-fund shortfalls?
- Any open or pending special assessments — roof, HVAC, plumbing, elevator, façade? What's the per-unit balance and payoff schedule, and is the seller paying it off at close or rolling it to the buyer?
- Is there a deadline driving the sale (1031 exchange, divorce, estate, relocation)? That informs how much negotiation room exists.
- Schools are A-rated — typically a magnet for longer-tenancy family renters. What's the average tenant stay here, and is there a school-zone premium baked into asking?
- What's the average days-on-market for RENTAL listings here right now (not sales)? A rising rental-DOM trend means longer vacancies and softer asking-rent achievability than the comps imply.
- What's the recent tenant-quality profile in this submarket — average credit score on applications, eviction rate, late-payment / NSF rate, and stable-employment percentage? A property-management company in the area should have these aggregated.
- How much new apartment / multifamily construction is in the pipeline within 1–3 miles? Heavy new supply (>2% of stock underway) typically softens rents 12–24 months out; light construction supports rent growth.
Investment metrics
- 1% rule
- 1.44% ✓
- Cap rate
- 6.77%
- Cash-on-cash
- 1.70%
- DSCR
- 1.08
- GRM
- 5.8
CMA / ARV
- ARV (median comp)
- $241,039
- List price
- $196,000
- Delta
- -18.69%
- Verdict
- UNDERPRICED
- Comps
- 20 within 1.0 mi
Projected returns pro-forma
10.0% appreciation · 3.0% rent growth · sell at horizon
- IRR
- 24.6%
- Equity multiple
- 2.97×
- Total profit
- $108,043
- Equity at exit
- $176,572
- IRR
- 21.8%
- Equity multiple
- 6.81×
- Total profit
- $318,726
- Equity at exit
- $380,785
Cash invested: $54,880 (down + closing). Projections, not guarantees.
Landlord ↔ Tenant lean methodology
- Overall (STATE)
- 87 Strongly Landlord-Friendly
- State Florida
- 87 Strongly Landlord-Friendly · R+3
- County
- — inherits STATE
- City
- — inherits STATE
ZIP-level market 34996
- Home prices YoY
- 2.1%
- Active inventory
- 251
- Price-to-rent
- 5.8×
Monthly cashflow live
- Estimated rent
- $2,813 high interval (Pro) →
- Mortgage (P&I)
- −$1,028
- Tax from tax record
- −$242 /mo · $2,899/yr
- Insurance
- −$82
- Flood insurance flood zone
- −$66 /mo · $798/yr
- HOA
- −$793
- Vacancy / Maint / Mgmt
- −$591
- Net cashflow
- $11
Break-even live
UW: 25.0% down · 7.5% · 30yr · 1.5% tax · 5.0% vac · 8.0% maint · 8.0% mgmt
Financing live
Cash to close
- Down payment
- $49,000
- Closing costs
- $5,880
- Reserves months
- —
- Total cash needed
- —
Loan-product check · same deal, 3 products live
Conventional
25% down · 7.5% · 30yr
- Down + closing
- —
- Monthly P&I
- —
- Monthly cashflow
- —
- DSCR
- —
- Eligible?
- —
Personal DTI + credit; lowest rate.
DSCR
20% down · 8.5% · 30yr
- Down + closing
- —
- Monthly P&I
- —
- Monthly cashflow
- —
- DSCR
- —
- Eligible?
- —
No personal income docs; deal must DSCR.
Hard money
10% down · 12.0% · 12mo
- Down + closing
- —
- Monthly P&I
- —
- Monthly cashflow
- —
- DSCR
- —
- Eligible?
- —
Short-term bridge; refi at stabilization.
Rent comps 21 comps
| Address | Beds | Baths | Sqft | Rent | $/sqft | DOM | Units | Dist |
|---|---|---|---|---|---|---|---|---|
| 1800 SE Saint Lucie Blvd Stuart, FL | 2.0 | 2.0 | 1044 | $2,600 | $2.49 | 23d | 3 | 0.18mi |
| 1843 SE Granada Ln Stuart, FL | 2.0 | 2.0 | 1606 | $1,800 | $1.12 | 14d | 1 | 0.29mi |
| 1196 SE Saint Lucie Blvd Stuart, FL | 2.0 | 2.0 | 1309 | $4,300 | $3.28 | 23d | 1 | 0.31mi |
| 2950 SE Ocean Blvd Stuart, FL | 2.0 | 2.0 | 1157 | $1,800 | $1.56 | 14d | 3 | 0.65mi |
| 1866 SE Tarni Way Stuart, FL | 3.0 | 2.5 | 1782 | $2,800 | $1.57 | 14d | 1 | 0.68mi |
| 2600 SE Ocean Blvd Stuart, FL | 1.0–2.0 | 1.5–2.0 | 951 | $1,900 | $2.00 | 14d | 3 | 0.69mi |
| 3129 SE Indian St #3 Stuart, FL | 2.0 | 1.5 | 986 | $2,300 | $2.33 | 23d | 1 | 0.86mi |
| 2929 SE Ocean Blvd Stuart, FL | 1.0–2.0 | 1.0–2.0 | 812 | $2,400 | $2.96 | 14d | 8 | 0.88mi |
| 2929 SE Ocean Blvd Stuart, FL | 1.0–2.0 | 1.0–2.0 | 812 | $2,400 | $2.96 | 23d | 6 | 0.88mi |
| 905 SE Flamingo Ave Stuart, FL | 3.0 | 2.0 | 1520 | $4,500 | $2.96 | 23d | 1 | 0.99mi |
| 2929 SE Ocean Blvd Unit 130 Stuart, FL | 2.0 | 2.0 | 1005 | $1,800 | $1.79 | 23d | 1 | 1.04mi |
| 300 SE Saint Lucie Blvd Stuart, FL | 1.0–3.0 | 1.0–2.0 | 884 | $2,258 | $2.55 | 14d | 12 | 1.17mi |
| 3002 SE Camino Ave Stuart, FL | 2.0 | 1.0 | 930 | $2,000 | $2.15 | 23d | 1 | 1.23mi |
| 3003 SE Birch Ave Unit 3007 Stuart, FL | 2.0 | 1.0 | 950 | $2,200 | $2.32 | 23d | 1 | 1.24mi |
| 3299 SE Garden St Stuart, FL | 3.0 | 2.0 | 1360 | $2,410 | $1.77 | 23d | 1 | 1.27mi |
| 2934 SE Ellendale St Stuart, FL | 2.0 | 2.0 | 900 | $2,000 | $2.22 | 14d | 1 | 1.30mi |
| 2641 SE Clayton St Unit 2641 Stuart, FL | 3.0 | 1.5 | 1150 | $2,400 | $2.09 | 23d | 1 | 1.30mi |
| 262 SE Monterey Ave Stuart, FL | 3.0 | 1.0 | 1001 | $3,500 | $3.50 | 23d | 1 | 1.30mi |
| 3003 SE Fairmont St Stuart, FL | 3.0 | 2.0 | 1366 | $2,500 | $1.83 | 14d | 1 | 1.31mi |
| 175 SE Saint Lucie Blvd Stuart, FL | 2.0 | 2.0–2.5 | 1300 | $2,600 | $2.00 | 23d | 4 | 1.38mi |
| 150 SE Four Winds Dr Unit B303 Stuart, FL | 2.0 | 2.0 | 1359 | $2,500 | $1.84 | 23d | 1 | 1.49mi |
HOA detail condo
- Monthly dues
- $793 · $9,516/yr
- Likely covers
- pool
- Assessments
- None detected in remarks — confirm with the listing agent.
Listing history 24 events
-
2026-06-18days on market $196,000 Active 48 DOM
-
2026-06-17days on market $196,000 Active 47 DOM
-
2026-06-16days on market $196,000 Active 46 DOM
-
2026-06-15days on market $196,000 Active 45 DOM
-
2026-06-14days on market $196,000 Active 43 DOM
-
2026-06-13days on market $196,000 Active 42 DOM
-
2026-06-10days on market $196,000 Active 40 DOM
-
2026-06-09days on market $196,000 Active 39 DOM
-
2026-06-08days on market $196,000 Active 38 DOM
-
2026-06-07days on market $196,000 Active 37 DOM
-
2026-06-03days on market $196,000 Active 33 DOM
-
2026-06-02days on market $196,000 Active 32 DOM
-
2026-06-01days on market $196,000 Active 31 DOM
-
2026-05-31days on market $196,000 Active 30 DOM
-
2026-05-31days on market $196,000 Active 29 DOM
-
2026-04-29$196,000 Active 728-char remark
-
2026-04-19historical
-
2026-03-07price $199,000
-
2025-09-28price $220,000
-
2025-06-19$237,000 Active
-
2025-06-01historical
-
2025-03-28price $264,000
-
2024-10-01$289,000 Active
-
1987-11-16soldstatus $81,900
ⓘ Source: listings_history table (triggers on properties + properties_extension) + one-shot
backfill from property_details.listing_events for pre-trigger history.
Tax reassessment forecast FL · Resets to sale price
- Current annual tax
- $2,899 · $242/mo
- Projected year-2 tax
- $2,899 · $242/mo
- Expected delta
- $0/yr ($0/mo · 0.0%)
ⓘ Screening estimate from a state-policy table — verify with the county assessor before closing.
Climate risk First Street
- Flood 7/10 Severe FEMA zone X (unshaded) · 74% chance over 30 yrs
- Wildfire 1/10 Low
- Heat 10/10 Extreme 7 d/yr ≥106°F today · 24 d/yr by 30 yrs out
- Wind 10/10 Extreme 99% chance of damaging wind over 30 yrs
- Air quality 2/10 Low 2 unhealthy d/yr today · 2 by 30 yrs out
Nearby sold comps map
Loading sold comps map…
Walkable amenities ~0.75 mi
Loading nearby amenities…
Taxation est. · year 1
- Rental income
- $33,751
- − Mortgage interest
- −$10,979
- − Property taxes
- −$2,899
- − Insurance
- −$1,778
- − Repairs & maintenance
- −$2,700
- − Management
- −$2,700
- − HOA
- −$9,516
- − Depreciation
- −$5,702
- Taxable loss
- −$2,522
- Est. tax savings @ 24.0%
- +$605
- After-tax cash flow
- $742/yr
For passive investors: Depreciation is non-cash, so a rental often shows a tax loss while cash-flowing — sheltering income. Rental losses are passive: they offset passive income freely, and up to $25,000/yr can offset ordinary (W-2) income if you actively participate and your MAGI is under $100k (phasing out to $0 by $150k); unused losses carry forward. On sale, claimed depreciation is recaptured at up to 25%, and gains may owe capital-gains tax (a 1031 exchange can defer both). Figures are a year-1 estimate at your 24.0% rate — not tax advice; consult a CPA.
Schools (NCES district)
- District
- Martin
- NCES district ID
- 1201290
- Math proficiency
- 52% ▼ -14.00%
- Reading proficiency
- 53% ▼ -4.00%
- Median HH income
- $52,482
- Composite
- 45.1/100
- National rank
- #2690
- State rank
- #24 of 73 in FL
Livability — Stuart
- Score
- 84/100
- State rank
- #39
- US rank
- #790
Category grades
Schools grade is shown separately in the Schools card above.
Census & demographics
- County
- Martin County · 165,223 people
- City population
- 65,812
- Metro
- Port St. Lucie, FL
- Population (ZIP)
- 10,653
- Household income
- $83,929
- Rent vs Own
- Severe rent burden
- 247.0
Population outlook (Martin County) Hauer SSP2
- Today (2025)
- 172,383 people
- By 2030
- 180,192 · +4.5%
- By 2040
- 194,114 · +12.6%
- By 2050
- 204,992 · +18.9%
- By 2075
- 229,641 · +33.2%
- By 2100
- 232,146 · +34.7%
Race, ethnicity, and origin ACS 2023
- Neighborhood character
- Predominantly White (90%)
- Race & ethnicity
- White 90% Hispanic / Latino 7% Two or more races 5%
- Hispanic origin (detail)
- Puerto Rican 2%
- Common ancestry
- Italian 3% Romanian 3% Slovak 3%
- Foreign-born
- 6% · Canada
- Languages at home
- 94% English-only · Spanish 3% Other Indo-European 1% French/Haitian/Cajun 1%
Political lean MEDSL · Martin
- 2024 margin
- Solid R (+31.1) · D 34.1% · R 65.2%
- 2008→2024 swing
- -17.5pp toward R · 2008: -13.6pp · 2024: -31.1pp
- All cycles
- 2024: R+31.1 2020: R+24.6 2016: R+26.9 2012: R+22.9 2008: R+13.6
Not yet ingested
- Civics
- —
Market trends
- HPI YoY
- ▲ 13.71%
- Current HPI
- 658.96
- Rent YoY
- —
- Metro
- Port St. Lucie, FL
- State GDP YoY
- ▲ 3.28%
- F500 in state
- 36
Industry mix (Fortune 500 HQ in FL)
| Industry | F500 HQs | Revenue |
|---|---|---|
| Industrial Technology | 2 | $29B |
|
||
| Insurance | 2 | $17B |
|
||
| Retail | 1 | $60B |
|
||
| Technology Distribution | 1 | $58B |
|
||
| Homebuilding | 1 | $35B |
|
||
| Technology Manufacturing | 1 | $35B |
|
||
Price history
+139.3% since first listed9 events — show timeline
- 2026-04-29 Listed $196,000 Beaches MLS
- 2026-04-19 Listing Removed — Beaches MLS
- 2026-03-07 Price Changed $199,000 Beaches MLS
- 2025-09-28 Price Changed $220,000 Beaches MLS
- 2025-06-19 Listed $237,000 Beaches MLS
- 2025-06-01 Listing Removed — MCRTC
- 2025-03-28 Price Changed $264,000 MCRTC
- 2024-10-01 Listed $289,000 MCRTC
- 1987-11-16 Sold (Public Records) $81,900 Public Records
Property tax history
+5.3%/yrLatest (2025): $2,899 · +5.5% YoY. Source: county tax records.
Cash-flow waterfall
monthlySold comps — $/sqft
last 12 mo · ≤1 miLoading sold comps…