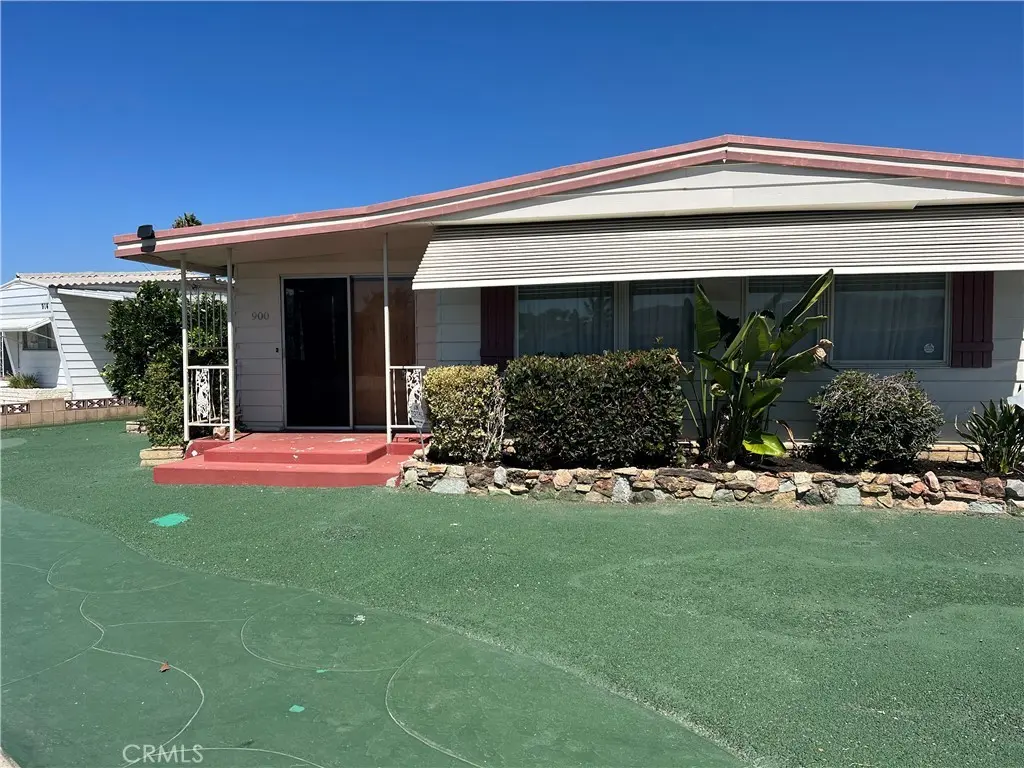
900 W Johnston · Hemet, CA
Flood risk 1/10 · Minimal
- FEMA flood zone
- X (shaded)
- Chance of flooding over 30 yrs
- 0.0%
- Est. flood insurance / yr
- $507 – $1,088
Fire risk 6/10 · Moderate
- Est. fire insurance / yr
- $659 – $1,223
Heat risk 7/10 · Major
- Hot days now (above 104°F)
- 6 days/yr
- Hot days in 30 yrs
- 16 days/yr
Wind risk 1/10 · Minimal
- Chance of severe wind over 30 yrs
- —
Air-quality risk 6/10 · Moderate
- Unhealthy air days now
- 9 days/yr
- Unhealthy air days in 30 yrs
- 11 days/yr
Risk factors via First Street. Map © Google.
Why this score? — see what drove the D grade
The composite is a weighted blend of 9 inputs, each scored 0–100. Each bar is that input's sub-score; the figure is the points it added to the 100-point composite (weight × sub-score).
- Cash flow +20.0/30.0
- DSCR +6.3/10.0
- 1% rule +5.8/10.0
- Rent growth +2.9/5.0
- Livability +2.6/5.0
- Schools +2.5/10.0
- Condition / age +2.5/5.0
- ARV discount +0.0/15.0
- Appreciation +0.0/10.0
$172,900
🖨 Deal sheet (PDF) 📄 Offer letter ✓ Due diligence
Listing remarks MLS
Welcome to this charming 2-bedroom, 2-bath home offering comfort and convenience in every corner. Step into a spacious living room that flows seamlessly into the dining area—perfect for entertaining family and friends. Outside, enjoy your own private orchard featuring 4 fruit-bearing trees: orange, lemon, grapefruit, and fig. A wonderful opportunity to savor fresh-picked fruit right from your backyard. Don’t miss this delightful home! The HOA includes swimming pools, spas, pickle ball courts, a dog park. Freshly painted and new carpet. Please use booties provided in laundry room before enrty into home.
Key facts
- Dog park
- Swimming pools
- Private orchard
Tags
Neighborhood map
What this means for you Summary
Snapshot
- This is a 2-bed/2.0-bath manufactured listed at $173k.
Deal economics
- At list price, monthly cash flow is $211 ($3k/yr) — positive.
- The deal already cash-flows at list — no discount required.
- Meets the 1% rule at list price ($2k rent vs $173k).
- Recommended offer: $163k (6.0% below list) — sets the bar for market timing.
- Cap rate 7.8% vs local median 4.8% in Hemet — top-decile yield for the area; either an underpriced asset or a hidden risk that comps aren't pricing in. Stress-test before assuming the spread holds.
Location & tenants
- Location reads 51/100 on livability (#1,056 in CA) — a working-class tenant base; expect higher turnover. Strengths: housing A+; Watch: crime D+, amenities F, commute F.
- Hemet Unified (suburban): math 19% / reading 41% proficiency, ranked #360 of 517 in CA (top 70%) — families likely to look elsewhere, expect single-tenant / working-renter base with shorter leases; 66% free/reduced lunch — lower-income household profile, screen leases tightly.
- Zoned schools: Whittier Elementary (886 students, 92% FRL); Diamond Valley Middle (math 10% / reading 10%, grade F, #474 of 498 statewide, top 99%, 1,078 students, 91% FRL); West Valley High (math 18% / reading 40%, grade F, #770 of 1,170 statewide, top 66%, 1,898 students, 88% FRL) — zoned schools average 90% FRL vs 66% district-wide (24 pts higher); higher-poverty schools than district average — tighter screening recommended.
- Market conditions: Rents rising (+1.8%/yr); 273 active listings in the ZIP; 40 comparable units currently listed for rent nearby; rentals at typical pace (median 18d on market — plan ~3-4 weeks tenant-placement turnaround); 9,195 units permitted in Riverside County in 2024 (1,512 in 5+ unit buildings).
- At $1,863/mo this rent would consume 45% of the median local household income ($49k/yr) (locally 2144% of renters already pay >50% of income on rent) — very limited rent-growth headroom before tenants either downsize or default.
Forward outlook
- Local home prices are declining (-3.0%/yr); year-one equity from $1k of loan paydown is wiped out by about $5k of value loss. Plan a longer hold.
- Riverside County population projected at +22% by 2050 — long-run rental-demand tailwind backs the buy-and-hold thesis.
Negotiation context
- It's been on market 74 days — a 6% lower offer ($163k) is reasonable based on typical stale-listing flexibility.
- 4 sale attempts; this cycle's ask has dropped $10k (6%) from the opening price — seller is motivated, your offer sets the floor, not the list.
- Current owner paid $45k; list at $173k implies a 284% gain — meaningful room to come down on a strong offer.
Risks & watch-outs
- Climate carrying-cost: major wildfire risk; extreme-heat days projected 6→16/yr by 2055 (HVAC capex compounding) — expect insurance premiums to compound above CPI over the hold.
Questions for the listing agent
- It's been on market 74 days. Have you received any prior offers? Is the seller open to a 6% concession, seller financing, or rate buy-down credit?
- Built in 1964 — when were the roof, HVAC, electrical panel, plumbing, and water heater last replaced?
- What does the HOA fee cover, when was the last increase, and are there any pending special assessments or reserve-fund shortfalls?
- Why hasn't it sold? Are there any deal-killer items the seller is aware of (foundation, flood, title, zoning, code violations)?
- Is there a deadline driving the sale (1031 exchange, divorce, estate, relocation)? That informs how much negotiation room exists.
- Schools are F-rated, which usually means shorter tenancies and higher turnover. Who's the typical renter profile here, and what's been the actual vacancy rate?
- Crime grade is D in this area — have there been break-ins, vandalism, or insurance claims at this property in the last 3 years? What carrier currently insures it and at what premium?
- The area grade is low — what's the realistic commute time and amenity access for the typical tenant pool here? Any planned neighborhood developments (good or bad) we should know about?
- What's the average days-on-market for RENTAL listings here right now (not sales)? A rising rental-DOM trend means longer vacancies and softer asking-rent achievability than the comps imply.
- What's the recent tenant-quality profile in this submarket — average credit score on applications, eviction rate, late-payment / NSF rate, and stable-employment percentage? A property-management company in the area should have these aggregated.
- How much new for-sale + rental construction is in the pipeline within 1–3 miles? Heavy new supply typically softens prices + rents 12–24 months out; constrained supply supports both.
Investment metrics
- 1% rule
- 1.08% ✓
- Cap rate
- 7.76%
- Cash-on-cash
- 5.22%
- DSCR
- 1.23
- GRM
- 7.7
CMA / ARV
- ARV (median comp)
- $135,000
- List price
- $172,900
- Delta
- 28.07%
- Verdict
- OVERPRICED
- Comps
- 20 within 1.0 mi
Show comp detail 12 sales within ~0.75 mi
| Address | Dist | Beds/Ba | Sqft | Sold | Price | $/sf | Match |
|---|---|---|---|---|---|---|---|
| 360 Santa Clara Cir | 0.28mi | 2/2.0 | 1,120 (+2%) | 3mo | $224,000 | $200 | 81 |
| 1167 Via Del Mesa | 0.26mi | 2/2.0 | 1,152 (+5%) | 1mo | $135,000 | $117 | 79 |
| 1111 W Johnston Ave | 0.13mi | 2/2.0 | 1,200 (+9%) | 0mo | $135,000 | $113 | 78 |
| 190 Santa Lucia | 0.34mi | 2/2.0 | 1,040 (-6%) | 4mo | $179,000 | $172 | 72 |
| 1083 Via Del Mesa | 0.23mi | 2/2.0 | 1,200 (+9%) | 3mo | $149,900 | $125 | 72 |
| 220 San Carlos Dr | 0.23mi | 2/1.0 | 1,020 (-7%) | 2mo | $127,000 | $125 | 71 |
| 770 S Lyon | 0.50mi | 2/2.0 | 1,152 (+5%) | 3mo | $78,900 | $68 | 66 |
| 431 San Mateo Cir | 0.46mi | 3/2.0 (+1) | 1,040 (-6%) | 3mo | $118,000 | $113 | 62 |
| 995 Santa Teresa Way | 0.61mi | 3/2.0 (+1) | 1,056 (-4%) | 3mo | $185,000 | $175 | 57 |
| 1760 Santiago | 0.60mi | 2/2.0 | 1,248 (+14%) | 0mo | $118,000 | $95 | 49 |
| 460 San Mateo Cir | 0.49mi | 2/1.0 | 940 (-14%) | 3mo | $85,000 | $90 | 46 |
| 575 S Lyon #110 | 0.66mi | 2/2.0 | 940 (-14%) | 2mo | $52,500 | $56 | 43 |
Match score weights: distance 35% · size 25% · config 20% · recency 20%. Top-matched comps best support the ARV.
Projected returns pro-forma
-3.0% appreciation · 1.76% rent growth · sell at horizon
- IRR
- -9.6%
- Equity multiple
- 0.65×
- Total profit
- $-16,822
- Equity at exit
- $25,780
- IRR
- -2.0%
- Equity multiple
- 0.87×
- Total profit
- $-6,275
- Equity at exit
- $14,949
Cash invested: $48,412 (down + closing). Projections, not guarantees.
Landlord ↔ Tenant lean methodology
- Overall (STATE)
- 18 Strongly Tenant-Friendly
- State California
- 18 Strongly Tenant-Friendly · D+13
- County
- — inherits STATE
- City
- — inherits STATE
ZIP-level market 92543
- Home prices YoY
- -26.7%
- Rents YoY
- 1.8%
- Active inventory
- 273
- Price-to-rent
- 7.7×
Monthly cashflow live
- Estimated rent
- $1,863 high interval (Pro) →
- Mortgage (P&I)
- −$907
- Tax from tax record
- −$98 /mo · $1,171/yr
- Insurance
- −$72
- HOA
- −$185
- Vacancy / Maint / Mgmt
- −$391
- Net cashflow
- $211
Break-even live
Sensitivity live
| Price | -10% $309 | -5% $260 | +0% $211 | +5% $162 | +10% $113 |
|---|---|---|---|---|---|
| Rent | -10% $64 | -5% $137 | +0% $211 | +5% $284 | +10% $358 |
| Rate | -1.0pp $298 | -0.5pp $255 | base $211 | +0.5pp $166 | +1.0pp $120 |
UW: 25.0% down · 7.5% · 30yr · 1.5% tax · 5.0% vac · 8.0% maint · 8.0% mgmt
Financing live
Cash to close
- Down payment
- $43,225
- Closing costs
- $5,187
- Reserves months
- —
- Total cash needed
- —
Loan-product check · same deal, 3 products live
Conventional
25% down · 7.5% · 30yr
- Down + closing
- —
- Monthly P&I
- —
- Monthly cashflow
- —
- DSCR
- —
- Eligible?
- —
Personal DTI + credit; lowest rate.
DSCR
20% down · 8.5% · 30yr
- Down + closing
- —
- Monthly P&I
- —
- Monthly cashflow
- —
- DSCR
- —
- Eligible?
- —
No personal income docs; deal must DSCR.
Hard money
10% down · 12.0% · 12mo
- Down + closing
- —
- Monthly P&I
- —
- Monthly cashflow
- —
- DSCR
- —
- Eligible?
- —
Short-term bridge; refi at stabilization.
Rent comps 40 comps
| Address | Beds | Baths | Sqft | Rent | $/sqft | DOM | Units | Dist |
|---|---|---|---|---|---|---|---|---|
| 893 S Palm Ave Hemet, CA | 2.0 | 2.0 | 720 | $1,375 | $1.91 | 6d | 1 | 0.03mi |
| 750 Santa Clara Cir Hemet, CA | 2.0 | 2.0 | 800 | $1,400 | $1.75 | 16d | 1 | 0.03mi |
| 876 W Whittier Ave Unit 878 Hemet, CA | 2.0 | 2.0 | 1127 | $2,150 | $1.91 | 25d | 1 | 0.27mi |
| 1005 S Gilbert St Hemet, CA | 2.0 | 1.5 | 975 | $1,825 | $1.87 | 25d | 2 | 0.27mi |
| 1025 S Gilbert St Hemet, CA | 1.0–2.0 | 1.0–2.0 | 890 | $2,320 | $2.61 | 3d | 8 | 0.28mi |
| 101 San Mateo Cir Hemet, CA | 2.0 | 2.0 | 1152 | $1,790 | $1.55 | 0d | 1 | 0.30mi |
| 120 Santa Lucia Dr Hemet, CA | 2.0 | 2.0 | 1197 | $1,600 | $1.34 | 45d | 1 | 0.30mi |
| 735 S Gilbert St Hemet, CA | 3.0 | 2.0 | 1202 | $2,400 | $2.00 | 45d | 1 | 0.34mi |
| 611 S Palm Ave Unit K Hemet, CA | 2.0 | 2.0 | 1254 | $1,895 | $1.51 | 9d | 1 | 0.36mi |
| 716 Robert Dr Hemet, CA | 3.0 | 2.0 | 1450 | $2,300 | $1.59 | 6d | 1 | 0.44mi |
| 1521 W Westmont Ave Hemet, CA | 2.0 | 2.0 | 1197 | $2,000 | $1.67 | 45d | 1 | 0.44mi |
| 471 S Simpson Ave Unit D Hemet, CA | 2.0 | 2.0 | 900 | $1,750 | $1.94 | 45d | 1 | 0.54mi |
| 1461 W Mayberry Ave Hemet, CA | 2.0 | 2.0 | 1044 | $1,750 | $1.68 | 45d | 1 | 0.59mi |
| 1005 Lilac St Hemet, CA | 2.0 | 1.0 | 894 | $2,100 | $2.35 | 0d | 1 | 0.61mi |
| 471 Whitney Dr Hemet, CA | 2.0 | 2.0 | 1085 | $1,800 | $1.66 | 6d | 1 | 0.69mi |
| 363 S Gilbert St Hemet, CA | 3.0 | 2.0 | 1200 | $1,900 | $1.58 | 5d | 1 | 0.70mi |
| 363 S Gilbert St Unit B Hemet, CA | 3.0 | 2.0 | 1200 | $1,900 | $1.58 | 15d | 1 | 0.70mi |
| 1850 Amberwood Dr Hemet, CA | 2.0 | 2.0 | 1170 | $1,561 | $1.33 | 45d | 1 | 0.70mi |
| 853 Douglas Ct Hemet, CA | 2.0 | 2.0 | 1148 | $1,850 | $1.61 | 5d | 1 | 0.70mi |
| 860 Douglas Ct Hemet, CA | 2.0 | 2.0 | 1114 | $1,850 | $1.66 | 20d | 1 | 0.74mi |
| 390 Magnolia Cir Hemet, CA | 2.0 | 2.0 | 1038 | $2,400 | $2.31 | 0d | 1 | 0.78mi |
| 390 Magnolia Cir Hemet, CA | 2.0 | 2.0 | 1038 | $2,400 | $2.31 | 5d | 1 | 0.78mi |
| 576 Montecito Ave Unit C Hemet, CA | 2.0 | 2.0 | 861 | $1,850 | $2.15 | 18d | 1 | 0.84mi |
| 1955 Silver Oak Way Hemet, CA | 3.0 | 2.0 | 1318 | $2,250 | $1.71 | 45d | 1 | 0.87mi |
| 409 E Thornton Ave Hemet, CA | 2.0 | 1.0 | 970 | $1,925 | $1.98 | 0d | 1 | 0.91mi |
| 678 Monterey Pl Hemet, CA | 2.0 | 2.0 | 1047 | $1,995 | $1.91 | 45d | 1 | 0.92mi |
| 700 Johnston Ave Unit 708 Hemet, CA | 2.0 | 1.0 | 1000 | $1,600 | $1.60 | 9d | 1 | 0.94mi |
| 640 Vista del Monte Hemet, CA | 3.0 | 2.0 | 1480 | $2,650 | $1.79 | 45d | 1 | 0.94mi |
| 1711 Pepper Tree Dr Hemet, CA | 2.0 | 2.0 | 864 | $1,675 | $1.94 | 23d | 1 | 0.95mi |
| 683 Jonquil St Hemet, CA | 3.0 | 2.0 | 1150 | $2,448 | $2.13 | 25d | 1 | 0.99mi |
| 1096 Burton St Hemet, CA | 3.0 | 2.5 | 1477 | $2,595 | $1.76 | 0d | 1 | 1.00mi |
| 2098 W Acacia Ave Hemet, CA | 1.0–3.0 | 1.0–2.0 | 895 | $2,035 | $2.27 | 0d | 1 | 1.04mi |
| 1315 W Latham Ave Hemet, CA | 3.0 | 2.5 | 1340 | $2,550 | $1.90 | 45d | 1 | 1.10mi |
| 165 N Hamilton Ave Unit 3 Hemet, CA | 1.0 | 1.0 | 768 | $1,450 | $1.89 | 6d | 1 | 1.10mi |
| 165 N Hamilton Ave Unit 4 Hemet, CA | 1.0 | 1.0 | 768 | $1,525 | $1.99 | 23d | 1 | 1.10mi |
| 2403 W Acacia Ave Hemet, CA | 2.0 | 2.0 | 910 | $1,995 | $2.19 | 9d | 1 | 1.16mi |
| 2469 W Acacia Ave Hemet, CA | 2.0 | 2.0 | 910 | $1,750 | $1.92 | 25d | 1 | 1.17mi |
| 250 N Elk St Hemet, CA | 2.0 | 1.0 | 900 | $1,625 | $1.81 | 15d | 1 | 1.20mi |
| 733 S San Jacinto St Unit B Hemet, CA | 2.0 | 1.0 | 1000 | $1,500 | $1.50 | 25d | 1 | 1.28mi |
| 1354 Jasmine Way Hemet, CA | 2.0 | 2.0 | 1440 | $1,650 | $1.15 | 45d | 1 | 1.31mi |
HOA detail
- Monthly dues
- $185 · $2,220/yr
- Likely covers
- pool
Listing history 24 events
-
2026-06-21days on market $172,900 Active 74 DOM
-
2026-06-18days on market $172,900 Active 71 DOM
-
2026-06-17days on market $172,900 Active 70 DOM
-
2026-06-16days on market $172,900 Active 69 DOM
-
2026-06-15days on market $172,900 Active 68 DOM
-
2026-06-13days on market $172,900 Active 66 DOM
-
2026-06-09days on market $172,900 Active 62 DOM
-
2026-06-08days on market $172,900 Active 61 DOM
-
2026-06-07days on market $172,900 Active 60 DOM
-
2026-06-04days on market $172,900 Active 57 DOM
-
2026-06-03days on market $172,900 Active 56 DOM
-
2026-06-02days on market $172,900 Active 55 DOM
-
2026-06-01days on market $172,900 Active 54 DOM
-
2026-05-31days on market $172,900 Active 53 DOM
-
2026-04-23price $172,900 621-char remark
Show marketing remark (621 chars)
Welcome to this charming 2-bedroom, 2-bath home offering comfort and convenience in every corner. Step into a spacious living room that flows seamlessly into the dining area—perfect for entertaining family and friends. Outside, enjoy your own private orchard featuring 4 fruit-bearing trees: orange, lemon, grapefruit, and fig. A wonderful opportunity to savor fresh-picked fruit right from your backyard. Don’t miss this delightful home! The HOA includes swimming pools, spas, pickle ball courts, a dog park. Freshly painted and new carpet. Please use booties provided in laundry room before enrty into home.
-
2026-04-08$183,000 Active 621-char remark
Show marketing remark (621 chars)
Welcome to this charming 2-bedroom, 2-bath home offering comfort and convenience in every corner. Step into a spacious living room that flows seamlessly into the dining area—perfect for entertaining family and friends. Outside, enjoy your own private orchard featuring 4 fruit-bearing trees: orange, lemon, grapefruit, and fig. A wonderful opportunity to savor fresh-picked fruit right from your backyard. Don’t miss this delightful home! The HOA includes swimming pools, spas, pickle ball courts, a dog park. Freshly painted and new carpet. Please use booties provided in laundry room before enrty into home.
-
2026-01-22historical
-
2026-01-17status Active
-
2025-09-04$195,000 Active
-
2025-09-04historical
-
2025-09-03$195,000 Active
-
2008-11-05soldstatus $45,000
-
1987-04-24soldstatus $24,000
-
1984-05-22soldstatus $24,000
ⓘ Source: listings_history table (triggers on properties + properties_extension) + one-shot
backfill from property_details.listing_events for pre-trigger history.
Tax reassessment forecast CA · Resets to sale price
- Current annual tax
- $1,171 · $98/mo
- Projected year-2 tax
- $1,314 · $110/mo
- Expected delta
- +$143/yr (+$12/mo · 12.2%)
ⓘ Screening estimate from a state-policy table — verify with the county assessor before closing.
Climate risk First Street
- Flood 1/10 Low FEMA zone X (shaded) · 0% chance over 30 yrs
- Wildfire 6/10 Major
- Heat 7/10 Severe 6 d/yr ≥104°F today · 16 d/yr by 30 yrs out
- Wind 1/10 Low
- Air quality 6/10 Major 9 unhealthy d/yr today · 11 by 30 yrs out
Nearby sold comps map
Loading sold comps map…
Walkable amenities ~0.75 mi
Loading nearby amenities…
Taxation est. · year 1
- Rental income
- $22,361
- − Mortgage interest
- −$9,685
- − Property taxes
- −$1,171
- − Insurance
- −$864
- − Repairs & maintenance
- −$1,789
- − Management
- −$1,789
- − HOA
- −$2,220
- − Depreciation
- −$5,030
- Taxable loss
- −$187
- Est. tax savings @ 24.0%
- +$45
- After-tax cash flow
- $2,574/yr
For passive investors: Depreciation is non-cash, so a rental often shows a tax loss while cash-flowing — sheltering income. Rental losses are passive: they offset passive income freely, and up to $25,000/yr can offset ordinary (W-2) income if you actively participate and your MAGI is under $100k (phasing out to $0 by $150k); unused losses carry forward. On sale, claimed depreciation is recaptured at up to 25%, and gains may owe capital-gains tax (a 1031 exchange can defer both). Figures are a year-1 estimate at your 24.0% rate — not tax advice; consult a CPA.
Schools (NCES district)
- District
- Hemet Unified
- NCES district ID
- 0616920
- Math proficiency
- 19% ▼ -3.00%
- Reading proficiency
- 41% ▲ 4.00%
- Median HH income
- $39,962
- Composite
- 25.16/100
- National rank
- #7517
- State rank
- #360 of 517 in CA
Livability — Hemet
- Score
- 51/100
- State rank
- #1056
- US rank
- #25208
Category grades
Schools grade is shown separately in the Schools card above.
Census & demographics
- Census place
- Hemet, CA
- County
- Riverside County · 2,287,001 people
- City population
- 137,670
- Metro
- Riverside-San Bernardino-Ontario, CA
- Population (ZIP)
- 39,937
- Household income
- $49,396
- Rent vs Own
- Severe rent burden
- 2144.0
Population outlook (Riverside County) Hauer SSP2
- Today (2025)
- 2,664,475 people
- By 2030
- 2,802,692 · +5.2%
- By 2040
- 3,050,904 · +14.5%
- By 2050
- 3,256,783 · +22.2%
- By 2075
- 3,655,058 · +37.2%
- By 2100
- 3,766,594 · +41.4%
Race, ethnicity, and origin ACS 2023
- Neighborhood character
- Diverse neighborhood (Simpson 0.61)
- Race & ethnicity
- Hispanic / Latino 54% White 30% Two or more races 18% Black 10% Native American 2% Asian 2%
- Hispanic origin (detail)
- Mexican 48% Puerto Rican 1%
- Common ancestry
- Slovak 1% Romanian 1% Portuguese 1%
- Foreign-born
- 21% · Canada
- Languages at home
- 59% English-only · Spanish 38% Arabic 1% Tagalog/Filipino 1%
Political lean MEDSL · Riverside
- 2024 margin
- Toss-up / Even · D 48.0% · R 49.3% · Other 2.6%
- 2008→2024 swing
- -3.6pp toward R · 2008: 2.3pp · 2024: -1.3pp
- All cycles
- 2024: R+1.3 2020: D+8.0 2016: D+4.3 2012: R+0.4 2008: D+2.3
Not yet ingested
- Civics
- —
Market trends
- HPI YoY
- ▼ -147.46%
- Current HPI
- 405.1277
- Rent YoY
- ▲ 1.76%
- Metro
- Riverside-San Bernardino-Ontario, CA
- State GDP YoY
- ▲ 3.21%
- F500 in state
- 116
Industry mix (Fortune 500 HQ in CA)
| Industry | F500 HQs | Revenue |
|---|---|---|
| Technology | 27 | $1,492B |
|
||
| Financial Services | 3 | $174B |
|
||
| Retail | 3 | $44B |
|
||
| Insurance | 3 | $26B |
|
||
| Media / Entertainment | 2 | $115B |
|
||
| Pharmaceuticals / Biotech | 2 | $62B |
|
||
Price history
+620.4% since first listed10 events — show timeline
- 2026-04-23 Price Changed $172,900 CRMLS
- 2026-04-08 Listed $183,000 CRMLS
- 2026-01-22 Listing Removed — CRMLS
- 2026-01-17 Relisted — CRMLS
- 2025-09-04 Listing Removed — CRMLS
- 2025-09-04 Listed $195,000 CRMLS
- 2025-09-03 Listed $195,000 CRMLS
- 2008-11-05 Sold (Public Records) $45,000 Public Records
- 1987-04-24 Sold (Public Records) $24,000 Public Records
- 1984-05-22 Sold (Public Records) $24,000 Public Records
Property tax history
+3.0%/yrLatest (2025): $1,171 · +16.4% YoY. Source: county tax records.
Cash-flow waterfall
monthlySold comps — $/sqft
last 12 mo · ≤1 miLoading sold comps…