 8-Plex
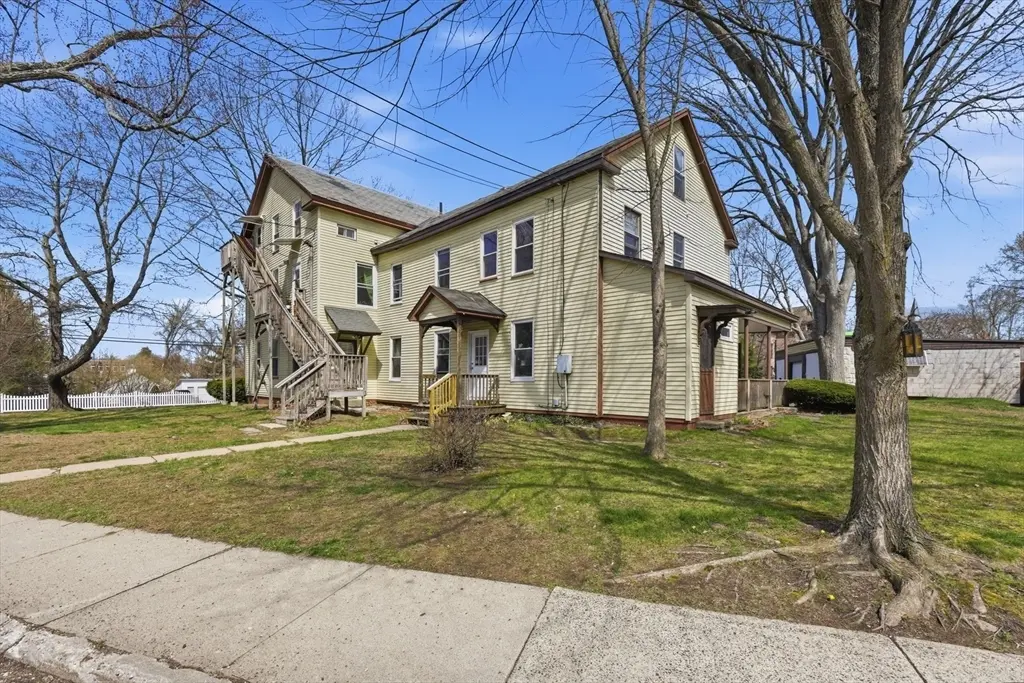
17 Adams St · Easthampton, MA
Flood risk 1/10 · Minimal
- FEMA flood zone
- X
- Chance of flooding over 30 yrs
- 0.0%
- Est. flood insurance / yr
- $507 – $1,088
Fire risk 3/10 · Minor
- Est. fire insurance / yr
- $915 – $1,699
Heat risk 4/10 · Minor
- Hot days now (above 96°F)
- 7 days/yr
- Hot days in 30 yrs
- 17 days/yr
Wind risk 4/10 · Minor
- Chance of severe wind over 30 yrs
- 19.0%
Air-quality risk 2/10 · Minimal
- Unhealthy air days now
- 1 days/yr
- Unhealthy air days in 30 yrs
- 1 days/yr
Risk factors via First Street. Map © Google.
Why this score? — see what drove the B- grade
The composite is a weighted blend of 9 inputs, each scored 0–100. Each bar is that input's sub-score; the figure is the points it added to the 100-point composite (weight × sub-score).
- Cash flow +30.0/30.0
- 1% rule +10.0/10.0
- DSCR +10.0/10.0
- ARV discount +7.5/15.0
- Schools +3.2/10.0
- Rent growth +2.5/5.0
- Livability +2.5/5.0
- Condition / age +2.5/5.0
- Appreciation +0.0/10.0
$1,195,000
🖨 Deal sheet 📄 Offer letter ✓ Due diligence
Multi-family units
County records classify this as Multi-Family (5+ Unit). Listing-text estimate: 8 units. confirmed
5+ unit building — per-unit beds/baths from public records are typically unavailable; the breakdown below (if shown) is an estimate from the listing text.
Listing remarks MLS
Income producing 8-family home with detached 3-bay garage , located on an almost half an acre corner lot ! The property is fully occupied, and the 3 garage bays are rented as well, offering additional income. The apartments have separate heat, hot water and electricity and there is plenty of off-street parking. This is a great opportunity to own a great rental property in a desirable town and convenient location, close to shops, restaurants. and other Easthampton attractions!
Key facts
- Off-street parking
- Corner lot
- 0.45 acre lot
Tags
Neighborhood map
What this means for you Summary
Snapshot
- This is a 8 × 10-bed/8.0-bath units multifamily listed at $1.20M.
Deal economics
- At list price, monthly cash flow is $14k ($168k/yr) — positive. Per door: $2k/mo.
- The deal already cash-flows at list — no discount required.
- Meets the 1% rule at list price ($27k rent vs $1.20M).
- Recommended offer: $1.12M (6.0% below list) — sets the bar for market timing.
Location & tenants
- Location reads: area grade B — affects rentability + tenant quality, not the cash-flow math above.
- Easthampton (suburban): math 27% / reading 47% proficiency, ranked #219 of 302 in MA (top 72%) — families likely to look elsewhere, expect single-tenant / working-renter base with shorter leases.
- Market conditions: 22 active listings in the ZIP; 349 units permitted in Hampshire County in 2024 (185 in 5+ unit buildings).
Forward outlook
- Local home prices are declining (-3.0%/yr); year-one equity from $8k of loan paydown is wiped out by about $36k of value loss. Plan a longer hold.
- Hampshire County population projected at +5% by 2050 — modest demand growth; plan on rents tracking national, not racing it.
- At projected returns (-3.0% appreciation + 3.0% rent growth), your $335k cash investment doubles in ~3 years — after that, you're playing with house money.
Negotiation context
- It's been on market 62 days — a 6% lower offer ($1.12M) is reasonable based on typical stale-listing flexibility.
- 5 sale attempts since 31y ago with the ask held roughly flat each time — persistent listings suggest the price (not the market) is what's stuck; bring a comps-based counter.
- Current owner paid $897k; 33% above their basis — modest negotiation headroom, anchor on the comps not their cost.
Risks & watch-outs
- Watch-outs: built in 1885 — expect roof / HVAC / electrical / plumbing capex.
Questions for the listing agent
- It's been on market 62 days. Have you received any prior offers? Is the seller open to a 6% concession, seller financing, or rate buy-down credit?
- Can we see the unit-by-unit rent roll, current vacancy, and any below-market leases? What's the average tenancy length?
- What capital expenditures (roof, boiler, parking lot, exteriors) have been made in the last 5 years, and what's planned in the next 2?
- Built in 1885 — when were the roof, HVAC, electrical panel, plumbing, and water heater last replaced?
- Why hasn't it sold? Are there any deal-killer items the seller is aware of (foundation, flood, title, zoning, code violations)?
- Is there a deadline driving the sale (1031 exchange, divorce, estate, relocation)? That informs how much negotiation room exists.
- What's the average days-on-market for RENTAL listings here right now (not sales)? A rising rental-DOM trend means longer vacancies and softer asking-rent achievability than the comps imply.
- What's the recent tenant-quality profile in this submarket — average credit score on applications, eviction rate, late-payment / NSF rate, and stable-employment percentage? A property-management company in the area should have these aggregated.
- How much new apartment / multifamily construction is in the pipeline within 1–3 miles? Heavy new supply (>2% of stock underway) typically softens rents 12–24 months out; light construction supports rent growth.
Investment metrics
- 1% rule
- 2.27% ✓
- Cap rate
- 20.39%
- Cash-on-cash
- 50.35%
- DSCR
- 3.24
- GRM
- 3.7
CMA / ARV
- ARV (median comp)
- $703,554
- List price
- $1,195,000
- Delta
- 69.85%
- Verdict
- OVERPRICED
- Comps
- 8 within 1.0 mi
Projected returns pro-forma
-3.0% appreciation · 3.0% rent growth · sell at horizon
- IRR
- 48.1%
- Equity multiple
- 3.09×
- Total profit
- $700,446
- Equity at exit
- $178,178
- IRR
- 53.7%
- Equity multiple
- 6.26×
- Total profit
- $1,760,889
- Equity at exit
- $103,322
Cash invested: $334,600 (down + closing). Projections, not guarantees.
Landlord ↔ Tenant lean methodology
- Overall (STATE)
- 20 Strongly Tenant-Friendly
- State Massachusetts
- 20 Strongly Tenant-Friendly · D+15
- County
- — inherits STATE
- City
- — inherits STATE
ZIP-level market 01027
- Active inventory
- 22
- Price-to-rent
- 29.4×
Monthly cashflow live
- Estimated rent
- $27,139 medium interval (Pro) →
- Mortgage (P&I)
- −$6,267
- Tax from tax record
- −$635 /mo · $7,624/yr
- Insurance
- −$498
- HOA
- −$0
- Vacancy / Maint / Mgmt
- −$5,699
- Net cashflow
- $14,040
Break-even live
8-unit breakdown (identical units grouped — click to expand)
| Units | Beds | Baths | Est. rent |
|---|---|---|---|
| 8× units | 10 | 8 | $27,136 |
| #1 | 10 | 8 | $3,392 |
| #2 | 10 | 8 | $3,392 |
| #3 | 10 | 8 | $3,392 |
| #4 | 10 | 8 | $3,392 |
| #5 | 10 | 8 | $3,392 |
| #6 | 10 | 8 | $3,392 |
| #7 | 10 | 8 | $3,392 |
| #8 | 10 | 8 | $3,392 |
| Total (8 units) | $27,139 | ||
UW: 25.0% down · 7.5% · 30yr · 1.5% tax · 5.0% vac · 8.0% maint · 8.0% mgmt
Financing live
Cash to close
- Down payment
- $298,750
- Closing costs
- $35,850
- Reserves months
- —
- Total cash needed
- —
Loan-product check · same deal, 3 products live
Conventional
25% down · 7.5% · 30yr
- Down + closing
- —
- Monthly P&I
- —
- Monthly cashflow
- —
- DSCR
- —
- Eligible?
- —
Personal DTI + credit; lowest rate.
DSCR
20% down · 8.5% · 30yr
- Down + closing
- —
- Monthly P&I
- —
- Monthly cashflow
- —
- DSCR
- —
- Eligible?
- —
No personal income docs; deal must DSCR.
Hard money
10% down · 12.0% · 12mo
- Down + closing
- —
- Monthly P&I
- —
- Monthly cashflow
- —
- DSCR
- —
- Eligible?
- —
Short-term bridge; refi at stabilization.
Listing history 25 events
-
2026-06-18days on market $1,195,000 Active 62 DOM
-
2026-06-17days on market $1,195,000 Active 61 DOM
-
2026-06-16days on market $1,195,000 Active 60 DOM
-
2026-06-15days on market $1,195,000 Active 59 DOM
-
2026-06-14days on market $1,195,000 Active 57 DOM
-
2026-06-10days on market $1,195,000 Active 54 DOM
-
2026-06-09days on market $1,195,000 Active 53 DOM
-
2026-06-08days on market $1,195,000 Active 52 DOM
-
2026-06-07days on market $1,195,000 Active 51 DOM
-
2026-06-03days on market $1,195,000 Active 47 DOM
-
2026-06-02days on market $1,195,000 Active 46 DOM
-
2026-06-01days on market $1,195,000 Active 45 DOM
-
2026-05-31days on market $1,195,000 Active 44 DOM
-
2026-05-30days on market $1,195,000 Active 43 DOM
-
2026-04-16$1,195,000 New 481-char remark
Show marketing remark (481 chars)
Income producing 8-family home with detached 3-bay garage , located on an almost half an acre corner lot ! The property is fully occupied, and the 3 garage bays are rented as well, offering additional income. The apartments have separate heat, hot water and electricity and there is plenty of off-street parking. This is a great opportunity to own a great rental property in a desirable town and convenient location, close to shops, restaurants. and other Easthampton attractions!
-
2026-04-16$1,195,000 Active 481-char remark
Show marketing remark (481 chars)
Income producing 8-family home with detached 3-bay garage , located on an almost half an acre corner lot ! The property is fully occupied, and the 3 garage bays are rented as well, offering additional income. The apartments have separate heat, hot water and electricity and there is plenty of off-street parking. This is a great opportunity to own a great rental property in a desirable town and convenient location, close to shops, restaurants. and other Easthampton attractions!
-
2021-11-16soldstatus $896,700 Sold
-
2021-08-11status Under Agreement
-
2021-07-26$950,000 New
-
2007-07-30soldstatus $425,000
-
2007-07-30soldstatus $425,000
-
2007-04-30$459,900
-
2003-06-26soldstatus $326,000
-
1995-11-30soldstatus $202,000
-
1995-03-13$219,000
ⓘ Source: listings_history table (triggers on properties + properties_extension) + one-shot
backfill from property_details.listing_events for pre-trigger history.
Tax reassessment forecast MA · Partial reset (capped growth)
- Current annual tax
- $7,624 · $635/mo
- Projected year-2 tax
- $11,161 · $930/mo
- Expected delta
- +$3,537/yr (+$295/mo · 46.4%)
ⓘ Screening estimate from a state-policy table — verify with the county assessor before closing.
Climate risk First Street
- Flood 1/10 Low FEMA zone X · 0% chance over 30 yrs
- Wildfire 3/10 Moderate
- Heat 4/10 Moderate 7 d/yr ≥96°F today · 17 d/yr by 30 yrs out
- Wind 4/10 Moderate 19% chance of damaging wind over 30 yrs
- Air quality 2/10 Low 1 unhealthy d/yr today · 1 by 30 yrs out
Nearby sold comps map
Loading sold comps map…
Walkable amenities ~0.75 mi
Loading nearby amenities…
Taxation est. · year 1
- Rental income
- $325,668
- − Mortgage interest
- −$66,939
- − Property taxes
- −$7,624
- − Insurance
- −$5,975
- − Repairs & maintenance
- −$26,053
- − Management
- −$26,053
- − Depreciation
- −$34,764
- Taxable income
- $158,260
- Est. tax owed @ 24.0%
- −$37,982
- After-tax cash flow
- $130,496/yr
For passive investors: Depreciation is non-cash, so a rental often shows a tax loss while cash-flowing — sheltering income. Rental losses are passive: they offset passive income freely, and up to $25,000/yr can offset ordinary (W-2) income if you actively participate and your MAGI is under $100k (phasing out to $0 by $150k); unused losses carry forward. On sale, claimed depreciation is recaptured at up to 25%, and gains may owe capital-gains tax (a 1031 exchange can defer both). Figures are a year-1 estimate at your 24.0% rate — not tax advice; consult a CPA.
Schools (NCES district)
- District
- Easthampton
- NCES district ID
- 2504590
- Math proficiency
- 27% ▼ -17.00%
- Reading proficiency
- 47% ▲ 3.00%
- Median HH income
- $55,625
- Composite
- 32.47/100
- National rank
- #5713
- State rank
- #219 of 302 in MA
Livability — Easthampton
No livability data for this city. (Only ~50 U.S. cities are tracked.)
Census & demographics
- Census place
- Easthampton Town, MA
- Population (ZIP)
- 17,678
Population outlook (Hampshire County) Hauer SSP2
- Today (2025)
- 166,577 people
- By 2030
- 168,928 · +1.4%
- By 2040
- 171,197 · +2.8%
- By 2050
- 175,542 · +5.4%
- By 2075
- 199,884 · +20.0%
- By 2100
- 211,819 · +27.2%
Race, ethnicity, and origin ACS 2023
- Neighborhood character
- Predominantly White (86%)
- Race & ethnicity
- White 86% Two or more races 9% Hispanic / Latino 8% Asian 1%
- Hispanic origin (detail)
- Puerto Rican 4% Dominican 1%
- Common ancestry
- Lithuanian 14% Romanian 13% Russian 2%
- Foreign-born
- 7% · Canada, Jamaica, China
- Languages at home
- 89% English-only · Spanish 5% Other Indo-European 2% German/W. Germanic 1%
Political lean MEDSL · Hampshire
- 2024 margin
- Solid D (+41.9) · D 69.5% · R 27.6% · Other 2.9%
- 2008→2024 swing
- -3.6pp toward R · 2008: 45.6pp · 2024: 41.9pp
- All cycles
- 2024: D+41.9 2020: D+46.8 2016: D+39.5 2012: D+43.8 2008: D+45.6
Not yet ingested
- Civics
- —
Market trends
- HPI YoY
- ▼ -260.63%
- Current HPI
- 277.0125
- Rent YoY
- —
- Metro
- —
- State GDP YoY
- ▲ 2.28%
- F500 in state
- 38
Industry mix (Fortune 500 HQ in MA)
| Industry | F500 HQs | Revenue |
|---|---|---|
| Technology | 3 | $17B |
|
||
| Insurance | 2 | $84B |
|
||
| Retail | 2 | $76B |
|
||
| Life Sciences | 1 | $43B |
|
||
| Energy Technology | 1 | $31B |
|
||
| Aerospace / Defense | 1 | $18B |
|
||
Price history
+445.7% since first listed11 events — show timeline
- 2026-04-16 Listed $1,195,000 BCMLS
- 2026-04-16 Listed $1,195,000 MLS PIN
- 2021-11-16 Sold (MLS) $896,700 MLS PIN
- 2021-08-11 Pending — MLS PIN
- 2021-07-26 Listed $950,000 MLS PIN
- 2007-07-30 Sold (Public Records) $425,000 Public Records
- 2007-07-30 Sold (MLS) $425,000 MLS PIN
- 2007-04-30 Listed $459,900 MLS PIN
- 2003-06-26 Sold (Public Records) $326,000 Public Records
- 1995-11-30 Sold (MLS) $202,000 MLS PIN
- 1995-03-13 Listed $219,000 MLS PIN
Property tax history
+4.0%/yrLatest (2023): $7,624 · -11.4% YoY. Source: county tax records.
Cash-flow waterfall
monthlySold comps — $/sqft
last 12 mo · ≤1 miLoading sold comps…