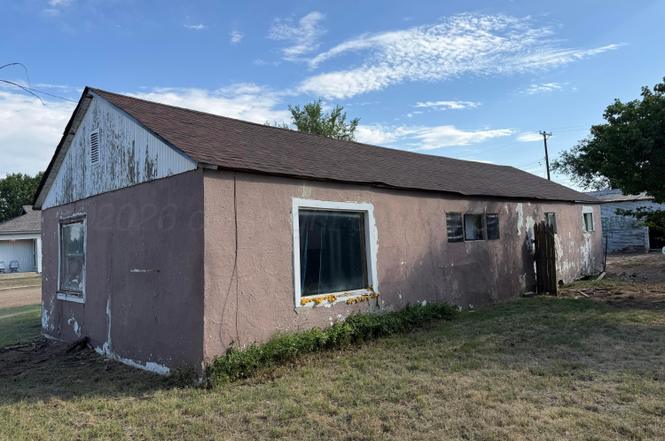
407 W Elm St · Fritch, TX
Flood risk 3/10 · Minor
- FEMA flood zone
- —
- Chance of flooding over 30 yrs
- 0.2%
- Est. flood insurance / yr
- —
Fire risk 10/10 · Severe
- Est. fire insurance / yr
- $1,222 – $2,270
Heat risk 5/10 · Moderate
- Hot days now (above 99°F)
- 7 days/yr
- Hot days in 30 yrs
- 19 days/yr
Wind risk 2/10 · Minimal
- Chance of severe wind over 30 yrs
- —
Air-quality risk 2/10 · Minimal
- Unhealthy air days now
- 1 days/yr
- Unhealthy air days in 30 yrs
- 1 days/yr
Risk factors via First Street. Map © Google.
Why this score? — see what drove the D grade
The composite is a weighted blend of 9 inputs, each scored 0–100. Each bar is that input's sub-score; the figure is the points it added to the 100-point composite (weight × sub-score).
- Cash flow +15.0/30.0
- ARV discount +7.5/15.0
- 1% rule +5.0/10.0
- DSCR +5.0/10.0
- Livability +3.6/5.0
- Schools +3.4/10.0
- Rent growth +2.5/5.0
- Condition / age +2.5/5.0
- Appreciation +0.0/10.0
$12,500
🖨 Deal sheet 📄 Offer letter ✓ Due diligence
Listing remarks
FANTASTIC INVESTOR OPPORTUNITY! Corner lot, Home is cleaned out & ready to put back together as small home or HIGH DEMAND RENTAL It would also be a great weekenderfor GORGEOUS LAKE MEREDITH, easily store your boat, camper and other toys. HUGE detached double garage has a shop area or creat a fish cleaning station. Price for a super quick sale and will only sell ''AS IS''.
Key facts
- Corner lot
- 8,400 sq ft lot
- 2 garage spots
Tags
Property features AI
Finance
- Other: Zoning: 7000 series
- Financial info: Financial details not specified
- HOA & community: Community includes lake
Exterior
- Parking: Detached garage; Garage faces front; 2 garage spaces; RV access/parking
- Security: Security details not specified
- Utilities: Public water; Public sewer
- Home design: Single-family residence; One story; North-facing
- Construction: Stucco and frame construction; Composition roof; Year built not specified; Foundation details not specified
- Exterior features: Corner lot; Lot dimensions approximately 60 x 140; Workshop on property; Lake on/near property
Interior
- Kitchen: Kitchen details not specified
- Bedrooms: Bedrooms not specified
- Flooring: Flooring details not specified
- Bathrooms: 1 full bathroom
- Heating & cooling: Heating and cooling details not specified
- Interior features: Lake view/near lake
- Laundry & utility: Laundry details not specified
Neighborhood map
What this means for you Summary
Snapshot
- This is a 2-bed/1.0-bath single-family listed at $12k.
Deal economics
- At list price, monthly cash flow is $597 ($7k/yr) — positive.
- The deal already cash-flows at list — no discount required.
- Meets the 1% rule at list price ($888 rent vs $12k).
Location & tenants
- Location reads 71/100 on livability (#329 in TX) — a middle-class / working-renter tenant base. Strengths: cost of living A+, housing A+, crime A; Watch: employment C-, schools D-, amenities F.
- Sanford-Fritch ISD (town): math 36% / reading 43% proficiency, ranked #417 of 826 in TX (top 50%) — families likely to look elsewhere, expect single-tenant / working-renter base with shorter leases.
- Market conditions: 41 active listings in the ZIP; 2 units permitted in Hutchinson County in 2024 (0 in 5+ unit buildings).
Forward outlook
- Local home prices are declining (-3.0%/yr); year-one equity from $86 of loan paydown is wiped out by about $375 of value loss. Plan a longer hold.
- At projected returns (-3.0% appreciation + 3.0% rent growth), your $4k cash investment doubles in ~1 year — after that, you're playing with house money.
Negotiation context
- Only 9 days on market — expect competitive offers; lowballing is unlikely to land.
Risks & watch-outs
- Watch-outs: property tax is 3.3% of price.
- Climate carrying-cost: severe wildfire risk; extreme-heat days projected 7→19/yr by 2055 (HVAC capex compounding) — expect insurance premiums to compound above CPI over the hold.
Questions for the listing agent
- Property tax is high relative to price — has the assessment been appealed recently, and will the sale trigger a re-assessment?
- Is there a deadline driving the sale (1031 exchange, divorce, estate, relocation)? That informs how much negotiation room exists.
- Schools are D-rated, which usually means shorter tenancies and higher turnover. Who's the typical renter profile here, and what's been the actual vacancy rate?
- The area grade is low — what's the realistic commute time and amenity access for the typical tenant pool here? Any planned neighborhood developments (good or bad) we should know about?
- What's the average days-on-market for RENTAL listings here right now (not sales)? A rising rental-DOM trend means longer vacancies and softer asking-rent achievability than the comps imply.
- What's the recent tenant-quality profile in this submarket — average credit score on applications, eviction rate, late-payment / NSF rate, and stable-employment percentage? A property-management company in the area should have these aggregated.
- How much new for-sale + rental construction is in the pipeline within 1–3 miles? Heavy new supply typically softens prices + rents 12–24 months out; constrained supply supports both.
Investment metrics
- 1% rule
- 7.11% ✓
- Cap rate
- 63.58%
- Cash-on-cash
- 204.61%
- DSCR
- 10.10
- GRM
- 1.2
CMA / ARV
No comps found within radius.
Projected returns pro-forma
-3.0% appreciation · 3.0% rent growth · sell at horizon
- IRR
- —
- Equity multiple
- 11.29×
- Total profit
- $36,009
- Equity at exit
- $1,864
- IRR
- —
- Equity multiple
- 23.97×
- Total profit
- $80,401
- Equity at exit
- $1,081
Cash invested: $3,500 (down + closing). Projections, not guarantees.
Landlord ↔ Tenant lean methodology
- Overall (STATE)
- 87 Strongly Landlord-Friendly
- State Texas
- 87 Strongly Landlord-Friendly · R+5
- County
- — inherits STATE
- City
- — inherits STATE
ZIP-level market 79036
- Active inventory
- 41
- Price-to-rent
- 1.2×
Monthly cashflow live
- Estimated rent
- $888 medium interval (Pro) →
- Mortgage (P&I)
- −$66
- Tax from tax record
- −$34 /mo · $412/yr
- Insurance
- −$5
- HOA
- −$0
- Vacancy / Maint / Mgmt
- −$187
- Net cashflow
- $597
Break-even live
UW: 25.0% down · 7.5% · 30yr · 1.5% tax · 5.0% vac · 8.0% maint · 8.0% mgmt
Financing live
Cash to close
- Down payment
- $3,125
- Closing costs
- $375
- Reserves months
- —
- Total cash needed
- —
Loan-product check · same deal, 3 products live
Conventional
25% down · 7.5% · 30yr
- Down + closing
- —
- Monthly P&I
- —
- Monthly cashflow
- —
- DSCR
- —
- Eligible?
- —
Personal DTI + credit; lowest rate.
DSCR
20% down · 8.5% · 30yr
- Down + closing
- —
- Monthly P&I
- —
- Monthly cashflow
- —
- DSCR
- —
- Eligible?
- —
No personal income docs; deal must DSCR.
Hard money
10% down · 12.0% · 12mo
- Down + closing
- —
- Monthly P&I
- —
- Monthly cashflow
- —
- DSCR
- —
- Eligible?
- —
Short-term bridge; refi at stabilization.
Listing history 9 events
-
2026-06-18days on market $12,500 Active 9 DOM
-
2026-06-17days on market $12,500 Active 8 DOM
-
2026-06-16days on market $12,500 Active 7 DOM
-
2026-06-15days on market $12,500 Active 6 DOM
-
2026-06-15days on market $12,500 Active 5 DOM
-
2026-06-13days on market $12,500 Active 4 DOM
-
2026-06-12days on market $12,500 Active 3 DOM
-
2026-06-10remarks 379-char remark
-
2026-06-10$12,500 Active 1 DOM
ⓘ Source: listings_history table (triggers on properties + properties_extension) + one-shot
backfill from property_details.listing_events for pre-trigger history.
Tax reassessment forecast TX · Resets to sale price
- Current annual tax
- $412 · $34/mo
- Projected year-2 tax
- $412 · $34/mo
- Expected delta
- $0/yr ($0/mo · 0.0%)
ⓘ Screening estimate from a state-policy table — verify with the county assessor before closing.
Climate risk First Street
- Flood 3/10 Moderate 20% chance over 30 yrs
- Wildfire 10/10 Extreme
- Heat 5/10 Major 7 d/yr ≥99°F today · 19 d/yr by 30 yrs out
- Wind 2/10 Low
- Air quality 2/10 Low 1 unhealthy d/yr today · 1 by 30 yrs out
Nearby sold comps map
Loading sold comps map…
Walkable amenities ~0.75 mi
Loading nearby amenities…
Taxation est. · year 1
- Rental income
- $10,662
- − Mortgage interest
- −$700
- − Property taxes
- −$412
- − Insurance
- −$62
- − Repairs & maintenance
- −$853
- − Management
- −$853
- − Depreciation
- −$364
- Taxable income
- $7,417
- Est. tax owed @ 24.0%
- −$1,780
- After-tax cash flow
- $5,381/yr
For passive investors: Depreciation is non-cash, so a rental often shows a tax loss while cash-flowing — sheltering income. Rental losses are passive: they offset passive income freely, and up to $25,000/yr can offset ordinary (W-2) income if you actively participate and your MAGI is under $100k (phasing out to $0 by $150k); unused losses carry forward. On sale, claimed depreciation is recaptured at up to 25%, and gains may owe capital-gains tax (a 1031 exchange can defer both). Figures are a year-1 estimate at your 24.0% rate — not tax advice; consult a CPA.
Schools (NCES district)
- District
- Sanford-Fritch ISD
- NCES district ID
- 4839150
- Math proficiency
- 36% ▼ -3.00%
- Reading proficiency
- 43% ▬ 0.00%
- Median HH income
- $49,570
- Composite
- 34.01/100
- National rank
- #5314
- State rank
- #417 of 826 in TX
Livability — Fritch
- Score
- 71/100
- State rank
- #329
- US rank
- #7215
Category grades
Schools grade is shown separately in the Schools card above.
Census & demographics
- Census place
- Fritch, TX
- Population (ZIP)
- 4,957
Population outlook (Hutchinson County) Hauer SSP2
- Today (2025)
- 21,274 people
- By 2030
- 21,089 · -0.9%
- By 2040
- 20,938 · -1.6%
- By 2050
- 20,999 · -1.3%
- By 2075
- 21,433 · +0.7%
- By 2100
- 21,243 · -0.1%
Race, ethnicity, and origin ACS 2023
- Neighborhood character
- Predominantly White (85%)
- Race & ethnicity
- White 85% Hispanic / Latino 9% Two or more races 5% Black 2% Native American 2%
- Hispanic origin (detail)
- Mexican 8%
- Common ancestry
- Italian 3% Romanian 1% Slovak 1%
- Foreign-born
- 0%
- Languages at home
- 95% English-only · Spanish 5%
Political lean MEDSL · Hutchinson
- 2024 margin
- Solid R (+77.2) · D 11.1% · R 88.2%
- 2008→2024 swing
- -8.2pp toward R · 2008: -68.9pp · 2024: -77.2pp
- All cycles
- 2024: R+77.2 2020: R+76.6 2016: R+76.1 2012: R+72.7 2008: R+68.9
Not yet ingested
- Civics
- —
Market trends
- HPI YoY
- ▼ -88.35%
- Current HPI
- 148.285
- Rent YoY
- —
- Metro
- —
- State GDP YoY
- ▲ 3.95%
- F500 in state
- 110
Industry mix (Fortune 500 HQ in TX)
| Industry | F500 HQs | Revenue |
|---|---|---|
| Energy | 16 | $1,198B |
|
||
| Technology | 5 | $198B |
|
||
| Engineering / Construction | 4 | $72B |
|
||
| Energy Services | 3 | $60B |
|
||
| Utilities | 3 | $41B |
|
||
| Healthcare | 2 | $330B |
|
||
Price history
7 events — show timeline
- 2026-06-09 Listed $12,500 AARMLS
- 2023-11-21 Sold (Public Records) — Public Records
- 2001-07-31 Sold (Public Records) — Public Records
- 2001-03-13 Sold (Public Records) — Public Records
- 1999-09-03 Sold (Public Records) — Public Records
- 1992-09-14 Sold (Public Records) — Public Records
- 1992-08-31 Sold (Public Records) — Public Records
Property tax history
-1.0%/yrLatest (2025): $412 · +29.6% YoY. Source: county tax records.
Cash-flow waterfall
monthlySold comps — $/sqft
last 12 mo · ≤1 miLoading sold comps…