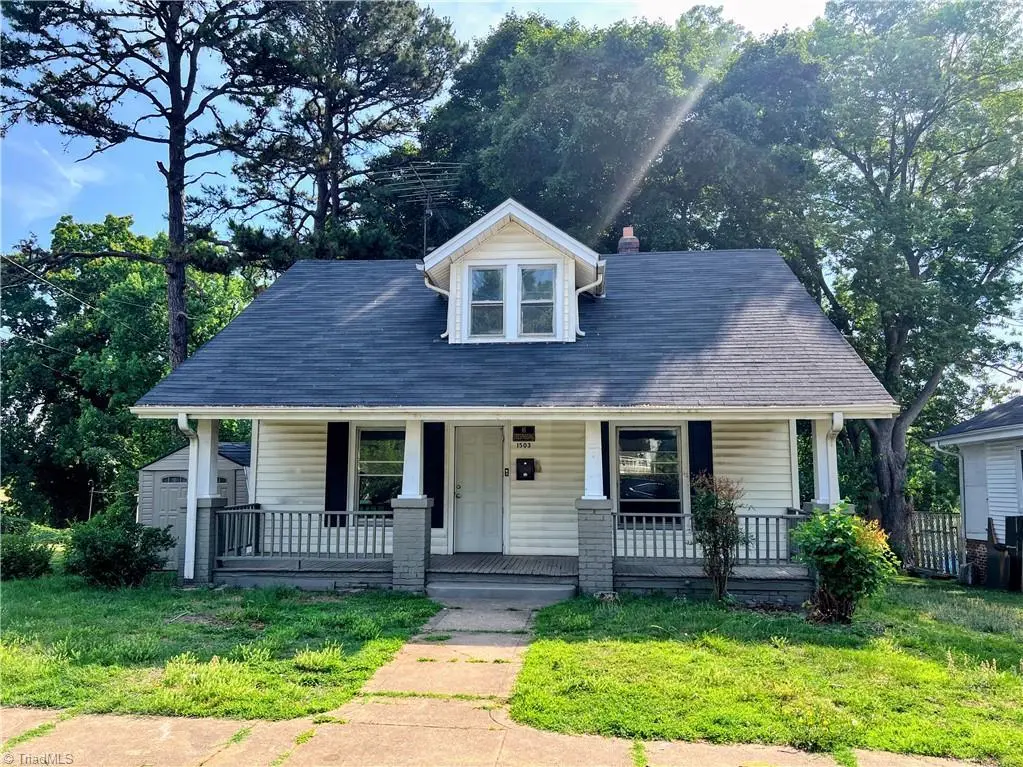
1503 Cloverdale St · High Point, NC
Flood risk 1/10 · Minimal
- FEMA flood zone
- X (unshaded)
- Chance of flooding over 30 yrs
- 0.0%
- Est. flood insurance / yr
- $473 – $860
Fire risk 1/10 · Minimal
- Est. fire insurance / yr
- $906 – $1,684
Heat risk 5/10 · Moderate
- Hot days now (above 103°F)
- 7 days/yr
- Hot days in 30 yrs
- 16 days/yr
Wind risk 4/10 · Minor
- Chance of severe wind over 30 yrs
- 15.0%
Air-quality risk 2/10 · Minimal
- Unhealthy air days now
- 1 days/yr
- Unhealthy air days in 30 yrs
- 1 days/yr
Risk factors via First Street. Map © Google.
Why this score? — see what drove the B- grade
The composite is a weighted blend of 9 inputs, each scored 0–100. Each bar is that input's sub-score; the figure is the points it added to the 100-point composite (weight × sub-score).
- Cash flow +25.0/30.0
- ARV discount +15.0/15.0
- DSCR +8.2/10.0
- 1% rule +5.6/10.0
- Livability +3.9/5.0
- Schools +3.6/10.0
- Rent growth +3.4/5.0
- Condition / age +2.5/5.0
- Appreciation +0.0/10.0
$115,000
🖨 Deal sheet 📄 Offer letter ✓ Due diligence
Listing remarks
Investor Special with Endless Potential! This 3-bedroom, 1-bath home offers a great opportunity for investors, flippers, or owner-occupants looking to add value. Situated on a spacious lot with a generous backyard, the property features solid bones and plenty of upside. Whether you're seeking your next fix-and-flip project, a long-term rental investment, or a home to renovate and make your own, this property checks all the boxes. Priced aggressively for a quick sale, don't miss this chance to capitalize on a great investment opportunity!
Key facts
- 6,969 sq ft lot
- Built 1913
- Listed 8 days
Property features AI
Finance
- HOA & community: Associated with High Point (no homeowners association required)
Exterior
- Parking: Driveway
- Utilities: Public sewer; Electric water heater
- Home design: Residential stick/site-built house; One and one-half stories; Built in 1913; Existing structure
- Construction: Vinyl and wood siding; Crawl space foundation
- Exterior features: Public water source; Publicly maintained road; Lot approximately 0.16 acre with dimensions 148 x 58 x 126 x 52; No pool
Interior
- Kitchen: Electric water heater
- Bedrooms: Primary on main
- Bathrooms: 1 full bathroom
- Heating & cooling: Wood heating (wood fuel); No central air conditioning
- Interior features: Primary bedroom located on the main level; Two fireplaces located in the den and living room
Neighborhood map
What this means for you Summary
Snapshot
- This is a 3-bed/1.0-bath single-family listed at $115k.
Deal economics
- At list price, monthly cash flow is $251 ($3k/yr) — positive.
- The deal already cash-flows at list — no discount required.
- Meets the 1% rule at list price ($1k rent vs $115k).
- Cap rate 8.9% vs local median 4.0% in High Point — top-decile yield for the area; either an underpriced asset or a hidden risk that comps aren't pricing in. Stress-test before assuming the spread holds.
Location & tenants
- Location reads 77/100 on livability (#31 in NC, #3,084 nationally) — a middle-class / working-renter tenant base. Strengths: commute A+, cost of living A+, housing A+; Watch: schools D+, amenities D, employment D.
- Guilford County Schools (urban): math 39% / reading 45% proficiency, ranked #99 of 178 in NC (top 56%) — families likely to look elsewhere, expect single-tenant / working-renter base with shorter leases.
- Market conditions: Rents rising (+3.6%/yr); 128 active listings in the ZIP; 8 comparable units currently listed for rent nearby; rentals at typical pace (median 24d on market — plan ~3-4 weeks tenant-placement turnaround); lower-income renter base — watch delinquency; 3,843 units permitted in Guilford County in 2024 (2,397 in 5+ unit buildings).
- This rent runs 34% of the median local income ($42k/yr) — at the standard rent-burdened threshold; future hikes will face affordability resistance.
Forward outlook
- Local home prices are declining (-3.0%/yr); year-one equity from $795 of loan paydown is wiped out by about $3k of value loss. Plan a longer hold.
- Guilford County population projected at +26% by 2050 — long-run rental-demand tailwind backs the buy-and-hold thesis.
Negotiation context
- Only 8 days on market — expect competitive offers; lowballing is unlikely to land.
- Current owner paid $52k; list at $115k implies a 121% gain — meaningful room to come down on a strong offer.
Risks & watch-outs
- Watch-outs: built in 1913 — expect roof / HVAC / electrical / plumbing capex.
- Climate carrying-cost: extreme-heat days projected 7→16/yr by 2055 (HVAC capex compounding) — expect insurance premiums to compound above CPI over the hold.
Questions for the listing agent
- Built in 1913 — when were the roof, HVAC, electrical panel, plumbing, and water heater last replaced?
- Is there a deadline driving the sale (1031 exchange, divorce, estate, relocation)? That informs how much negotiation room exists.
- Schools are D-rated, which usually means shorter tenancies and higher turnover. Who's the typical renter profile here, and what's been the actual vacancy rate?
- Crime grade is F in this area — have there been break-ins, vandalism, or insurance claims at this property in the last 3 years? What carrier currently insures it and at what premium?
- What's the average days-on-market for RENTAL listings here right now (not sales)? A rising rental-DOM trend means longer vacancies and softer asking-rent achievability than the comps imply.
- What's the recent tenant-quality profile in this submarket — average credit score on applications, eviction rate, late-payment / NSF rate, and stable-employment percentage? A property-management company in the area should have these aggregated.
- How much new for-sale + rental construction is in the pipeline within 1–3 miles? Heavy new supply typically softens prices + rents 12–24 months out; constrained supply supports both.
Investment metrics
- 1% rule
- 1.06% ✓
- Cap rate
- 8.91%
- Cash-on-cash
- 9.35%
- DSCR
- 1.42
- GRM
- 7.9
CMA / ARV
- ARV (on-the-fly)
- $210,066
- Comps found
- 12
Show comp detail 12 sales within ~0.75 mi
| Address | Dist | Beds/Ba | Sqft | Sold | Price | $/sf | Match |
|---|---|---|---|---|---|---|---|
| 705 Wise Ave | 0.69mi | 3/2.0 | 1,288 (-4%) | 1mo | $125,000 | $97 | 57 |
| 537 Flint Ave | 0.40mi | 3/2.0 | 1,150 (-14%) | 1mo | $207,500 | $180 | 53 |
| 700 Vail Ave | 0.68mi | 3/2.0 | 1,304 (-2%) | 9mo | $190,000 | $146 | 52 |
| 707 Park St | 0.67mi | 3/2.0 | 1,262 (-6%) | 7mo | $224,900 | $178 | 49 |
| 429 Tate St | 0.72mi | 3/2.5 | 1,410 (+5%) | 4mo | $225,000 | $160 | 48 |
| 801 Amos St | 0.71mi | 3/2.5 | 1,250 (-7%) | 6mo | $200,000 | $160 | 45 |
| 507 E Grimes Ave | 0.71mi | 3/2.5 | 1,460 (+9%) | 3mo | $229,900 | $157 | 43 |
| 608 Vail Ave | 0.67mi | 3/2.5 | 1,483 (+11%) | 4mo | $200,000 | $135 | 42 |
| 800 George Pl | 0.68mi | 3/2.5 | 1,483 (+11%) | 6mo | $200,000 | $135 | 39 |
| 625 Fairview St | 0.56mi | 3/2.0 | 1,144 (-14%) | 9mo | $175,000 | $153 | 38 |
| 909 Sharon St | 0.69mi | 3/2.0 | 1,164 (-13%) | 5mo | $218,000 | $187 | 38 |
| 423 Tate St | 0.75mi | 4/2.0 (+1) | 1,536 (+15%) | 3mo | $188,000 | $122 | 29 |
Match score weights: distance 35% · size 25% · config 20% · recency 20%. Top-matched comps best support the ARV.
Projected returns pro-forma
-3.0% appreciation · 3.64% rent growth · sell at horizon
- IRR
- -1.6%
- Equity multiple
- 0.94×
- Total profit
- $-1,905
- Equity at exit
- $17,147
- IRR
- 8.7%
- Equity multiple
- 1.68×
- Total profit
- $22,047
- Equity at exit
- $9,943
Cash invested: $32,200 (down + closing). Projections, not guarantees.
Landlord ↔ Tenant lean methodology
- Overall (STATE)
- 85 Strongly Landlord-Friendly
- State North Carolina
- 85 Strongly Landlord-Friendly · R+3
- County
- — inherits STATE
- City
- — inherits STATE
ZIP-level market 27260
- Rents YoY
- 3.6%
- Active inventory
- 128
- Price-to-rent
- 7.9×
Monthly cashflow live
- Estimated rent
- $1,215 high interval (Pro) →
- Mortgage (P&I)
- −$603
- Tax from tax record
- −$58 /mo · $693/yr
- Insurance
- −$48
- HOA
- −$0
- Vacancy / Maint / Mgmt
- −$255
- Net cashflow
- $251
Break-even live
UW: 25.0% down · 7.5% · 30yr · 1.5% tax · 5.0% vac · 8.0% maint · 8.0% mgmt
Financing live
Cash to close
- Down payment
- $28,750
- Closing costs
- $3,450
- Reserves months
- —
- Total cash needed
- —
Loan-product check · same deal, 3 products live
Conventional
25% down · 7.5% · 30yr
- Down + closing
- —
- Monthly P&I
- —
- Monthly cashflow
- —
- DSCR
- —
- Eligible?
- —
Personal DTI + credit; lowest rate.
DSCR
20% down · 8.5% · 30yr
- Down + closing
- —
- Monthly P&I
- —
- Monthly cashflow
- —
- DSCR
- —
- Eligible?
- —
No personal income docs; deal must DSCR.
Hard money
10% down · 12.0% · 12mo
- Down + closing
- —
- Monthly P&I
- —
- Monthly cashflow
- —
- DSCR
- —
- Eligible?
- —
Short-term bridge; refi at stabilization.
Rent comps 8 comps
| Address | Beds | Baths | Sqft | Rent | $/sqft | DOM | Units | Dist |
|---|---|---|---|---|---|---|---|---|
| 1009 Cassell St High Point, NC | 3.0 | 1.0 | 975 | $1,050 | $1.08 | 23d | 1 | 0.41mi |
| 304 Ardale Dr Unit 1B High Point, NC | 2.0 | 2.5 | 1000 | $1,050 | $1.05 | 23d | 1 | 0.76mi |
| 310 Ardale Dr Unit 1B High Point, NC | 2.0 | 2.0 | 1000 | $1,050 | $1.05 | 23d | 1 | 0.80mi |
| 312 Ardale Dr High Point, NC | 2.0 | 2.5–3.0 | 1024 | $1,050 | $1.03 | 23d | 2 | 0.81mi |
| 314 Ardale Dr High Point, NC | 2.0 | 2.0–3.0 | 1000 | $1,050 | $1.05 | 23d | 3 | 0.83mi |
| 2452 Bellemeade St High Point, NC | 2.0–3.0 | 2.0 | 1050 | $1,560 | $1.49 | 14d | 9 | 1.35mi |
| 1110 Adams St High Point, NC | 3.0 | 1.0 | 1278 | $1,340 | $1.05 | 23d | 1 | 1.42mi |
| 1506 Hidden Creek Ter High Point, NC | 3.0 | 2.0 | 1065 | $1,395 | $1.31 | 21d | 1 | 1.46mi |
Listing history 6 events
-
2026-06-16statusdays on market $115,000 Pending 8 DOM
-
2026-06-15days on market $115,000 Active 7 DOM
-
2026-06-14days on market $115,000 Active 5 DOM
-
2026-06-10days on market $115,000 Active 2 DOM
-
2026-06-09remarks 543-char remark
-
2026-06-09$115,000 Active 1 DOM
ⓘ Source: listings_history table (triggers on properties + properties_extension) + one-shot
backfill from property_details.listing_events for pre-trigger history.
Tax reassessment forecast NC · Resets to sale price
- Current annual tax
- $693 · $58/mo
- Projected year-2 tax
- $943 · $79/mo
- Expected delta
- +$250/yr (+$21/mo · 36.0%)
ⓘ Screening estimate from a state-policy table — verify with the county assessor before closing.
Climate risk First Street
- Flood 1/10 Low FEMA zone X (unshaded) · 0% chance over 30 yrs
- Wildfire 1/10 Low
- Heat 5/10 Major 7 d/yr ≥103°F today · 16 d/yr by 30 yrs out
- Wind 4/10 Moderate 15% chance of damaging wind over 30 yrs
- Air quality 2/10 Low 1 unhealthy d/yr today · 1 by 30 yrs out
Nearby sold comps map
Loading sold comps map…
Walkable amenities ~0.75 mi
Loading nearby amenities…
Taxation est. · year 1
- Rental income
- $14,577
- − Mortgage interest
- −$6,442
- − Property taxes
- −$693
- − Insurance
- −$575
- − Repairs & maintenance
- −$1,166
- − Management
- −$1,166
- − Depreciation
- −$3,345
- Taxable income
- $1,189
- Est. tax owed @ 24.0%
- −$285
- After-tax cash flow
- $2,725/yr
For passive investors: Depreciation is non-cash, so a rental often shows a tax loss while cash-flowing — sheltering income. Rental losses are passive: they offset passive income freely, and up to $25,000/yr can offset ordinary (W-2) income if you actively participate and your MAGI is under $100k (phasing out to $0 by $150k); unused losses carry forward. On sale, claimed depreciation is recaptured at up to 25%, and gains may owe capital-gains tax (a 1031 exchange can defer both). Figures are a year-1 estimate at your 24.0% rate — not tax advice; consult a CPA.
Schools (NCES district)
- District
- Guilford County Schools
- NCES district ID
- 3701920
- Math proficiency
- 39% ▲ 1.00%
- Reading proficiency
- 45% ▲ 1.00%
- Median HH income
- $46,315
- Composite
- 35.78/100
- National rank
- #4842
- State rank
- #99 of 178 in NC
Livability — High Point
- Score
- 77/100
- State rank
- #31
- US rank
- #3084
Category grades
Schools grade is shown separately in the Schools card above.
Census & demographics
- Census place
- High Point, NC
- County
- Guilford County · 487,190 people
- City population
- 102,450
- Metro
- Greensboro-High Point, NC
- Population (ZIP)
- 25,299
- Household income
- $42,308
- Rent vs Own
- Severe rent burden
- 1005.0
Population outlook (Guilford County) Hauer SSP2
- Today (2025)
- 584,596 people
- By 2030
- 616,851 · +5.5%
- By 2040
- 678,451 · +16.1%
- By 2050
- 734,788 · +25.7%
- By 2075
- 862,985 · +47.6%
- By 2100
- 948,704 · +62.3%
Race, ethnicity, and origin ACS 2023
- Neighborhood character
- Diverse neighborhood (Simpson 0.67)
- Race & ethnicity
- Black 51% Hispanic / Latino 20% White 15% Asian 10% Two or more races 10%
- Hispanic origin (detail)
- Mexican 12% Puerto Rican 1%
- Common ancestry
- Hispanic 1% Serbian 1% Italian 1%
- Foreign-born
- 17% · Canada, Philippines, Dominican Republic
- Languages at home
- 71% English-only · Spanish 17% Other Indo-European 4% Other Asian/Pacific 4%
Political lean MEDSL · Guilford
- 2024 margin
- Strong D (+21.8) · D 60.2% · R 38.4% · Other 1.4%
- 2008→2024 swing
- +3.5pp toward D · 2008: 18.4pp · 2024: 21.8pp
- All cycles
- 2024: D+21.8 2020: D+23.1 2016: D+20.0 2012: D+16.5 2008: D+18.4
Not yet ingested
- Civics
- —
Market trends
- HPI YoY
- ▼ -107.22%
- Current HPI
- 159.2101
- Rent YoY
- ▲ 3.64%
- Metro
- Greensboro-High Point, NC
- State GDP YoY
- ▲ 3.28%
- F500 in state
- 26
Industry mix (Fortune 500 HQ in NC)
| Industry | F500 HQs | Revenue |
|---|---|---|
| Financial Services | 2 | $213B |
|
||
| Retail | 2 | $95B |
|
||
| Industrial Conglomerate | 1 | $38B |
|
||
| Metals / Steel | 1 | $35B |
|
||
| Utilities | 1 | $30B |
|
||
| Industrial Machinery | 1 | $19B |
|
||
Price history
+121.2% since first listed2 events — show timeline
- 2026-06-08 Listed $115,000 Triad MLS
- 2025-11-13 Sold (Public Records) $52,000 Public Records
Property tax history
+2.8%/yrLatest (2025): $693 · -0.8% YoY. Source: county tax records.
Cash-flow waterfall
monthlySold comps — $/sqft
last 12 mo · ≤1 miLoading sold comps…