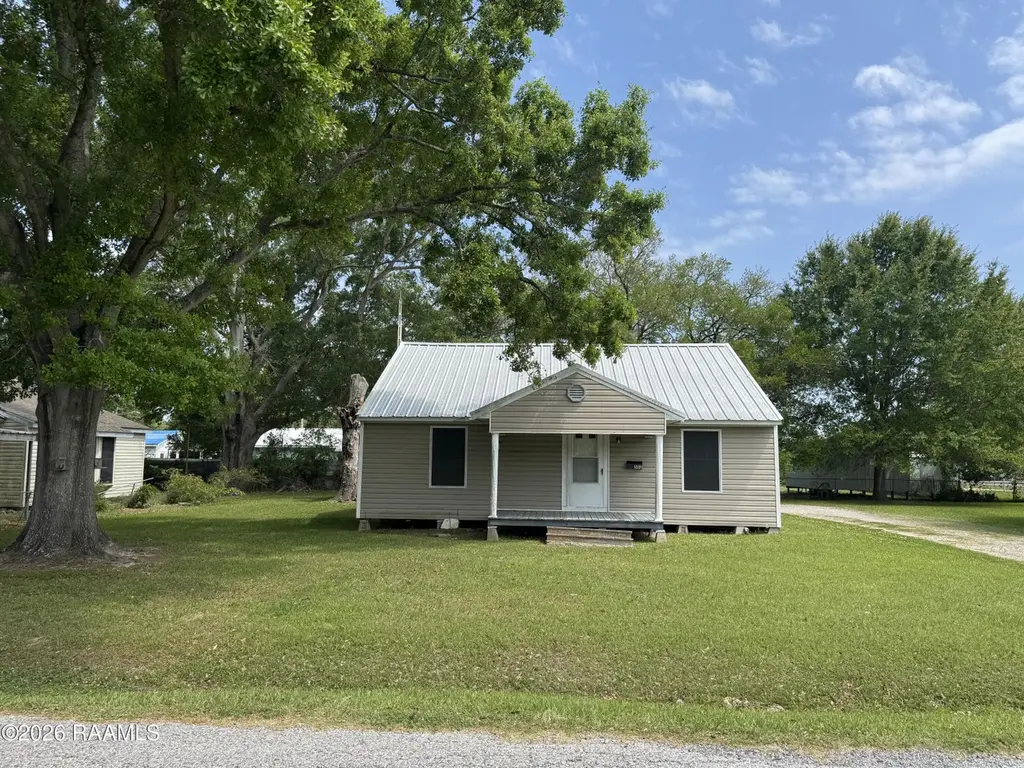
502 Karen Dr · Rayne, LA
Flood risk 5/10 · Moderate
- FEMA flood zone
- X (unshaded)
- Chance of flooding over 30 yrs
- 0.51%
- Est. flood insurance / yr
- $507 – $1,088
Fire risk 1/10 · Minimal
- Est. fire insurance / yr
- $1,269 – $2,357
Heat risk 9/10 · Severe
- Hot days now (above 109°F)
- 7 days/yr
- Hot days in 30 yrs
- 20 days/yr
Wind risk 9/10 · Severe
- Chance of severe wind over 30 yrs
- 99.0%
Air-quality risk 1/10 · Minimal
- Unhealthy air days now
- 0 days/yr
- Unhealthy air days in 30 yrs
- 0 days/yr
Risk factors via First Street. Map © Google.
Why this score? — see what drove the B- grade
The composite is a weighted blend of 9 inputs, each scored 0–100. Each bar is that input's sub-score; the figure is the points it added to the 100-point composite (weight × sub-score).
- Cash flow +26.9/30.0
- ARV discount +11.6/15.0
- DSCR +9.3/10.0
- 1% rule +6.1/10.0
- Livability +3.8/5.0
- Schools +3.2/10.0
- Rent growth +2.5/5.0
- Condition / age +2.5/5.0
- Appreciation +0.0/10.0
$96,900
🖨 Deal sheet 📄 Offer letter ✓ Due diligence
Listing remarks
Perfect starter homes don't come along in this price range so get this one while it's available! Minutes from I-10 and mere blocks from shopping and city amenities including Rayne's famous holiday parade schedule! Home features easy keep vinyl flooring throughout, large bedrooms and open kitchen/living floor plan. Well maintained and ready for occupancy! THREE city lots give ample yard for spreading outside on those outdoor days as well as build value for your money! Did we add the covered 2 car carport for dry parking and convenience? If you're looking to add a strong addition to your investment portfolio this home is a great prospect for long term renters with a proven track record for o
Key facts
- Three city lots
- Vinyl flooring
- 0.3 acre lot
Tags
Property features AI
Exterior
- Parking: Attached carport with 2 covered spaces
- Utilities: Public sewer; Electric service: City
- Home design: Single family residence
- Construction: Metal roof; Vinyl siding; Frame construction
- Exterior features: City street and paved road frontage
Interior
- Flooring: Vinyl plank; Vinyl
- Bathrooms: 1 full bathroom
- Heating & cooling: Central heating; Central air conditioning
- Interior features: Formica counters
Neighborhood map
What this means for you Summary
Snapshot
- This is a 2-bed/1.0-bath single-family listed at $97k.
Deal economics
- At list price, monthly cash flow is $267 ($3k/yr) — positive.
- The deal already cash-flows at list — no discount required.
- Meets the 1% rule at list price ($1k rent vs $97k).
- Recommended offer: $91k (6.0% below list) — sets the bar for market timing.
- Cap rate 9.6% vs local median 5.4% in Rayne — top-decile yield for the area; either an underpriced asset or a hidden risk that comps aren't pricing in. Stress-test before assuming the spread holds.
Location & tenants
- Location reads 75/100 on livability (#18 in LA, #3,895 nationally) — a middle-class / working-renter tenant base. Strengths: crime A+, cost of living A+, housing A+; Watch: amenities F, commute F, employment F.
- Acadia Parish (rural): math 32% / reading 44% proficiency, ranked #28 of 98 in LA (top 29%) — families likely to look elsewhere, expect single-tenant / working-renter base with shorter leases; 62% free/reduced lunch — lower-income household profile, screen leases tightly.
- Zoned schools: South Rayne Elementary School (math 30% / reading 30%, grade F, #328 of 646 statewide, top 51%, 201 students, 80% FRL); Armstrong Middle School (math 15% / reading 38%, grade F, #135 of 218 statewide, top 62%, 340 students, 79% FRL); Rayne High School (math 30% / reading 47%, grade F, #88 of 265 statewide, top 33%, 640 students, 63% FRL).
- Market conditions: 95 active listings in the ZIP; 2 comparable units currently listed for rent nearby; 137 units permitted in Acadia Parish in 2024 (0 in 5+ unit buildings).
Forward outlook
- Local home prices are declining (-3.0%/yr); year-one equity from $670 of loan paydown is wiped out by about $3k of value loss. Plan a longer hold.
- At projected returns (-3.0% appreciation + 3.0% rent growth), your $27k cash investment doubles in ~10 years — after that, you're playing with house money.
Negotiation context
- It's been on market 67 days — a 6% lower offer ($91k) is reasonable based on typical stale-listing flexibility.
- 2 sale attempts with the ask held roughly flat each time — persistent listings suggest the price (not the market) is what's stuck; bring a comps-based counter.
- Current owner paid $68k; 44% above their basis — modest negotiation headroom, anchor on the comps not their cost.
Risks & watch-outs
- Climate carrying-cost: moderate flood risk; severe wind risk, 99% chance of damaging wind over 30y; extreme-heat days projected 7→20/yr by 2055 (HVAC capex compounding) — expect insurance premiums to compound above CPI over the hold.
Questions for the listing agent
- It's been on market 67 days. Have you received any prior offers? Is the seller open to a 6% concession, seller financing, or rate buy-down credit?
- Why hasn't it sold? Are there any deal-killer items the seller is aware of (foundation, flood, title, zoning, code violations)?
- Is there a deadline driving the sale (1031 exchange, divorce, estate, relocation)? That informs how much negotiation room exists.
- Schools are B-rated — typically a magnet for longer-tenancy family renters. What's the average tenant stay here, and is there a school-zone premium baked into asking?
- What's the average days-on-market for RENTAL listings here right now (not sales)? A rising rental-DOM trend means longer vacancies and softer asking-rent achievability than the comps imply.
- What's the recent tenant-quality profile in this submarket — average credit score on applications, eviction rate, late-payment / NSF rate, and stable-employment percentage? A property-management company in the area should have these aggregated.
- How much new for-sale + rental construction is in the pipeline within 1–3 miles? Heavy new supply typically softens prices + rents 12–24 months out; constrained supply supports both.
Investment metrics
- 1% rule
- 1.11% ✓
- Cap rate
- 9.60%
- Cash-on-cash
- 11.82%
- DSCR
- 1.53
- GRM
- 7.5
CMA / ARV
- ARV (on-the-fly)
- $106,560
- Comps found
- 7
Show comp detail 7 sales within ~0.75 mi
| Address | Dist | Beds/Ba | Sqft | Sold | Price | $/sf | Match |
|---|---|---|---|---|---|---|---|
| 208 N Cunningham St | 0.41mi | 2/1.0 | 1,103 (-1%) | 4mo | $115,000 | $104 | 77 |
| 600 N Chevis St | 0.25mi | 3/1.0 (+1) | 1,120 (+1%) | 8mo | $19,000 | $17 | 75 |
| 511 E Harrop St | 0.32mi | 2/1.0 | 1,100 (-1%) | 13mo | $90,000 | $82 | 73 |
| 410 Karen Dr | 0.08mi | 2/2.0 | 1,202 (+8%) | 14mo | $40,000 | $33 | 66 |
| 420 Elizabeth Dr | 0.17mi | 2/1.0 | 1,200 (+8%) | 18mo | $115,000 | $96 | 64 |
| 108 Marjorie St | 0.15mi | 3/2.0 (+1) | 1,276 (+15%) | 2mo | $178,000 | $139 | 58 |
| 1705 Electa St | 0.36mi | 2/1.5 | 1,075 (-3%) | 23mo | $115,000 | $107 | 57 |
Match score weights: distance 35% · size 25% · config 20% · recency 20%. Top-matched comps best support the ARV.
Projected returns pro-forma
-3.0% appreciation · 3.0% rent growth · sell at horizon
- IRR
- 1.2%
- Equity multiple
- 1.05×
- Total profit
- $1,283
- Equity at exit
- $14,448
- IRR
- 10.8%
- Equity multiple
- 1.84×
- Total profit
- $22,886
- Equity at exit
- $8,378
Cash invested: $27,132 (down + closing). Projections, not guarantees.
Landlord ↔ Tenant lean methodology
- Overall (STATE)
- 90 Strongly Landlord-Friendly
- State Louisiana
- 90 Strongly Landlord-Friendly · R+12
- County
- — inherits STATE
- City
- — inherits STATE
ZIP-level market 70578
- Active inventory
- 95
- Price-to-rent
- 7.5×
Monthly cashflow live
- Estimated rent
- $1,077 medium interval (Pro) →
- Mortgage (P&I)
- −$508
- Tax from tax record
- −$35 /mo · $422/yr
- Insurance
- −$40
- HOA
- −$0
- Vacancy / Maint / Mgmt
- −$226
- Net cashflow
- $267
Break-even live
UW: 25.0% down · 7.5% · 30yr · 1.5% tax · 5.0% vac · 8.0% maint · 8.0% mgmt
Financing live
Cash to close
- Down payment
- $24,225
- Closing costs
- $2,907
- Reserves months
- —
- Total cash needed
- —
Loan-product check · same deal, 3 products live
Conventional
25% down · 7.5% · 30yr
- Down + closing
- —
- Monthly P&I
- —
- Monthly cashflow
- —
- DSCR
- —
- Eligible?
- —
Personal DTI + credit; lowest rate.
DSCR
20% down · 8.5% · 30yr
- Down + closing
- —
- Monthly P&I
- —
- Monthly cashflow
- —
- DSCR
- —
- Eligible?
- —
No personal income docs; deal must DSCR.
Hard money
10% down · 12.0% · 12mo
- Down + closing
- —
- Monthly P&I
- —
- Monthly cashflow
- —
- DSCR
- —
- Eligible?
- —
Short-term bridge; refi at stabilization.
Rent comps 2 comps
| Address | Beds | Baths | Sqft | Rent | $/sqft | DOM | Units | Dist |
|---|---|---|---|---|---|---|---|---|
| 422 Ann Dr Rayne, LA | 3.0 | 1.0 | 1100 | $995 | $0.90 | 21d | 1 | 0.07mi |
| 214 E D St Rayne, LA | 2.0 | 2.0 | 1434 | $1,575 | $1.10 | 13d | 1 | 0.47mi |
Listing history 21 events
-
2026-06-18days on market $96,900 Active 67 DOM
-
2026-06-17days on market $96,900 Active 66 DOM
-
2026-06-16days on market $96,900 Active 65 DOM
-
2026-06-15days on market $96,900 Active 64 DOM
-
2026-06-13days on market $96,900 Active 62 DOM
-
2026-06-12days on market $96,900 Active 61 DOM
-
2026-06-09days on market $96,900 Active 58 DOM
-
2026-06-08days on market $96,900 Active 57 DOM
-
2026-06-07days on market $96,900 Active 56 DOM
-
2026-06-07days on market $96,900 Active 55 DOM
-
2026-06-04days on market $96,900 Active 52 DOM
-
2026-06-02days on market $96,900 Active 51 DOM
-
2026-06-01days on market $96,900 Active 50 DOM
-
2026-05-31days on market $96,900 Active 49 DOM
-
2026-05-31days on market $96,900 Active 48 DOM
-
2026-05-06status Active
-
2026-04-28status Pending
-
2026-04-01$96,900 Active
-
2021-11-23soldstatus $67,500
-
2016-07-01soldstatus $45,000
-
2006-04-26soldstatus $22,000
ⓘ Source: listings_history table (triggers on properties + properties_extension) + one-shot
backfill from property_details.listing_events for pre-trigger history.
Tax reassessment forecast LA · Resets to sale price
- Current annual tax
- $422 · $35/mo
- Projected year-2 tax
- $533 · $44/mo
- Expected delta
- +$111/yr (+$9/mo · 26.2%)
ⓘ Screening estimate from a state-policy table — verify with the county assessor before closing.
Climate risk First Street
- Flood 5/10 Major FEMA zone X (unshaded) · 51% chance over 30 yrs
- Wildfire 1/10 Low
- Heat 9/10 Extreme 7 d/yr ≥109°F today · 20 d/yr by 30 yrs out
- Wind 9/10 Extreme 99% chance of damaging wind over 30 yrs
- Air quality 1/10 Low 0 unhealthy d/yr today · 0 by 30 yrs out
Nearby sold comps map
Loading sold comps map…
Walkable amenities ~0.75 mi
Loading nearby amenities…
Taxation est. · year 1
- Rental income
- $12,926
- − Mortgage interest
- −$5,428
- − Property taxes
- −$422
- − Insurance
- −$484
- − Repairs & maintenance
- −$1,034
- − Management
- −$1,034
- − Depreciation
- −$2,819
- Taxable income
- $1,704
- Est. tax owed @ 24.0%
- −$409
- After-tax cash flow
- $2,798/yr
For passive investors: Depreciation is non-cash, so a rental often shows a tax loss while cash-flowing — sheltering income. Rental losses are passive: they offset passive income freely, and up to $25,000/yr can offset ordinary (W-2) income if you actively participate and your MAGI is under $100k (phasing out to $0 by $150k); unused losses carry forward. On sale, claimed depreciation is recaptured at up to 25%, and gains may owe capital-gains tax (a 1031 exchange can defer both). Figures are a year-1 estimate at your 24.0% rate — not tax advice; consult a CPA.
Schools (NCES district)
- District
- Acadia Parish
- NCES district ID
- 2200030
- Math proficiency
- 32% ▼ -39.00%
- Reading proficiency
- 44% ▼ -32.00%
- Median HH income
- $38,012
- Composite
- 31.65/100
- National rank
- #5929
- State rank
- #28 of 98 in LA
Livability — Rayne
- Score
- 75/100
- State rank
- #18
- US rank
- #3895
Category grades
Schools grade is shown separately in the Schools card above.
Census & demographics
- Census place
- Rayne, LA
- City population
- 16,279
- Population (ZIP)
- 16,279
Population outlook (Acadia County) Hauer SSP2
- Today (2025)
- 63,846 people
- By 2030
- 64,141 · +0.5%
- By 2040
- 63,922 · +0.1%
- By 2050
- 62,263 · -2.5%
- By 2075
- 56,507 · -11.5%
- By 2100
- 46,316 · -27.5%
Race, ethnicity, and origin ACS 2023
- Neighborhood character
- Predominantly White (71%)
- Race & ethnicity
- White 71% Black 21% Two or more races 5% Hispanic / Latino 3%
- Common ancestry
- Lithuanian 15%
- Foreign-born
- 0%
- Languages at home
- 91% English-only · French/Haitian/Cajun 8% Spanish 1%
Political lean MEDSL · Acadia
- 2024 margin
- Solid R (+64.0) · D 17.6% · R 81.5%
- 2008→2024 swing
- -18.3pp toward R · 2008: -45.7pp · 2024: -64.0pp
- All cycles
- 2024: R+64.0 2020: R+60.3 2016: R+56.7 2012: R+49.8 2008: R+45.7
Not yet ingested
- Civics
- —
Market trends
- HPI YoY
- ▼ -77.19%
- Current HPI
- 118.9619
- Rent YoY
- —
- Metro
- —
- State GDP YoY
- ▲ 3.29%
- F500 in state
- 10
Industry mix (Fortune 500 HQ in LA)
| Industry | F500 HQs | Revenue |
|---|---|---|
| Telecommunications | 2 | $23B |
|
||
| Utilities | 1 | $12B |
|
||
| Wholesale / Distribution | 1 | $5B |
|
||
| Advertising | 1 | $2B |
|
||
Price history
+340.5% since first listed6 events — show timeline
- 2026-05-06 Relisted — AcadianaMLS
- 2026-04-28 Pending — AcadianaMLS
- 2026-04-01 Listed $96,900 AcadianaMLS
- 2021-11-23 Sold (Public Records) $67,500 Public Records
- 2016-07-01 Sold (Public Records) $45,000 Public Records
- 2006-04-26 Sold (Public Records) $22,000 Public Records
Property tax history
+6.8%/yrLatest (2025): $422 · +0.3% YoY. Source: county tax records.
Cash-flow waterfall
monthlySold comps — $/sqft
last 12 mo · ≤1 miLoading sold comps…