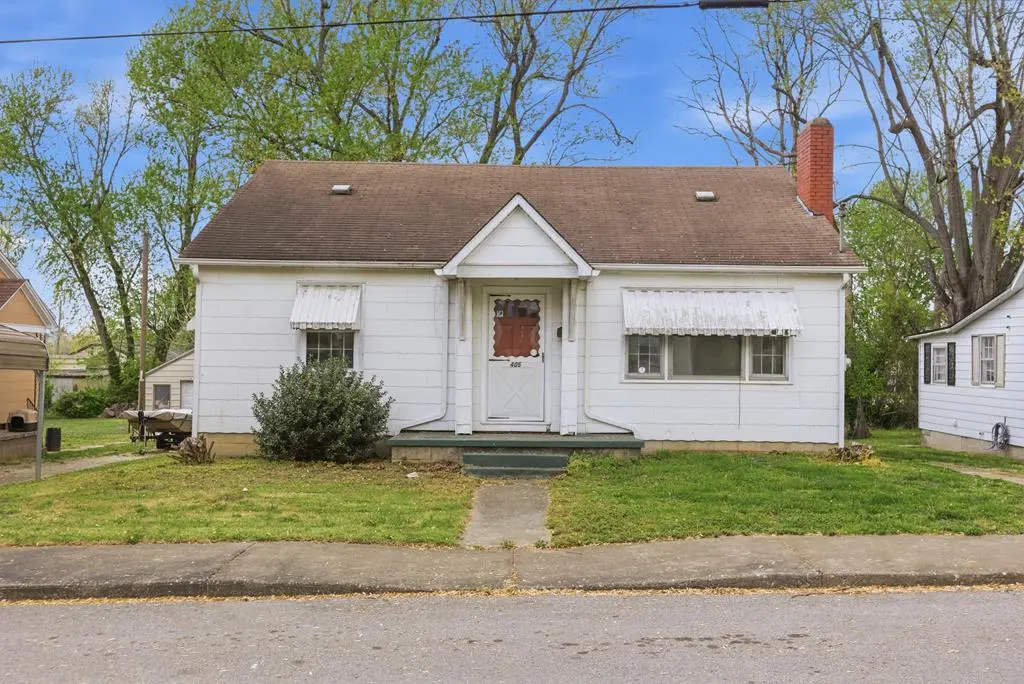
405 Woodson Ave · Madisonville, KY
Flood risk 1/10 · Minimal
- FEMA flood zone
- X (unshaded)
- Chance of flooding over 30 yrs
- 0.0%
- Est. flood insurance / yr
- $473 – $860
Fire risk 3/10 · Minor
- Est. fire insurance / yr
- $839 – $1,559
Heat risk 5/10 · Moderate
- Hot days now (above 108°F)
- 7 days/yr
- Hot days in 30 yrs
- 20 days/yr
Wind risk 3/10 · Minor
- Chance of severe wind over 30 yrs
- 6.0%
Air-quality risk 2/10 · Minimal
- Unhealthy air days now
- 1 days/yr
- Unhealthy air days in 30 yrs
- 1 days/yr
Risk factors via First Street. Map © Google.
Why this score? — see what drove the B grade
The composite is a weighted blend of 9 inputs, each scored 0–100. Each bar is that input's sub-score; the figure is the points it added to the 100-point composite (weight × sub-score).
- Cash flow +29.0/30.0
- ARV discount +15.0/15.0
- DSCR +10.0/10.0
- 1% rule +7.1/10.0
- Livability +3.6/5.0
- Schools +3.0/10.0
- Rent growth +2.5/5.0
- Condition / age +2.5/5.0
- Appreciation +0.0/10.0
$99,900
🖨 Deal sheet 📄 Offer letter ✓ Due diligence
Listing remarks
Quaint 3-bedroom, 1-bath home with great potential located in Madisonville. This property offers a functional layout and solid bones, making it an excellent opportunity for investors or buyers looking to add value. The third bedroom is located upstairs in a loft-style area, adding flexible living space. The home features original hardwood floors, large closets including a walk-in, and an abundance of cabinet/closet space throughout. A basement provides additional storage or workspace options, and the upper level offers added versatility, though some areas may have limited ceiling height. This home presents an excellent opportunity to build equity with updates and improvements over time and
Key facts
- Walk-in closet
- Large closets
- Functional layout
Tags
Property features AI
Exterior
- Parking: Detached concrete garage; 1 garage space
- Utilities: Public water; Public sewer
- Home design: Single family residence; Residential property
- Construction: Frame construction; Composition roof; Full unfinished basement
- Exterior features: Porch; Workshop
Interior
- Kitchen: Range; Electric range; Refrigerator
- Bedrooms: 2 main-level bedrooms
- Flooring: Hardwood flooring
- Bathrooms: 1 full bathroom; 1 half bathroom; 1 one-quarter bathroom; 1 main-level bathroom
- Heating & cooling: Natural gas heating; Central air conditioning
- Interior features: Walk-in closet(s); Storm windows; Living room fireplace
- Laundry & utility: Laundry in basement; Gas water heater
Neighborhood map
What this means for you Summary
Snapshot
- This is a 3-bed/1.0-bath single-family listed at $100k.
Deal economics
- At list price, monthly cash flow is $341 ($4k/yr) — positive.
- The deal already cash-flows at list — no discount required.
- Meets the 1% rule at list price ($1k rent vs $100k).
- Recommended offer: $94k (6.0% below list) — sets the bar for market timing.
- Cap rate 10.4% vs local median 4.0% in Madisonville — top-decile yield for the area; either an underpriced asset or a hidden risk that comps aren't pricing in. Stress-test before assuming the spread holds.
Location & tenants
- Location reads 72/100 on livability (#132 in KY) — a middle-class / working-renter tenant base. Strengths: crime A+, cost of living A+, housing A+; Watch: amenities F, commute F, employment F.
- Hopkins County (town): math 27% / reading 43% proficiency, ranked #65 of 165 in KY (top 39%) — families likely to look elsewhere, expect single-tenant / working-renter base with shorter leases.
- Market conditions: 192 active listings in the ZIP; 122 units permitted in Hopkins County in 2024 (0 in 5+ unit buildings).
Forward outlook
- Local home prices are declining (-3.0%/yr); year-one equity from $691 of loan paydown is wiped out by about $3k of value loss. Plan a longer hold.
- Hopkins County population projected at -13% by 2050 — secular population decline; favor cash flow + early exit over multi-decade hold.
- At projected returns (-3.0% appreciation + 3.0% rent growth), your $28k cash investment doubles in ~9 years — after that, you're playing with house money.
Negotiation context
- It's been on market 76 days — a 6% lower offer ($94k) is reasonable based on typical stale-listing flexibility.
- 2 sale attempts; this cycle's ask has dropped $10k (9%) from the opening price — seller is motivated, your offer sets the floor, not the list.
- Current owner paid $32k; list at $100k implies a 217% gain — meaningful room to come down on a strong offer.
Risks & watch-outs
- Watch-outs: built in 1948 — expect roof / HVAC / electrical / plumbing capex.
- Climate carrying-cost: extreme-heat days projected 7→20/yr by 2055 (HVAC capex compounding) — expect insurance premiums to compound above CPI over the hold.
Questions for the listing agent
- It's been on market 76 days. Have you received any prior offers? Is the seller open to a 6% concession, seller financing, or rate buy-down credit?
- Built in 1948 — when were the roof, HVAC, electrical panel, plumbing, and water heater last replaced?
- Why hasn't it sold? Are there any deal-killer items the seller is aware of (foundation, flood, title, zoning, code violations)?
- Is there a deadline driving the sale (1031 exchange, divorce, estate, relocation)? That informs how much negotiation room exists.
- What's the average days-on-market for RENTAL listings here right now (not sales)? A rising rental-DOM trend means longer vacancies and softer asking-rent achievability than the comps imply.
- What's the recent tenant-quality profile in this submarket — average credit score on applications, eviction rate, late-payment / NSF rate, and stable-employment percentage? A property-management company in the area should have these aggregated.
- How much new for-sale + rental construction is in the pipeline within 1–3 miles? Heavy new supply typically softens prices + rents 12–24 months out; constrained supply supports both.
Investment metrics
- 1% rule
- 1.21% ✓
- Cap rate
- 10.38%
- Cash-on-cash
- 14.61%
- DSCR
- 1.65
- GRM
- 6.9
CMA / ARV
- ARV (on-the-fly)
- $151,611
- Comps found
- 12
Show comp detail 12 sales within ~0.75 mi
| Address | Dist | Beds/Ba | Sqft | Sold | Price | $/sf | Match |
|---|---|---|---|---|---|---|---|
| 247 Daniel Dr | 0.23mi | 4/2.0 (+1) | 1,512 (-3%) | 0mo | $96,000 | $63 | 75 |
| 680 Bishop St | 0.23mi | 2/2.0 (-1) | 1,547 (-1%) | 9mo | $142,900 | $92 | 71 |
| 789 Pride Ave | 0.41mi | 3/2.0 | 1,676 (+7%) | 2mo | $128,000 | $76 | 63 |
| 506 W Arch St | 0.36mi | 3/2.0 | 1,720 (+10%) | 2mo | $204,000 | $119 | 61 |
| 254 Springlake St | 0.72mi | 3/2.0 | 1,560 (-0%) | 5mo | $165,000 | $106 | 58 |
| 65 Mitchell Hill Dr | 0.38mi | 3/2.0 | 1,380 (-12%) | 5mo | $145,000 | $105 | 54 |
| 179 N Church St | 0.30mi | 4/2.0 (+1) | 1,384 (-12%) | 6mo | $29,000 | $21 | 53 |
| 647 Pride Ave Dr | 0.41mi | 3/3.0 | 1,736 (+11%) | 2mo | $230,000 | $132 | 53 |
| 925 Bell Dr | 0.69mi | 3/2.0 | 1,500 (-4%) | 12mo | $228,000 | $152 | 48 |
| 166 N Seminary St | 0.51mi | 3/1.0 | 1,338 (-14%) | 10mo | $130,000 | $97 | 44 |
| 107 W Noel Ave | 0.56mi | 3/2.0 | 1,752 (+12%) | 11mo | $100,000 | $57 | 40 |
| 777 Hanson St | 0.65mi | 2/1.0 (-1) | 1,362 (-13%) | 6mo | $27,000 | $20 | 38 |
Match score weights: distance 35% · size 25% · config 20% · recency 20%. Top-matched comps best support the ARV.
Projected returns pro-forma
-3.0% appreciation · 3.0% rent growth · sell at horizon
- IRR
- 5.0%
- Equity multiple
- 1.20×
- Total profit
- $5,474
- Equity at exit
- $14,895
- IRR
- 14.5%
- Equity multiple
- 2.16×
- Total profit
- $32,576
- Equity at exit
- $8,638
Cash invested: $27,972 (down + closing). Projections, not guarantees.
Landlord ↔ Tenant lean methodology
- Overall (STATE)
- 83 Strongly Landlord-Friendly
- State Kentucky
- 83 Strongly Landlord-Friendly · R+16
- County
- — inherits STATE
- City
- — inherits STATE
ZIP-level market 42431
- Home prices YoY
- -15.2%
- Active inventory
- 192
- Price-to-rent
- 6.9×
Monthly cashflow live
- Estimated rent
- $1,205 medium interval (Pro) →
- Mortgage (P&I)
- −$524
- Tax from tax record
- −$46 /mo · $552/yr
- Insurance
- −$42
- HOA
- −$0
- Vacancy / Maint / Mgmt
- −$253
- Net cashflow
- $341
Break-even live
UW: 25.0% down · 7.5% · 30yr · 1.5% tax · 5.0% vac · 8.0% maint · 8.0% mgmt
Financing live
Cash to close
- Down payment
- $24,975
- Closing costs
- $2,997
- Reserves months
- —
- Total cash needed
- —
Loan-product check · same deal, 3 products live
Conventional
25% down · 7.5% · 30yr
- Down + closing
- —
- Monthly P&I
- —
- Monthly cashflow
- —
- DSCR
- —
- Eligible?
- —
Personal DTI + credit; lowest rate.
DSCR
20% down · 8.5% · 30yr
- Down + closing
- —
- Monthly P&I
- —
- Monthly cashflow
- —
- DSCR
- —
- Eligible?
- —
No personal income docs; deal must DSCR.
Hard money
10% down · 12.0% · 12mo
- Down + closing
- —
- Monthly P&I
- —
- Monthly cashflow
- —
- DSCR
- —
- Eligible?
- —
Short-term bridge; refi at stabilization.
Listing history 19 events
-
2026-06-18price $99,900 Active 76 DOM
-
2026-06-18days on market $109,900 Active 76 DOM
-
2026-06-17days on market $109,900 Active 75 DOM
-
2026-06-16days on market $109,900 Active 74 DOM
-
2026-06-15days on market $109,900 Active 73 DOM
-
2026-06-13days on market $109,900 Active 71 DOM
-
2026-06-12days on market $109,900 Active 70 DOM
-
2026-06-09days on market $109,900 Active 67 DOM
-
2026-06-08days on market $109,900 Active 66 DOM
-
2026-06-07days on market $109,900 Active 65 DOM
-
2026-06-07days on market $109,900 Active 64 DOM
-
2026-06-04days on market $109,900 Active 61 DOM
-
2026-06-02days on market $109,900 Active 60 DOM
-
2026-06-01days on market $109,900 Active 59 DOM
-
2026-05-31days on market $109,900 Active 58 DOM
-
2026-05-31days on market $109,900 Active 57 DOM
-
2026-04-03$109,900 Active
-
2026-04-03$109,900 Active
-
1993-06-01soldstatus $31,500
ⓘ Source: listings_history table (triggers on properties + properties_extension) + one-shot
backfill from property_details.listing_events for pre-trigger history.
Tax reassessment forecast KY · Resets to sale price
- Current annual tax
- $552 · $46/mo
- Projected year-2 tax
- $859 · $72/mo
- Expected delta
- +$307/yr (+$26/mo · 55.6%)
ⓘ Screening estimate from a state-policy table — verify with the county assessor before closing.
Climate risk First Street
- Flood 1/10 Low FEMA zone X (unshaded) · 0% chance over 30 yrs
- Wildfire 3/10 Moderate
- Heat 5/10 Major 7 d/yr ≥108°F today · 20 d/yr by 30 yrs out
- Wind 3/10 Moderate 6% chance of damaging wind over 30 yrs
- Air quality 2/10 Low 1 unhealthy d/yr today · 1 by 30 yrs out
Nearby sold comps map
Loading sold comps map…
Walkable amenities ~0.75 mi
Loading nearby amenities…
Taxation est. · year 1
- Rental income
- $14,462
- − Mortgage interest
- −$5,596
- − Property taxes
- −$552
- − Insurance
- −$500
- − Repairs & maintenance
- −$1,157
- − Management
- −$1,157
- − Depreciation
- −$2,906
- Taxable income
- $2,595
- Est. tax owed @ 24.0%
- −$623
- After-tax cash flow
- $3,464/yr
For passive investors: Depreciation is non-cash, so a rental often shows a tax loss while cash-flowing — sheltering income. Rental losses are passive: they offset passive income freely, and up to $25,000/yr can offset ordinary (W-2) income if you actively participate and your MAGI is under $100k (phasing out to $0 by $150k); unused losses carry forward. On sale, claimed depreciation is recaptured at up to 25%, and gains may owe capital-gains tax (a 1031 exchange can defer both). Figures are a year-1 estimate at your 24.0% rate — not tax advice; consult a CPA.
Schools (NCES district)
- District
- Hopkins County
- NCES district ID
- 2102860
- Math proficiency
- 27% ▼ -23.00%
- Reading proficiency
- 43% ▼ -17.00%
- Median HH income
- $42,436
- Composite
- 29.56/100
- National rank
- #6488
- State rank
- #65 of 165 in KY
Livability — Madisonville
- Score
- 72/100
- State rank
- #132
- US rank
- #6200
Category grades
Schools grade is shown separately in the Schools card above.
Census & demographics
- Census place
- Madisonville, KY
- City population
- 27,095
- Population (ZIP)
- 27,095
Population outlook (Hopkins County) Hauer SSP2
- Today (2025)
- 45,164 people
- By 2030
- 44,083 · -2.4%
- By 2040
- 41,650 · -7.8%
- By 2050
- 39,303 · -13.0%
- By 2075
- 34,567 · -23.5%
- By 2100
- 29,476 · -34.7%
Race, ethnicity, and origin ACS 2023
- Neighborhood character
- Predominantly White (83%)
- Race & ethnicity
- White 83% Black 8% Two or more races 6% Hispanic / Latino 3% Native American 1%
- Common ancestry
- Lithuanian 2% Slovak 1% Serbian 1%
- Foreign-born
- 2% · Canada, China
- Languages at home
- 97% English-only · Spanish 2%
Political lean MEDSL · Hopkins
- 2024 margin
- Solid R (+50.9) · D 23.9% · R 74.8% · Other 1.2%
- 2008→2024 swing
- -26.0pp toward R · 2008: -24.9pp · 2024: -50.9pp
- All cycles
- 2024: R+50.9 2020: R+48.0 2016: R+54.0 2012: R+39.9 2008: R+24.9
Not yet ingested
- Civics
- —
Market trends
- HPI YoY
- ▼ -39.52%
- Current HPI
- 220.2269
- Rent YoY
- —
- Metro
- —
- State GDP YoY
- ▲ 1.81%
- F500 in state
- 4
Industry mix (Fortune 500 HQ in KY)
| Industry | F500 HQs | Revenue |
|---|---|---|
| Healthcare | 1 | $118B |
|
||
| Food / Beverage | 1 | $7B |
|
||
Price history
+248.9% since first listed3 events — show timeline
- 2026-04-03 Listed $109,900 MHCBOR
- 2026-04-03 Listed $109,900 MHCBOR
- 1993-06-01 Sold (Public Records) $31,500 Public Records
Property tax history
+4.2%/yrLatest (2025): $552 · -0.1% YoY. Source: county tax records.
Cash-flow waterfall
monthlySold comps — $/sqft
last 12 mo · ≤1 miLoading sold comps…