 🏷️ Likely Rental
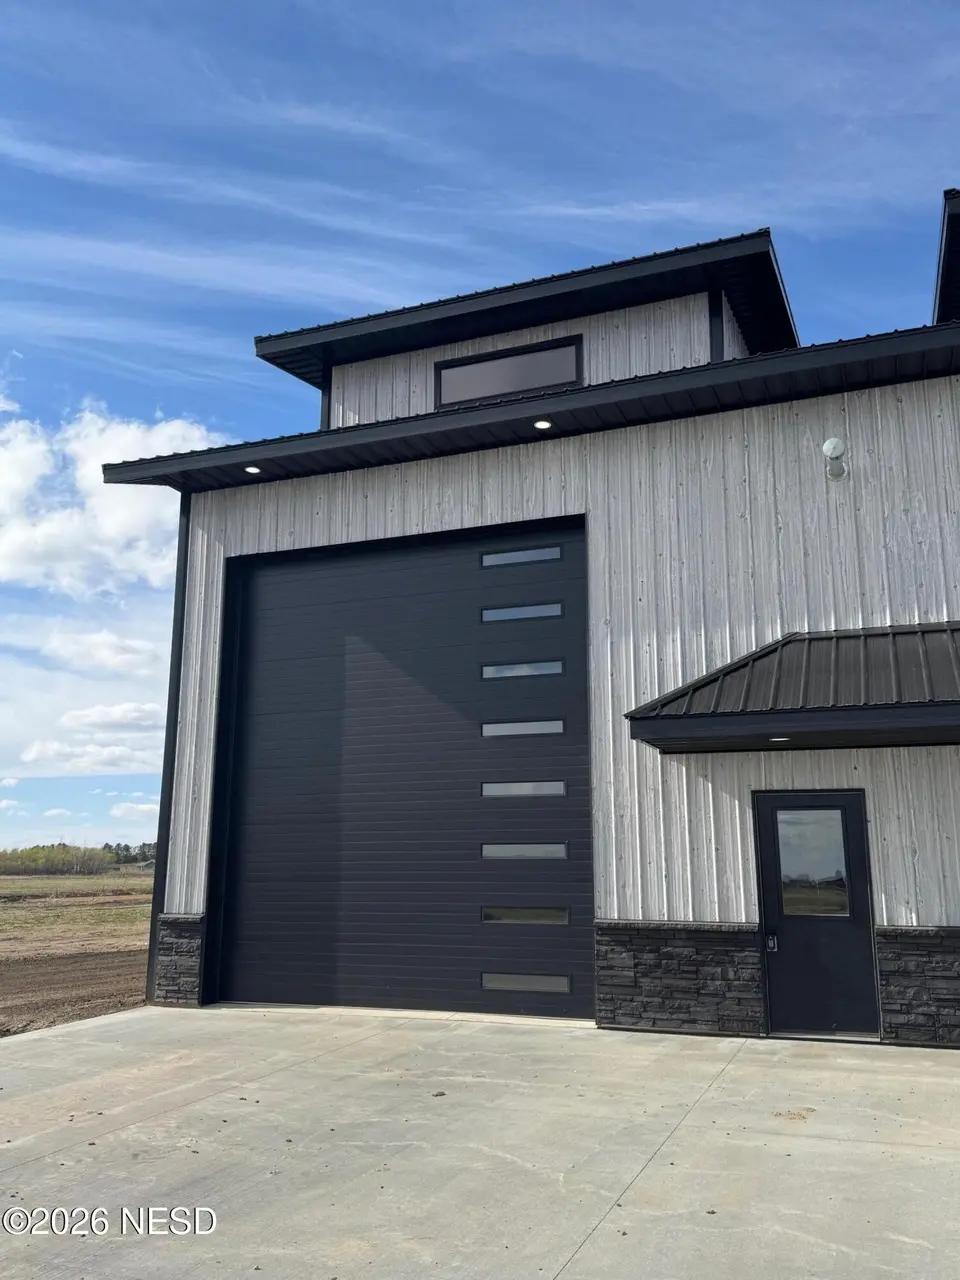
2723 Jamie Ave NE Unit 1 · Watertown, SD
Flood risk No data
- FEMA flood zone
- —
- Chance of flooding over 30 yrs
- —
- Est. flood insurance / yr
- —
Fire risk No data
- Est. fire insurance / yr
- —
Heat risk 1/10 · Minimal
- Hot days now (above threshold)
- 7 days/yr
- Hot days in 30 yrs
- 13 days/yr
Wind risk No data
- Chance of severe wind over 30 yrs
- —
Air-quality risk 2/10 · Minimal
- Unhealthy air days now
- 1 days/yr
- Unhealthy air days in 30 yrs
- 1 days/yr
Risk factors via First Street. Map © Google.
Why this score? — see what drove the D+ grade
The composite is a weighted blend of 9 inputs, each scored 0–100. Each bar is that input's sub-score; the figure is the points it added to the 100-point composite (weight × sub-score).
- Cash flow +15.0/30.0
- ARV discount +7.5/15.0
- 1% rule +5.0/10.0
- DSCR +5.0/10.0
- Schools +4.3/10.0
- Livability +3.9/5.0
- Rent growth +2.5/5.0
- Condition / age +2.5/5.0
- Appreciation +0.0/10.0
$1,985
🖨 Deal sheet 📄 Offer letter ✓ Due diligence
Listing remarks MLS
The ultimate luxury townhome meets man cave- 1250 sq ft heated shop area with 18 foot sidewalls, 14x16 foot overhead door, concrete floor and floor drains. Step through the transition into the 1000 sq ft living area including custom cabinetry throughout the kitchen, master bedroom, master bath and guest bath. Upstairs offers a 6x12 master closet, office nook and private laundry area. This property offers a rare combination of scale and style. The epic shop area can accommodate an RV, boat, lift or collector autos. Relax at your private covered patio. The HOA allow for low maintenance living and covers snow, lawn, irrigation and property tax on common areas.
Key facts
- Custom cabinetry
- Heated shop area
- Master closet
Tags
Property features AI
Finance
- Financial info: Annual tax shown
- HOA & community: Association fee billed annually
Exterior
- Parking: Attached garage with 4 parking spaces
- Home design: Residential townhouse; Two levels
- Exterior features: Metal roof; Lot approximately 0.06 acres
Interior
- Flooring: Carpet
- Bathrooms: 1 full bathroom; 1 half bathroom
- Interior features: Carpet flooring; 8 total rooms
Neighborhood map
What this means for you Summary
Snapshot
- This is a 1-bed/1.5-bath townhouse listed at $2k.
Deal economics
- At list price, monthly cash flow is $841 ($10k/yr) — positive.
- The deal already cash-flows at list — no discount required.
- Meets the 1% rule at list price ($1k rent vs $2k).
- Recommended offer: $2k (3.0% below list) — sets the bar for market timing.
- Cap rate 514.7% vs local median 2.3% in Watertown — top-decile yield for the area; either an underpriced asset or a hidden risk that comps aren't pricing in. Stress-test before assuming the spread holds.
Location & tenants
- Location reads 78/100 on livability (#11 in SD, #2,681 nationally) — a middle-class / working-renter tenant base. Strengths: cost of living A+, housing A+, health & safety A+; Watch: commute F.
- Watertown School District 14-4 (town): math 45% / reading 57% proficiency, ranked #28 of 59 in SD (top 48%) — acceptable for families but not a draw, mixed tenant base, ~2y average lease.
- Zoned schools: Watertown High School - 01 (math 42% / reading 67%, grade C-, #53 of 151 statewide, top 41%, 1,220 students, 22% FRL) — zoned schools at 22% FRL track the district average.
- Market conditions: 228 active listings in the ZIP; 160 units permitted in Codington County in 2024 (63 in 5+ unit buildings).
- This rent is only 18% of the median local income ($73k/yr) — well below the 30% rent-burden line; pricing power to push rent on renewal without tenant pushback.
Forward outlook
- Local home prices are declining (-3.0%/yr); year-one equity from $14 of loan paydown is wiped out by about $60 of value loss. Plan a longer hold.
- Codington County population projected at +14% by 2050 — modest demand growth; plan on rents tracking national, not racing it.
- At projected returns (-3.0% appreciation + 3.0% rent growth), your $556 cash investment doubles in ~1 year — after that, you're playing with house money.
Negotiation context
- It's been on market 38 days — a 3% lower offer ($2k) is reasonable based on typical stale-listing flexibility.
- 2 sale attempts; this cycle's ask has dropped $265 (12%) from the opening price — seller is motivated, your offer sets the floor, not the list.
Questions for the listing agent
- It's been on market 38 days. Have you received any prior offers? Is the seller open to a 3% concession, seller financing, or rate buy-down credit?
- Is there a deadline driving the sale (1031 exchange, divorce, estate, relocation)? That informs how much negotiation room exists.
- Schools are B-rated — typically a magnet for longer-tenancy family renters. What's the average tenant stay here, and is there a school-zone premium baked into asking?
- The area grade is low — what's the realistic commute time and amenity access for the typical tenant pool here? Any planned neighborhood developments (good or bad) we should know about?
- What's the average days-on-market for RENTAL listings here right now (not sales)? A rising rental-DOM trend means longer vacancies and softer asking-rent achievability than the comps imply.
- What's the recent tenant-quality profile in this submarket — average credit score on applications, eviction rate, late-payment / NSF rate, and stable-employment percentage? A property-management company in the area should have these aggregated.
- How much new for-sale + rental construction is in the pipeline within 1–3 miles? Heavy new supply typically softens prices + rents 12–24 months out; constrained supply supports both.
Investment metrics
- 1% rule
- 54.50% ✓
- Cap rate
- 514.66%
- Cash-on-cash
- 1815.61%
- DSCR
- 81.78
- GRM
- 0.2
CMA / ARV
- ARV (median comp)
- $269,280
- List price
- $1,985
- Delta
- -99.26%
- Verdict
- UNDERPRICED
- Comps
- 4 within 2.0 mi
Projected returns pro-forma
-3.0% appreciation · 3.0% rent growth · sell at horizon
- IRR
- —
- Equity multiple
- 96.81×
- Total profit
- $53,254
- Equity at exit
- $296
- IRR
- —
- Equity multiple
- 208.64×
- Total profit
- $115,405
- Equity at exit
- $172
Cash invested: $556 (down + closing). Projections, not guarantees.
Landlord ↔ Tenant lean methodology
- Overall (STATE)
- 83 Strongly Landlord-Friendly
- State South Dakota
- 83 Strongly Landlord-Friendly · R+16
- County
- — inherits STATE
- City
- — inherits STATE
ZIP-level market 57201
- Active inventory
- 228
- Price-to-rent
- 0.2×
Monthly cashflow live
- Estimated rent
- $1,082 medium interval (Pro) →
- Mortgage (P&I)
- −$10
- Tax est. 1.5%
- −$2 /mo · $30/yr
- Insurance
- −$1
- HOA
- −$0
- Vacancy / Maint / Mgmt
- −$227
- Net cashflow
- $841
Break-even live
UW: 25.0% down · 7.5% · 30yr · 1.5% tax · 5.0% vac · 8.0% maint · 8.0% mgmt
Financing live
Cash to close
- Down payment
- $496
- Closing costs
- $60
- Reserves months
- —
- Total cash needed
- —
Loan-product check · same deal, 3 products live
Conventional
25% down · 7.5% · 30yr
- Down + closing
- —
- Monthly P&I
- —
- Monthly cashflow
- —
- DSCR
- —
- Eligible?
- —
Personal DTI + credit; lowest rate.
DSCR
20% down · 8.5% · 30yr
- Down + closing
- —
- Monthly P&I
- —
- Monthly cashflow
- —
- DSCR
- —
- Eligible?
- —
No personal income docs; deal must DSCR.
Hard money
10% down · 12.0% · 12mo
- Down + closing
- —
- Monthly P&I
- —
- Monthly cashflow
- —
- DSCR
- —
- Eligible?
- —
Short-term bridge; refi at stabilization.
Listing history 18 events
-
2026-06-19days on market $1,985 Active 38 DOM
-
2026-06-18days on market $1,985 Active 37 DOM
-
2026-06-17days on market $1,985 Active 36 DOM
-
2026-06-16days on market $1,985 Active 35 DOM
-
2026-06-15days on market $1,985 Active 34 DOM
-
2026-06-14days on market $1,985 Active 32 DOM
-
2026-06-12days on market $1,985 Active 31 DOM
-
2026-06-09days on market $1,985 Active 28 DOM
-
2026-06-08days on market $1,985 Active 27 DOM
-
2026-06-07days on market $1,985 Active 26 DOM
-
2026-06-05pricedays on market $1,985 Active 24 DOM
-
2026-06-03days on market $2,250 Active 22 DOM
Show marketing remark (665 chars)
The ultimate luxury townhome meets man cave- 1250 sq ft heated shop area with 18 foot sidewalls, 14x16 foot overhead door, concrete floor and floor drains. Step through the transition into the 1000 sq ft living area including custom cabinetry throughout the kitchen, master bedroom, master bath and guest bath. Upstairs offers a 6x12 master closet, office nook and private laundry area. This property offers a rare combination of scale and style. The epic shop area can accommodate an RV, boat, lift or collector autos. Relax at your private covered patio. The HOA allow for low maintenance living and covers snow, lawn, irrigation and property tax on common areas.
-
2026-06-02days on market $2,250 Active 21 DOM
-
2026-06-01days on market $2,250 Active 20 DOM
-
2026-05-31days on market $2,250 Active 19 DOM
-
2026-05-30days on market $2,250 Active 18 DOM
-
2026-05-12$2,250 Active 693-char remark
-
2026-03-09$389,000 Active 665-char remark
Show marketing remark (665 chars)
The ultimate luxury townhome meets man cave- 1250 sq ft heated shop area with 18 foot sidewalls, 14x16 foot overhead door, concrete floor and floor drains. Step through the transition into the 1000 sq ft living area including custom cabinetry throughout the kitchen, master bedroom, master bath and guest bath. Upstairs offers a 6x12 master closet, office nook and private laundry area. This property offers a rare combination of scale and style. The epic shop area can accommodate an RV, boat, lift or collector autos. Relax at your private covered patio. The HOA allow for low maintenance living and covers snow, lawn, irrigation and property tax on common areas.
ⓘ Source: listings_history table (triggers on properties + properties_extension) + one-shot
backfill from property_details.listing_events for pre-trigger history.
Climate risk First Street
- Heat 1/10 Low
- Air quality 2/10 Low 1 unhealthy d/yr today · 1 by 30 yrs out
Nearby sold comps map
Loading sold comps map…
Walkable amenities ~0.75 mi
Loading nearby amenities…
Taxation est. · year 1
- Rental income
- $12,982
- − Mortgage interest
- −$111
- − Property taxes
- −$30
- − Insurance
- −$10
- − Repairs & maintenance
- −$1,039
- − Management
- −$1,039
- − Depreciation
- −$58
- Taxable income
- $10,696
- Est. tax owed @ 24.0%
- −$2,567
- After-tax cash flow
- $7,524/yr
For passive investors: Depreciation is non-cash, so a rental often shows a tax loss while cash-flowing — sheltering income. Rental losses are passive: they offset passive income freely, and up to $25,000/yr can offset ordinary (W-2) income if you actively participate and your MAGI is under $100k (phasing out to $0 by $150k); unused losses carry forward. On sale, claimed depreciation is recaptured at up to 25%, and gains may owe capital-gains tax (a 1031 exchange can defer both). Figures are a year-1 estimate at your 24.0% rate — not tax advice; consult a CPA.
Schools (NCES district)
- District
- Watertown School District 14-4
- NCES district ID
- 4676620
- Math proficiency
- 45% ▼ -10.00%
- Reading proficiency
- 57% ▼ -7.00%
- Median HH income
- $46,575
- Composite
- 43.24/100
- National rank
- #3057
- State rank
- #28 of 59 in SD
Livability — Watertown
- Score
- 78/100
- State rank
- #11
- US rank
- #2681
Category grades
Schools grade is shown separately in the Schools card above.
Census & demographics
- Census place
- Watertown, SD
- County
- Codington County · 26,781 people
- City population
- 26,781
- Metro
- Watertown, SD
- Population (ZIP)
- 26,781
- Household income
- $72,878
- Rent vs Own
- Severe rent burden
- 613.0
Population outlook (Codington County) Hauer SSP2
- Today (2025)
- 29,752 people
- By 2030
- 30,627 · +2.9%
- By 2040
- 32,285 · +8.5%
- By 2050
- 33,812 · +13.6%
- By 2075
- 39,184 · +31.7%
- By 2100
- 46,673 · +56.9%
Race, ethnicity, and origin ACS 2023
- Neighborhood character
- Predominantly White (91%)
- Race & ethnicity
- White 91% Two or more races 5% Hispanic / Latino 3% Native American 2%
- Common ancestry
- Portuguese 15% Romanian 3% Iranian 3%
- Foreign-born
- 1% · Canada
- Languages at home
- 97% English-only · Spanish 2% German/W. Germanic 1%
Political lean MEDSL · Codington
- 2024 margin
- Solid R (+40.8) · D 28.4% · R 69.2% · Other 2.4%
- 2008→2024 swing
- -34.4pp toward R · 2008: -6.4pp · 2024: -40.8pp
- All cycles
- 2024: R+40.8 2020: R+38.9 2016: R+39.3 2012: R+18.3 2008: R+6.4
Not yet ingested
- Civics
- —
Market trends
- HPI YoY
- ▼ -161.04%
- Current HPI
- 165.8449
- Rent YoY
- —
- Metro
- Watertown, SD
- State GDP YoY
- ▲ 0.70%
- F500 in state
- 2
Industry mix (Fortune 500 HQ in SD)
| Industry | F500 HQs | Revenue |
|---|---|---|
| Utilities | 1 | $1B |
|
||
Price history
-99.5% since first listed4 events — show timeline
- 2026-06-04 Price Changed $1,985 NESD
- 2026-06-03 Price Changed $375,000 NESD
- 2026-05-12 Listed $2,250 NESD
- 2026-03-09 Listed $389,000 NESD
Cash-flow waterfall
monthlySold comps — $/sqft
last 12 mo · ≤1 miLoading sold comps…