 Duplex
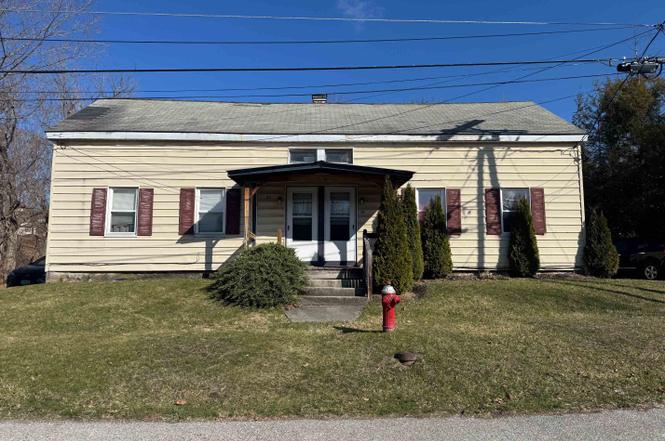
32-34 Sage St · North Bennington, VT
Flood risk No data
- FEMA flood zone
- —
- Chance of flooding over 30 yrs
- —
- Est. flood insurance / yr
- —
Fire risk No data
- Est. fire insurance / yr
- —
Heat risk 2/10 · Minimal
- Hot days now (above threshold)
- 7 days/yr
- Hot days in 30 yrs
- 16 days/yr
Wind risk No data
- Chance of severe wind over 30 yrs
- —
Air-quality risk 2/10 · Minimal
- Unhealthy air days now
- 0 days/yr
- Unhealthy air days in 30 yrs
- 1 days/yr
Risk factors via First Street. Map © Google.
Why this score? — see what drove the B- grade
The composite is a weighted blend of 9 inputs, each scored 0–100. Each bar is that input's sub-score; the figure is the points it added to the 100-point composite (weight × sub-score).
- Cash flow +26.3/30.0
- DSCR +8.9/10.0
- ARV discount +7.5/15.0
- 1% rule +7.0/10.0
- Appreciation +6.3/10.0
- Schools +5.0/10.0
- Livability +3.2/5.0
- Rent growth +2.5/5.0
- Condition / age +2.5/5.0
$190,000
🖨 Deal sheet (PDF) 📄 Offer letter ✓ Due diligence
Multi-family units
County records classify this as Multi-Family (2-4 Unit). Listing-text estimate: 2 units. confirmed
Listing remarks
Duplex in North Bennington offering 1 way street location. decent yard and 2 - 2 bedroom units. Good investment potential in a walkable and sought location. Town water and sewer. Current tenants keep their units up well.
Key facts
- Decent yard
- Town sewer
- Investment potential
Tags
Property features AI
Exterior
- Parking: Dirt driveway
- Utilities: Public sewer; Public water; High-speed internet available; Cable available; Telephone available
- Home design: Duplex; Existing property
- Construction: Wood frame construction; Shingle roof; Built in 1900
- Exterior features: Level lot in town; Paved, public road frontage
Interior
- Kitchen: Appliances included in both units
- Bedrooms: Unit 1 has 3 bedrooms; Unit 2 has 2 bedrooms
- Bathrooms: Unit 1 has 1 full bathroom; Unit 2 has 1 full bathroom; Two full bathrooms total
- Heating & cooling: Baseboard heating; Hot air heating; Hot water heating; No central cooling
- Interior features: Basement with interior access; Full basement with dirt floor and interior stairs; Five rooms in Unit 1; Four rooms in Unit 2
- Laundry & utility: Electric service with circuit breaker(s)
Neighborhood map
What this means for you Summary
Snapshot
- This is a 2 × 2-bed/1.0-bath units multifamily listed at $190k.
Deal economics
- At list price, monthly cash flow is $493 ($6k/yr) — positive. Per door: $246/mo.
- The deal already cash-flows at list — no discount required.
- Meets the 1% rule at list price ($2k rent vs $190k).
- Recommended offer: $167k (12.0% below list) — sets the bar for market timing.
Location & tenants
- Location reads 64/100 on livability (#65 in VT) — a middle-class / working-renter tenant base. Strengths: crime A+, housing A+; Watch: employment C-, health & safety D, schools D-.
- Market conditions: 10 active listings in the ZIP; 59 units permitted in Bennington County in 2024 (0 in 5+ unit buildings).
Forward outlook
- In year one you build about $6k of equity ($1k loan paydown + $5k appreciation (2.6% local appreciation)).
- Bennington County population projected at -23% by 2050 — secular population decline; favor cash flow + early exit over multi-decade hold.
- At projected returns (2.6% appreciation + 3.0% rent growth), your $53k cash investment doubles in ~4 years — after that, you're playing with house money.
- By year 6, paydown + projected appreciation supports a ~$34k cash-out refi (75% LTV) — recoverable capital for the next deal without selling this one.
Negotiation context
- It's been on market 358 days — a 12% lower offer ($167k) is reasonable based on typical stale-listing flexibility.
- 4 sale attempts; this cycle's ask has dropped $35k (16%) from the opening price — seller is motivated, your offer sets the floor, not the list.
Risks & watch-outs
- Watch-outs: built in 1900 — expect roof / HVAC / electrical / plumbing capex.
Questions for the listing agent
- It's been on market 358 days. Have you received any prior offers? Is the seller open to a 12% concession, seller financing, or rate buy-down credit?
- Can we see the unit-by-unit rent roll, current vacancy, and any below-market leases? What's the average tenancy length?
- What capital expenditures (roof, boiler, parking lot, exteriors) have been made in the last 5 years, and what's planned in the next 2?
- Built in 1900 — when were the roof, HVAC, electrical panel, plumbing, and water heater last replaced?
- Why hasn't it sold? Are there any deal-killer items the seller is aware of (foundation, flood, title, zoning, code violations)?
- Is there a deadline driving the sale (1031 exchange, divorce, estate, relocation)? That informs how much negotiation room exists.
- Schools are D-rated, which usually means shorter tenancies and higher turnover. Who's the typical renter profile here, and what's been the actual vacancy rate?
- What's the average days-on-market for RENTAL listings here right now (not sales)? A rising rental-DOM trend means longer vacancies and softer asking-rent achievability than the comps imply.
- What's the recent tenant-quality profile in this submarket — average credit score on applications, eviction rate, late-payment / NSF rate, and stable-employment percentage? A property-management company in the area should have these aggregated.
- How much new apartment / multifamily construction is in the pipeline within 1–3 miles? Heavy new supply (>2% of stock underway) typically softens rents 12–24 months out; light construction supports rent growth.
Investment metrics
- 1% rule
- 1.20% ✓
- Cap rate
- 9.41%
- Cash-on-cash
- 11.12%
- DSCR
- 1.49
- GRM
- 6.9
CMA / ARV
No comps found within radius.
Projected returns pro-forma
2.64% appreciation · 3.0% rent growth · sell at horizon
- IRR
- 17.1%
- Equity multiple
- 1.95×
- Total profit
- $50,740
- Equity at exit
- $81,629
- IRR
- 18.8%
- Equity multiple
- 3.65×
- Total profit
- $141,221
- Equity at exit
- $122,919
Cash invested: $53,200 (down + closing). Projections, not guarantees.
Landlord ↔ Tenant lean methodology
- Overall (STATE)
- 41 Moderately Tenant-Leaning
- State Vermont
- 41 Moderately Tenant-Leaning · D+15
- County
- — inherits STATE
- City
- — inherits STATE
ZIP-level market 05257
- Home prices YoY
- 1.1%
- Active inventory
- 10
- Price-to-rent
- 13.9×
Monthly cashflow live
- Estimated rent
- $2,286 medium interval (Pro) →
- Mortgage (P&I)
- −$996
- Tax est. 1.5%
- −$238 /mo · $2,850/yr
- Insurance
- −$79
- HOA
- −$0
- Vacancy / Maint / Mgmt
- −$480
- Net cashflow
- $493
Break-even live
Sensitivity live
| Price | -10% $624 | -5% $559 | +0% $493 | +5% $427 | +10% $362 |
|---|---|---|---|---|---|
| Rent | -10% $312 | -5% $403 | +0% $493 | +5% $583 | +10% $673 |
| Rate | -1.0pp $589 | -0.5pp $541 | base $493 | +0.5pp $444 | +1.0pp $394 |
2-unit breakdown (identical units grouped — click to expand)
| Units | Beds | Baths | Est. rent |
|---|---|---|---|
| 2× units | 2 | 1 | $2,286 |
| #1 | 2 | 1 | $1,143 |
| #2 | 2 | 1 | $1,143 |
| Total (2 units) | $2,286 | ||
UW: 25.0% down · 7.5% · 30yr · 1.5% tax · 5.0% vac · 8.0% maint · 8.0% mgmt
Financing live
Cash to close
- Down payment
- $47,500
- Closing costs
- $5,700
- Reserves months
- —
- Total cash needed
- —
Loan-product check · same deal, 3 products live
Conventional
25% down · 7.5% · 30yr
- Down + closing
- —
- Monthly P&I
- —
- Monthly cashflow
- —
- DSCR
- —
- Eligible?
- —
Personal DTI + credit; lowest rate.
DSCR
20% down · 8.5% · 30yr
- Down + closing
- —
- Monthly P&I
- —
- Monthly cashflow
- —
- DSCR
- —
- Eligible?
- —
No personal income docs; deal must DSCR.
Hard money
10% down · 12.0% · 12mo
- Down + closing
- —
- Monthly P&I
- —
- Monthly cashflow
- —
- DSCR
- —
- Eligible?
- —
Short-term bridge; refi at stabilization.
Listing history 10 events
-
2026-04-17status Pending
-
2026-03-27status Active
-
2026-03-26historical
-
2026-01-20status Active
-
2026-01-01historical Active with Contract
-
2025-10-20price $190,000
-
2025-10-20status Active
-
2025-09-26historical
-
2025-06-19price $199,900
-
2025-03-26$225,000 Active
ⓘ Source: listings_history table (triggers on properties + properties_extension) + one-shot
backfill from property_details.listing_events for pre-trigger history.
Climate risk First Street
- Heat 2/10 Low
- Air quality 2/10 Low 0 unhealthy d/yr today · 1 by 30 yrs out
Nearby sold comps map
Loading sold comps map…
Walkable amenities ~0.75 mi
Loading nearby amenities…
Taxation est. · year 1
- Rental income
- $27,432
- − Mortgage interest
- −$10,643
- − Property taxes
- −$2,850
- − Insurance
- −$950
- − Repairs & maintenance
- −$2,195
- − Management
- −$2,195
- − Depreciation
- −$5,527
- Taxable income
- $3,073
- Est. tax owed @ 24.0%
- −$737
- After-tax cash flow
- $5,177/yr
For passive investors: Depreciation is non-cash, so a rental often shows a tax loss while cash-flowing — sheltering income. Rental losses are passive: they offset passive income freely, and up to $25,000/yr can offset ordinary (W-2) income if you actively participate and your MAGI is under $100k (phasing out to $0 by $150k); unused losses carry forward. On sale, claimed depreciation is recaptured at up to 25%, and gains may owe capital-gains tax (a 1031 exchange can defer both). Figures are a year-1 estimate at your 24.0% rate — not tax advice; consult a CPA.
Schools (NCES district)
No district data.
Livability — North Bennington
- Score
- 64/100
- State rank
- #65
- US rank
- #14834
Category grades
Schools grade is shown separately in the Schools card above.
Census & demographics
- Census place
- North Bennington, VT
- Population (ZIP)
- 2,891
Population outlook (Bennington County) Hauer SSP2
- Today (2025)
- 34,407 people
- By 2030
- 32,975 · -4.2%
- By 2040
- 29,711 · -13.6%
- By 2050
- 26,638 · -22.6%
- By 2075
- 21,318 · -38.0%
- By 2100
- 16,086 · -53.2%
Race, ethnicity, and origin ACS 2023
- Neighborhood character
- Predominantly White (85%)
- Race & ethnicity
- White 85% Two or more races 7% Hispanic / Latino 4% Asian 2% Black 1% Native American 1%
- Common ancestry
- Lithuanian 6% Romanian 4% Slovak 3%
- Foreign-born
- 4% · China, Canada
- Languages at home
- 95% English-only · French/Haitian/Cajun 1% Other Asian/Pacific 1% Chinese 1%
Political lean MEDSL · Bennington
- 2024 margin
- Strong D (+22.5) · D 60.0% · R 37.5% · Other 2.6%
- 2008→2024 swing
- -10.9pp toward R · 2008: 33.4pp · 2024: 22.5pp
- All cycles
- 2024: D+22.5 2020: D+27.3 2016: D+22.1 2012: D+33.3 2008: D+33.4
Not yet ingested
- Civics
- —
Market trends
- HPI YoY
- ▲ 2.64%
- Current HPI
- 241.384
- Rent YoY
- —
- Metro
- —
- State GDP YoY
- —
- F500 in state
- 0
Price history
-15.6% since first listed10 events — show timeline
- 2026-04-17 Pending — PrimeMLS
- 2026-03-27 Relisted — PrimeMLS
- 2026-03-26 Delisted — PrimeMLS
- 2026-01-20 Relisted — PrimeMLS
- 2026-01-01 Contingent — PrimeMLS
- 2025-10-20 Price Changed $190,000 PrimeMLS
- 2025-10-20 Relisted — PrimeMLS
- 2025-09-26 Delisted — PrimeMLS
- 2025-06-19 Price Changed $199,900 PrimeMLS
- 2025-03-26 Listed $225,000 PrimeMLS
Cash-flow waterfall
monthlySold comps — $/sqft
last 12 mo · ≤1 miLoading sold comps…