502 W 14th St · Bryan, TX
Flood risk 1/10 · Minimal
- FEMA flood zone
- X (unshaded)
- Chance of flooding over 30 yrs
- 0.0%
- Est. flood insurance / yr
- $507 – $1,088
Fire risk 4/10 · Minor
- Est. fire insurance / yr
- $1,222 – $2,270
Heat risk 8/10 · Major
- Hot days now (above 110°F)
- 7 days/yr
- Hot days in 30 yrs
- 25 days/yr
Wind risk 8/10 · Major
- Chance of severe wind over 30 yrs
- 80.0%
Air-quality risk 1/10 · Minimal
- Unhealthy air days now
- 0 days/yr
- Unhealthy air days in 30 yrs
- 0 days/yr
Risk factors via First Street. Map © Google.
Why this score? — see what drove the C- grade
The composite is a weighted blend of 9 inputs, each scored 0–100. Each bar is that input's sub-score; the figure is the points it added to the 100-point composite (weight × sub-score).
- Cash flow +16.0/30.0
- ARV discount +15.0/15.0
- DSCR +4.9/10.0
- 1% rule +4.5/10.0
- Livability +3.8/5.0
- Rent growth +2.9/5.0
- Schools +2.6/10.0
- Condition / age +2.5/5.0
- Appreciation +0.0/10.0
$168,000
🖨 Deal sheet 📄 Offer letter ✓ Due diligence
Listing remarks
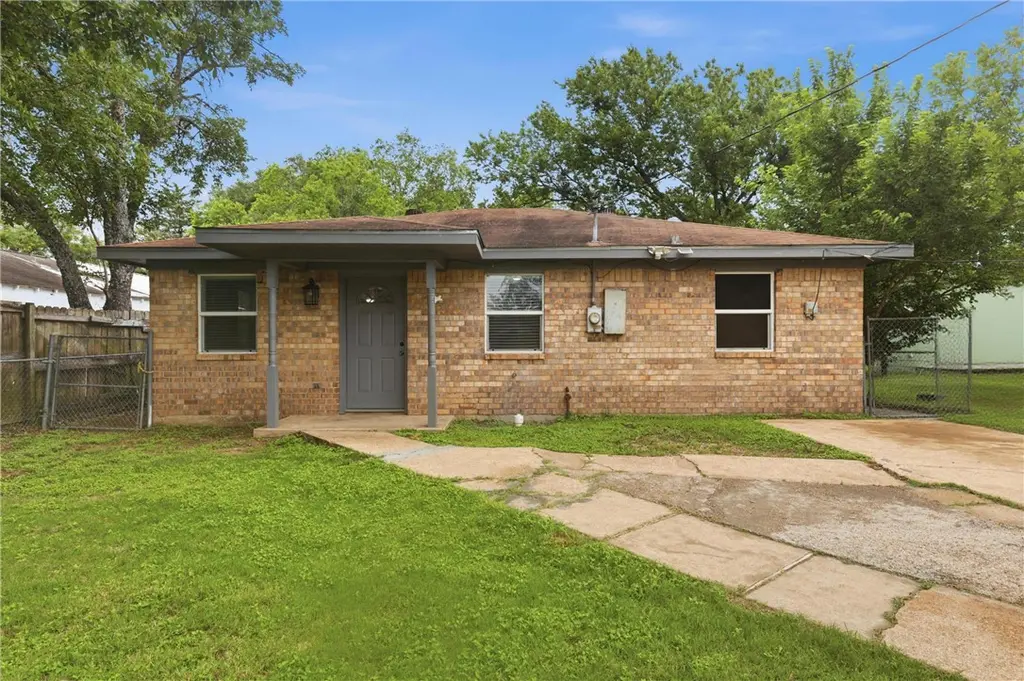
Welcome to 502 W 14th Street, a fully updated, move-in ready brick home in the heart of Bryan at an approachable price point. This 3-bedroom, 1.5-bath gem (1,098 sqft) has been thoughtfully renovated with quality finishes throughout: updated kitchen with gas stove and stainless steel refrigerator, refreshed bathrooms, durable vinyl plank flooring in every room (no carpet!) and double-pane windows for year round efficiency. The HVAC has been annually serviced and is in great working order, one less thing to worry about. The brick exterior and fully fenced backyard offer low-maintenance living you can count on. Just minutes from HEB and the restaurants, shops, and events of Downtown Bryan. Va
Key facts
- Gas stove
- Refreshed bathrooms
- Updated kitchen
Tags
Property features AI
Exterior
- Parking: No designated parking
- Utilities: Public water; Public sewer; Electricity available; Natural gas available; Cable available; Phone available; Water available
- Home design: Single-family residence; One story; Single level entry
- Construction: Brick construction; Slab foundation; Built as a single-story structure
- Exterior features: Full chain link fencing; Shingle roof; Satellite dish; Windows listed as energy-efficient
Interior
- Kitchen: Gas oven; Built-in gas oven; Gas range; Refrigerator
- Flooring: Vinyl
- Bathrooms: 1 full bathroom; 1 half bathroom
- Heating & cooling: Central heating (electric); Central air; Ceiling fan(s); Electric cooling
- Interior features: Laminate counters; Ceiling fan(s); Low emissivity windows
- Laundry & utility: Washer hookup; Gas water heater; Water heater
Neighborhood map
What this means for you Summary
Snapshot
- This is a 3-bed/1.5-bath single-family listed at $168k.
Deal economics
- At list price, monthly cash flow is $84 ($1k/yr) — positive.
- The deal already cash-flows at list — no discount required.
- To meet the 1% rule (rent ≥ 1% of price), the offer needs to be $160k (4.9% below list).
- Recommended offer: $160k (4.9% below list) — sets the bar for 1% rule.
- Cap rate 6.9% vs local median 4.0% in Bryan — top-decile yield for the area; either an underpriced asset or a hidden risk that comps aren't pricing in. Stress-test before assuming the spread holds.
Location & tenants
- Location reads 76/100 on livability (#99 in TX, #3,341 nationally) — a middle-class / working-renter tenant base. Strengths: cost of living A+, housing A+, health & safety A+; Watch: schools C-, crime C-, amenities C-.
- Bryan ISD (urban): math 30% / reading 32% proficiency, ranked #608 of 826 in TX (top 74%) — families likely to look elsewhere, expect single-tenant / working-renter base with shorter leases; 68% free/reduced lunch — lower-income household profile, screen leases tightly.
- Market conditions: Rents rising (+1.4%/yr); 288 active listings in the ZIP; 17 comparable units currently listed for rent nearby; rentals lingering (median 44d on market — plan ~5-8 weeks vacancy on turnover, expect pricing pressure); 59% of comp listings sitting > 30 days — soft ceiling on asking rent; 2,211 units permitted in Brazos County in 2024 (768 in 5+ unit buildings).
- This rent runs 37% of the median local income ($52k/yr) — at the standard rent-burdened threshold; future hikes will face affordability resistance.
Forward outlook
- Local home prices are declining (-3.0%/yr); year-one equity from $1k of loan paydown is wiped out by about $5k of value loss. Plan a longer hold.
- Brazos County population projected at +55% by 2050 — long-run rental-demand tailwind backs the buy-and-hold thesis.
Negotiation context
- It's been on market 40 days — a 3% lower offer ($163k) is reasonable based on typical stale-listing flexibility.
Risks & watch-outs
- Climate carrying-cost: severe wind risk, 80% chance of damaging wind over 30y; extreme-heat days projected 7→25/yr by 2055 (HVAC capex compounding) — expect insurance premiums to compound above CPI over the hold.
Questions for the listing agent
- It's been on market 40 days. Have you received any prior offers? Is the seller open to a 5% concession, seller financing, or rate buy-down credit?
- Built in 1977 — when were the roof, HVAC, electrical panel, plumbing, and water heater last replaced?
- Is there a deadline driving the sale (1031 exchange, divorce, estate, relocation)? That informs how much negotiation room exists.
- What's the average days-on-market for RENTAL listings here right now (not sales)? A rising rental-DOM trend means longer vacancies and softer asking-rent achievability than the comps imply.
- What's the recent tenant-quality profile in this submarket — average credit score on applications, eviction rate, late-payment / NSF rate, and stable-employment percentage? A property-management company in the area should have these aggregated.
- How much new for-sale + rental construction is in the pipeline within 1–3 miles? Heavy new supply typically softens prices + rents 12–24 months out; constrained supply supports both.
Investment metrics
- 1% rule
- 0.95% ✗
- Cap rate
- 6.89%
- Cash-on-cash
- 2.13%
- DSCR
- 1.09
- GRM
- 8.8
CMA / ARV
- ARV (median comp)
- $218,531
- List price
- $168,000
- Delta
- -23.12%
- Verdict
- UNDERPRICED
- Comps
- 20 within 1.0 mi
Show comp detail 7 sales within ~0.75 mi
| Address | Dist | Beds/Ba | Sqft | Sold | Price | $/sf | Match |
|---|---|---|---|---|---|---|---|
| 606 Boulevard St | 0.20mi | 3/1.0 | 1,107 (+1%) | 18mo | $175,000 | $158 | 72 |
| 418 E 17th St | 0.55mi | 3/2.0 | 1,200 (+9%) | 10mo | $165,000 | $138 | 48 |
| 1115 Lowery St | 0.42mi | 3/2.0 | 979 (-11%) | 14mo | $188,000 | $192 | 48 |
| 703 W 22nd St | 0.56mi | 3/2.0 | 1,203 (+10%) | 12mo | $237,000 | $197 | 46 |
| 1216 W 17th St | 0.50mi | 3/2.0 | 1,198 (+9%) | 17mo | $234,900 | $196 | 45 |
| 1113 Lowery St | 0.41mi | 3/2.0 | 940 (-14%) | 15mo | $185,000 | $197 | 42 |
| 910 N Preston Ave | 0.63mi | 3/2.0 | 1,200 (+9%) | 19mo | $239,900 | $200 | 37 |
Match score weights: distance 35% · size 25% · config 20% · recency 20%. Top-matched comps best support the ARV.
Projected returns pro-forma
-3.0% appreciation · 1.43% rent growth · sell at horizon
- IRR
- -14.7%
- Equity multiple
- 0.48×
- Total profit
- $-24,343
- Equity at exit
- $25,049
- IRR
- -8.9%
- Equity multiple
- 0.49×
- Total profit
- $-24,071
- Equity at exit
- $14,526
Cash invested: $47,040 (down + closing). Projections, not guarantees.
Landlord ↔ Tenant lean methodology
- Overall (STATE)
- 87 Strongly Landlord-Friendly
- State Texas
- 87 Strongly Landlord-Friendly · R+5
- County
- — inherits STATE
- City
- — inherits STATE
ZIP-level market 77803
- Home prices YoY
- -30.1%
- Rents YoY
- 1.4%
- Active inventory
- 288
- Price-to-rent
- 8.8×
Monthly cashflow live
- Estimated rent
- $1,597 high interval (Pro) →
- Mortgage (P&I)
- −$881
- Tax from tax record
- −$227 /mo · $2,723/yr
- Insurance
- −$70
- HOA
- −$0
- Vacancy / Maint / Mgmt
- −$335
- Net cashflow
- $84
Break-even live
UW: 25.0% down · 7.5% · 30yr · 1.5% tax · 5.0% vac · 8.0% maint · 8.0% mgmt
Financing live
Cash to close
- Down payment
- $42,000
- Closing costs
- $5,040
- Reserves months
- —
- Total cash needed
- —
Loan-product check · same deal, 3 products live
Conventional
25% down · 7.5% · 30yr
- Down + closing
- —
- Monthly P&I
- —
- Monthly cashflow
- —
- DSCR
- —
- Eligible?
- —
Personal DTI + credit; lowest rate.
DSCR
20% down · 8.5% · 30yr
- Down + closing
- —
- Monthly P&I
- —
- Monthly cashflow
- —
- DSCR
- —
- Eligible?
- —
No personal income docs; deal must DSCR.
Hard money
10% down · 12.0% · 12mo
- Down + closing
- —
- Monthly P&I
- —
- Monthly cashflow
- —
- DSCR
- —
- Eligible?
- —
Short-term bridge; refi at stabilization.
Rent comps 17 comps
| Address | Beds | Baths | Sqft | Rent | $/sqft | DOM | Units | Dist |
|---|---|---|---|---|---|---|---|---|
| 317 W Martin Luther King Junior St Bryan, TX | 3.0 | 2.0 | 1207 | $1,650 | $1.37 | 21d | 1 | 0.34mi |
| 505 N Logan Ave Bryan, TX | 3.0 | 2.0 | 1266 | $1,895 | $1.50 | 43d | 1 | 0.47mi |
| 306 W 23rd St Bryan, TX | 3.0 | 1.0 | 999 | $1,500 | $1.50 | 43d | 1 | 0.55mi |
| 1209 N Houston Ave Bryan, TX | 3.0 | 2.0 | 1236 | $1,500 | $1.21 | 13d | 1 | 0.62mi |
| 601 W 24th St Unit 112 Bryan, TX | 2.0 | 2.0 | 1165 | $1,600 | $1.37 | 43d | 1 | 0.62mi |
| 207 N Preston Ave Bryan, TX | 2.0 | 2.0 | 1100 | $1,650 | $1.50 | 21d | 1 | 0.87mi |
| 2702 Montana Ave Bryan, TX | 3.0 | 2.0 | 1305 | $1,875 | $1.44 | 43d | 1 | 0.91mi |
| 700 S Sims Ave Bryan, TX | 2.0 | 1.0 | 918 | $1,150 | $1.25 | 21d | 1 | 1.18mi |
| 1300 Baker Ave Bryan, TX | 2.0 | 1.0 | 850 | $970 | $1.14 | 13d | 1 | 1.19mi |
| 514 E 30th St Unit B1 Bryan, TX | 2.0 | 1.5 | 879 | $875 | $1.00 | 44d | 1 | 1.20mi |
| 106 W 33rd St Bryan, TX | 2.0 | 2.5 | 1204 | $1,850 | $1.54 | 21d | 1 | 1.22mi |
| 104 W 33rd St Bryan, TX | 2.0 | 2.5 | 1204 | $1,850 | $1.54 | 43d | 1 | 1.23mi |
| 702 Academy St Bryan, TX | 2.0 | 1.5 | 920 | $1,400 | $1.52 | 43d | 1 | 1.24mi |
| 1112 Baker Ave Bryan, TX | 3.0 | 1.0 | 900 | $1,695 | $1.88 | 43d | 1 | 1.25mi |
| 2796 Buccaneer Trl Bryan, TX | 3.0 | 2.0 | 1272 | $1,950 | $1.53 | 21d | 1 | 1.28mi |
| 1316 Antone St Unit B Bryan, TX | 2.0 | 1.0 | 1132 | $850 | $0.75 | 43d | 1 | 1.45mi |
| 1318 Antone St Bryan, TX | 2.0 | 1.0 | 1132 | $900 | $0.80 | 43d | 1 | 1.45mi |
Listing history 17 events
-
2026-06-17status $168,000 Pending 40 DOM
-
2026-06-17days on market $168,000 Active 40 DOM
-
2026-06-16days on market $168,000 Active 39 DOM
-
2026-06-15days on market $168,000 Active 38 DOM
-
2026-06-14days on market $168,000 Active 36 DOM
-
2026-06-13days on market $168,000 Active 35 DOM
-
2026-06-10days on market $168,000 Active 33 DOM
-
2026-06-09days on market $168,000 Active 32 DOM
-
2026-06-08days on market $168,000 Active 31 DOM
-
2026-06-07days on market $168,000 Active 30 DOM
-
2026-06-03days on market $168,000 Active 26 DOM
-
2026-06-02days on market $168,000 Active 25 DOM
-
2026-06-01days on market $168,000 Active 24 DOM
-
2026-05-31days on market $168,000 Active 23 DOM
-
2026-05-30days on market $168,000 Active 22 DOM
-
2026-05-08$168,000 Active 760-char remark
-
2017-09-22soldstatus
ⓘ Source: listings_history table (triggers on properties + properties_extension) + one-shot
backfill from property_details.listing_events for pre-trigger history.
Tax reassessment forecast TX · Resets to sale price
- Current annual tax
- $2,723 · $227/mo
- Projected year-2 tax
- $3,074 · $256/mo
- Expected delta
- +$351/yr (+$29/mo · 12.9%)
ⓘ Screening estimate from a state-policy table — verify with the county assessor before closing.
Climate risk First Street
- Flood 1/10 Low FEMA zone X (unshaded) · 0% chance over 30 yrs
- Wildfire 4/10 Moderate
- Heat 8/10 Severe 7 d/yr ≥110°F today · 25 d/yr by 30 yrs out
- Wind 8/10 Severe 80% chance of damaging wind over 30 yrs
- Air quality 1/10 Low 0 unhealthy d/yr today · 0 by 30 yrs out
Nearby sold comps map
Loading sold comps map…
Walkable amenities ~0.75 mi
Loading nearby amenities…
Taxation est. · year 1
- Rental income
- $19,164
- − Mortgage interest
- −$9,411
- − Property taxes
- −$2,723
- − Insurance
- −$840
- − Repairs & maintenance
- −$1,533
- − Management
- −$1,533
- − Depreciation
- −$4,887
- Taxable loss
- −$1,763
- Est. tax savings @ 24.0%
- +$423
- After-tax cash flow
- $1,427/yr
For passive investors: Depreciation is non-cash, so a rental often shows a tax loss while cash-flowing — sheltering income. Rental losses are passive: they offset passive income freely, and up to $25,000/yr can offset ordinary (W-2) income if you actively participate and your MAGI is under $100k (phasing out to $0 by $150k); unused losses carry forward. On sale, claimed depreciation is recaptured at up to 25%, and gains may owe capital-gains tax (a 1031 exchange can defer both). Figures are a year-1 estimate at your 24.0% rate — not tax advice; consult a CPA.
Schools (NCES district)
- District
- Bryan ISD
- NCES district ID
- 4811790
- Math proficiency
- 30% ▼ -8.00%
- Reading proficiency
- 32% ▼ -3.00%
- Median HH income
- $41,895
- Composite
- 26.26/100
- National rank
- #7253
- State rank
- #608 of 826 in TX
Livability — Bryan
- Score
- 76/100
- State rank
- #99
- US rank
- #3341
Category grades
Schools grade is shown separately in the Schools card above.
Census & demographics
- Census place
- Bryan, TX
- County
- Brazos County · 233,400 people
- City population
- 101,772
- Metro
- College Station-Bryan, TX
- Population (ZIP)
- 31,525
- Household income
- $52,274
- Rent vs Own
- Severe rent burden
- 1094.0
Population outlook (Brazos County) Hauer SSP2
- Today (2025)
- 267,942 people
- By 2030
- 296,630 · +10.7%
- By 2040
- 354,560 · +32.3%
- By 2050
- 414,616 · +54.7%
- By 2075
- 562,158 · +109.8%
- By 2100
- 678,828 · +153.3%
Race, ethnicity, and origin ACS 2023
- Neighborhood character
- Diverse neighborhood (Simpson 0.56)
- Race & ethnicity
- Hispanic / Latino 61% Black 21% Two or more races 18% White 17%
- Hispanic origin (detail)
- Mexican 56%
- Common ancestry
- Lithuanian 1% Romanian 1% Slovak 1%
- Foreign-born
- 21% · Canada, Jamaica, Dominican Republic
- Languages at home
- 52% English-only · Spanish 47%
Political lean MEDSL · Brazos
- 2024 margin
- Strong R (+24.9) · D 36.9% · R 61.7% · Other 1.4%
- 2008→2024 swing
- +4.1pp toward D · 2008: -28.9pp · 2024: -24.9pp
- All cycles
- 2024: R+24.9 2020: R+14.3 2016: R+23.7 2012: R+35.3 2008: R+28.9
Not yet ingested
- Civics
- —
Market trends
- HPI YoY
- ▼ -110.84%
- Current HPI
- 257.2885
- Rent YoY
- ▲ 1.43%
- Metro
- College Station-Bryan, TX
- State GDP YoY
- ▲ 3.95%
- F500 in state
- 110
Industry mix (Fortune 500 HQ in TX)
| Industry | F500 HQs | Revenue |
|---|---|---|
| Energy | 16 | $1,198B |
|
||
| Technology | 5 | $198B |
|
||
| Engineering / Construction | 4 | $72B |
|
||
| Energy Services | 3 | $60B |
|
||
| Utilities | 3 | $41B |
|
||
| Healthcare | 2 | $330B |
|
||
Price history
3 events — show timeline
- 2026-06-17 Pending — BCSRMLS
- 2026-05-08 Listed $168,000 BCSRMLS
- 2017-09-22 Sold (Public Records) — Public Records
Property tax history
+6.9%/yrLatest (2025): $2,723 · -2.3% YoY. Source: county tax records.
Cash-flow waterfall
monthlySold comps — $/sqft
last 12 mo · ≤1 miLoading sold comps…