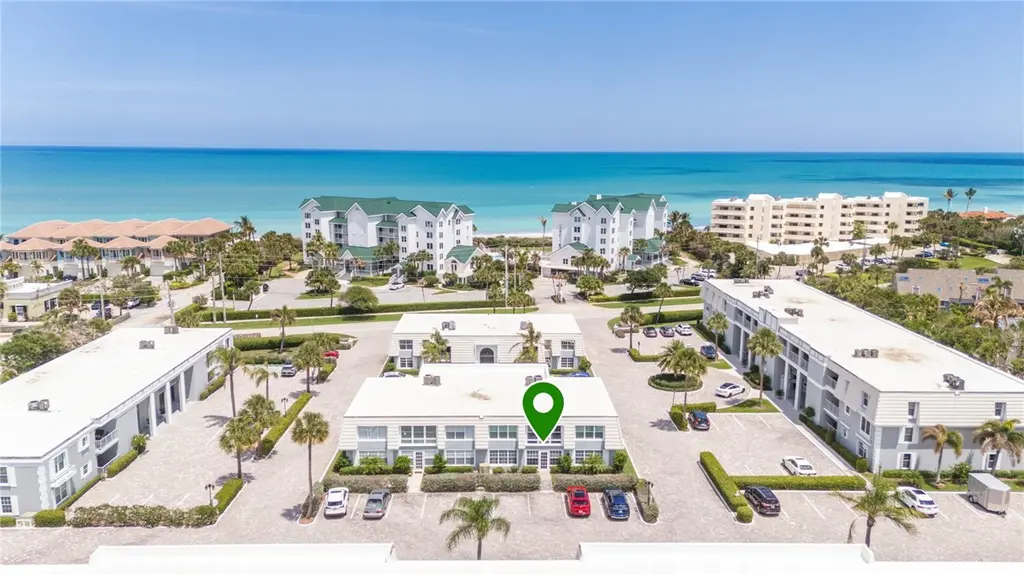
2741 Ocean Dr Unit 31D · Vero Beach, FL
Flood risk 6/10 · Moderate
- FEMA flood zone
- X (unshaded)
- Chance of flooding over 30 yrs
- 0.68%
- Est. flood insurance / yr
- $507 – $1,088
Fire risk 1/10 · Minimal
- Est. fire insurance / yr
- $947 – $1,759
Heat risk 10/10 · Severe
- Hot days now (above 105°F)
- 7 days/yr
- Hot days in 30 yrs
- 25 days/yr
Wind risk 10/10 · Severe
- Chance of severe wind over 30 yrs
- 99.0%
Air-quality risk 1/10 · Minimal
- Unhealthy air days now
- 0 days/yr
- Unhealthy air days in 30 yrs
- 0 days/yr
Risk factors via First Street. Map © Google.
Why this score? — see what drove the C+ grade
The composite is a weighted blend of 9 inputs, each scored 0–100. Each bar is that input's sub-score; the figure is the points it added to the 100-point composite (weight × sub-score).
- Cash flow +22.6/30.0
- 1% rule +7.5/10.0
- ARV discount +7.5/15.0
- DSCR +7.2/10.0
- Rent growth +5.0/5.0
- Schools +4.2/10.0
- Livability +4.0/5.0
- Condition / age +2.5/5.0
- Appreciation +0.0/10.0
$449,000
🖨 Deal sheet (PDF) 📄 Offer letter ✓ Due diligence
Listing remarks MLS
Impressive first floor condo with 1,700 sq. ft. of living space. Bright corner unit with lots of light features a large living room, formal dining room, newer kitchen, 2 walk-in closets in master, glass enclosed porch, tile floors and crown molding. Lovely front covered porch overlooking fountain. Perfect location across from beach access & steps to shops. Sizes approx. /subj. to error.
Key facts
- Newer ac
- Natural light
- Impact glass
Tags
Property features AI
Finance
- Financial info: Pets not allowed
- HOA & community: Managed by First Service Residential; HOA fee of $899 per month; HOA covers water, sewer and trash; Dues paid quarterly; Senior community
Exterior
- Parking: Assigned uncovered parking
- Security: Smoke detector(s)
- Utilities: Public water; Public sewer
- Home design: 2-story building
- Construction: Block and concrete construction; Rolled/hot mop roof
- Exterior features: Covered porch; Porch; Has view; Faces west; Property is attached
Interior
- Kitchen: Range; Microwave; Dishwasher; Refrigerator; Disposal; Electric water heater
- Bedrooms: Bedroom (12x15); Bedroom (13x18)
- Flooring: Tile
- Bathrooms: 2 full bathrooms
- Heating & cooling: Central heating (electric); Central air (electric)
- Interior features: Crown molding; Walk-in closet(s); Blinds
- Laundry & utility: In-unit laundry; Washer; Dryer
Neighborhood map
What this means for you Summary
Snapshot
- This is a 2-bed/2.0-bath townhouse listed at $449k.
Deal economics
- At list price, monthly cash flow is $765 ($9k/yr) — positive.
- The deal already cash-flows at list — no discount required.
- Meets the 1% rule at list price ($6k rent vs $449k).
- Recommended offer: $436k (3.0% below list) — sets the bar for market timing.
- Cap rate 8.3% vs local median 2.9% in Vero Beach — top-decile yield for the area; either an underpriced asset or a hidden risk that comps aren't pricing in. Stress-test before assuming the spread holds.
Location & tenants
- Location reads 80/100 on livability (#116 in FL, #1,784 nationally) — a professional / high-income tenant draw. Strengths: crime A+, commute A+, health & safety A+; Watch: employment D+, amenities D.
- Indian River (other): math 48% / reading 52% proficiency, ranked #35 of 73 in FL (top 48%) — acceptable for families but not a draw, mixed tenant base, ~2y average lease.
- Market conditions: Rents rising fast (+11.0%/yr); 498 active listings in the ZIP; 39 comparable units currently listed for rent nearby; rentals at typical pace (median 22d on market — plan ~3-4 weeks tenant-placement turnaround); high-income renter base; 564 units permitted in Indian River County in 2024 (281 in 5+ unit buildings).
- This rent runs 45% of the median local income ($150k/yr) — at the standard rent-burdened threshold; future hikes will face affordability resistance.
Forward outlook
- Local home prices are declining (-3.0%/yr); year-one equity from $3k of loan paydown is wiped out by about $13k of value loss. Plan a longer hold.
- Indian River County population projected at +18% by 2050 — long-run rental-demand tailwind backs the buy-and-hold thesis.
- At projected returns (-3.0% appreciation + 8.0% rent growth), your $126k cash investment doubles in ~8 years — after that, you're playing with house money.
Negotiation context
- It's been on market 46 days — a 3% lower offer ($436k) is reasonable based on typical stale-listing flexibility.
- 3 sale attempts since 11y ago; this cycle's ask has dropped $26k (5%) from the opening price — seller is motivated, your offer sets the floor, not the list.
- Current owner paid $325k; 38% above their basis — modest negotiation headroom, anchor on the comps not their cost.
Risks & watch-outs
- Climate carrying-cost: major flood risk; severe wind risk, 99% chance of damaging wind over 30y; extreme-heat days projected 7→25/yr by 2055 (HVAC capex compounding) — expect insurance premiums to compound above CPI over the hold.
Questions for the listing agent
- It's been on market 46 days. Have you received any prior offers? Is the seller open to a 3% concession, seller financing, or rate buy-down credit?
- Built in 1972 — when were the roof, HVAC, electrical panel, plumbing, and water heater last replaced?
- What does the HOA fee cover, when was the last increase, and are there any pending special assessments or reserve-fund shortfalls?
- Is there a deadline driving the sale (1031 exchange, divorce, estate, relocation)? That informs how much negotiation room exists.
- What's the average days-on-market for RENTAL listings here right now (not sales)? A rising rental-DOM trend means longer vacancies and softer asking-rent achievability than the comps imply.
- What's the recent tenant-quality profile in this submarket — average credit score on applications, eviction rate, late-payment / NSF rate, and stable-employment percentage? A property-management company in the area should have these aggregated.
- How much new for-sale + rental construction is in the pipeline within 1–3 miles? Heavy new supply typically softens prices + rents 12–24 months out; constrained supply supports both.
Investment metrics
- 1% rule
- 1.25% ✓
- Cap rate
- 8.34%
- Cash-on-cash
- 7.30%
- DSCR
- 1.32
- GRM
- 6.7
CMA / ARV
- ARV (on-the-fly)
- $1,242,906
- Comps found
- 5
Show comp detail 5 sales within ~0.75 mi
| Address | Dist | Beds/Ba | Sqft | Sold | Price | $/sf | Match |
|---|---|---|---|---|---|---|---|
| 2718 Cardinal Dr | 0.09mi | 2/2.5 | 1,712 (-3%) | 2mo | $975,000 | $570 | 88 |
| 1026 Flamevine Ln #202 | 0.10mi | 2/2.0 | 1,780 (+1%) | 11mo | $675,000 | $379 | 84 |
| 2525 Ocean Dr #3 | 0.07mi | 3/3.5 (+1) | 1,800 (+2%) | 3mo | $1,400,000 | $778 | 79 |
| 2523 Ocean Dr #2 | 0.07mi | 3/3.5 (+1) | 1,800 (+2%) | 3mo | $1,575,000 | $875 | 79 |
| 3579 Ocean Dr | 0.71mi | 3/3.0 (+1) | 1,909 (+9%) | 1mo | $1,350,000 | $707 | 43 |
Match score weights: distance 35% · size 25% · config 20% · recency 20%. Top-matched comps best support the ARV.
Projected returns pro-forma
-3.0% appreciation · 8.0% rent growth · sell at horizon
- IRR
- 1.2%
- Equity multiple
- 1.05×
- Total profit
- $5,995
- Equity at exit
- $66,947
- IRR
- 15.8%
- Equity multiple
- 2.63×
- Total profit
- $204,454
- Equity at exit
- $38,821
Cash invested: $125,720 (down + closing). Projections, not guarantees.
Landlord ↔ Tenant lean methodology
- Overall (STATE)
- 87 Strongly Landlord-Friendly
- State Florida
- 87 Strongly Landlord-Friendly · R+3
- County
- — inherits STATE
- City
- — inherits STATE
ZIP-level market 32963
- Rents YoY
- 11.0%
- Active inventory
- 498
- Price-to-rent
- 6.7×
Monthly cashflow live
- Estimated rent
- $5,603 high interval (Pro) →
- Mortgage (P&I)
- −$2,355
- Tax from tax record
- −$221 /mo · $2,650/yr
- Insurance
- −$187
- HOA
- −$899
- Vacancy / Maint / Mgmt
- −$1,177
- Net cashflow
- $765
Break-even live
Sensitivity live
| Price | -10% $1,019 | -5% $892 | +0% $765 | +5% $638 | +10% $511 |
|---|---|---|---|---|---|
| Rent | -10% $322 | -5% $544 | +0% $765 | +5% $986 | +10% $1,207 |
| Rate | -1.0pp $991 | -0.5pp $879 | base $765 | +0.5pp $649 | +1.0pp $530 |
UW: 25.0% down · 7.5% · 30yr · 1.5% tax · 5.0% vac · 8.0% maint · 8.0% mgmt
Financing live
Cash to close
- Down payment
- $112,250
- Closing costs
- $13,470
- Reserves months
- —
- Total cash needed
- —
Loan-product check · same deal, 3 products live
Conventional
25% down · 7.5% · 30yr
- Down + closing
- —
- Monthly P&I
- —
- Monthly cashflow
- —
- DSCR
- —
- Eligible?
- —
Personal DTI + credit; lowest rate.
DSCR
20% down · 8.5% · 30yr
- Down + closing
- —
- Monthly P&I
- —
- Monthly cashflow
- —
- DSCR
- —
- Eligible?
- —
No personal income docs; deal must DSCR.
Hard money
10% down · 12.0% · 12mo
- Down + closing
- —
- Monthly P&I
- —
- Monthly cashflow
- —
- DSCR
- —
- Eligible?
- —
Short-term bridge; refi at stabilization.
Rent comps 39 comps
| Address | Beds | Baths | Sqft | Rent | $/sqft | DOM | Units | Dist |
|---|---|---|---|---|---|---|---|---|
| 2737 Ocean Dr Unit 21B Vero Beach, FL | 2.0 | 2.0 | 1751 | $3,000 | $1.71 | 21d | 1 | 0.03mi |
| 2700 Ocean Dr #501 Vero Beach, FL | 2.0 | 2.0 | 1450 | $8,000 | $5.52 | 21d | 1 | 0.06mi |
| 2704 Cardinal Dr Vero Beach, FL | 2.0 | 1.5 | 1480 | $3,250 | $2.20 | 21d | 1 | 0.08mi |
| 1026 Flamevine Ln Vero Beach, FL | 2.0 | 2.0 | 1790 | $5,250 | $2.93 | 13d | 3 | 0.10mi |
| 786 Dahlia Ln Vero Beach, FL | 3.0 | 2.0 | 1592 | $6,000 | $3.77 | 21d | 1 | 0.29mi |
| 712 Iris Ln Vero Beach, FL | 3.0 | 2.0 | 1924 | $3,500 | $1.82 | 21d | 1 | 0.31mi |
| 706 Iris Ln Vero Beach, FL | 3.0 | 2.5 | 2250 | $5,500 | $2.44 | 13d | 1 | 0.33mi |
| 725 Dahlia Ln Vero Beach, FL | 3.0 | 3.0 | 1455 | $4,500 | $3.09 | 13d | 1 | 0.37mi |
| 626 Gardenia Ln Vero Beach, FL | 3.0 | 2.0 | 1311 | $2,800 | $2.14 | 13d | 1 | 0.39mi |
| 611 Gardenia Ln Vero Beach, FL | 3.0 | 2.5 | 2026 | $15,000 | $7.40 | 13d | 1 | 0.43mi |
| 546 Flamevine Ln Vero Beach, FL | 3.0 | 2.0 | 1638 | $3,000 | $1.83 | 13d | 1 | 0.49mi |
| 535 Flamevine Ln Vero Beach, FL | 2.0 | 2.0 | 1722 | $8,000 | $4.65 | 13d | 1 | 0.52mi |
| 725 Acacia Rd Vero Beach, FL | 3.0 | 2.5 | 1457 | $5,000 | $3.43 | 13d | 1 | 0.60mi |
| 518 River Dr Vero Beach, FL | 3.0 | 3.0 | 2582 | $12,000 | $4.65 | 13d | 1 | 0.62mi |
| 530 Cypress Rd Vero Beach, FL | 3.0 | 3.0 | 1677 | $8,500 | $5.07 | 13d | 1 | 0.81mi |
| 515 Cypress Rd Vero Beach, FL | 2.0 | 2.0 | 1600 | $3,500 | $2.19 | 21d | 1 | 0.85mi |
| 910 Seagrape Ln Vero Beach, FL | 3.0 | 2.0 | 2100 | $16,000 | $7.62 | 13d | 1 | 0.87mi |
| 956 Tulip Ln Vero Beach, FL | 2.0 | 2.0 | 1540 | $3,500 | $2.27 | 21d | 1 | 0.93mi |
| 3939 Ocean Dr Unit B-407 Vero Beach, FL | 3.0 | 2.0 | 1700 | $7,000 | $4.12 | 21d | 1 | 0.99mi |
| 326 Date Palm Rd Vero Beach, FL | 3.0 | 2.0 | 1720 | $10,000 | $5.81 | 13d | 1 | 1.01mi |
| 4049 Ocean Dr Vero Beach, FL | 2.0 | 2.0 | 1250 | $3,750 | $3.00 | 21d | 2 | 1.04mi |
| 4009 Silver Palm Dr #3 Vero Beach, FL | 2.0 | 2.5 | 1430 | $5,100 | $3.57 | 21d | 1 | 1.06mi |
| 537 E Causeway Blvd Vero Beach, FL | 3.0 | 2.0 | 1931 | $7,500 | $3.88 | 13d | 1 | 1.07mi |
| 4019 Silver Palm Dr #8 Vero Beach, FL | 2.0 | 2.5 | 1460 | $3,000 | $2.05 | 21d | 1 | 1.07mi |
| 3816 Mockingbird Dr Vero Beach, FL | 3.0 | 3.0 | 1600 | $13,000 | $8.12 | 21d | 1 | 1.07mi |
| 527 E Causeway Blvd Vero Beach, FL | 3.0 | 2.5 | 2320 | $9,900 | $4.27 | 13d | 1 | 1.08mi |
| 1700 Ocean Dr Unit 302V Vero Beach, FL | 2.0 | 2.0 | 1480 | $3,300 | $2.23 | 21d | 1 | 1.08mi |
| 1700 Ocean Dr #201 Vero Beach, FL | 2.0 | 2.0 | 1480 | $4,000 | $2.70 | 21d | 1 | 1.08mi |
| 1616 Ocean Dr Unit 303V Vero Beach, FL | 2.0 | 2.0 | 1480 | $6,200 | $4.19 | 21d | 1 | 1.11mi |
| 1636 Indian Bay Dr Vero Beach, FL | 3.0 | 2.0 | 2086 | $12,000 | $5.75 | 13d | 1 | 1.14mi |
| 4141 Ocean Dr Vero Beach, FL | 2.0–3.0 | 2.0 | 1200 | $3,500 | $2.92 | 13d | 4 | 1.18mi |
| 1513 E Camino del Rio Vero Beach, FL | 3.0 | 2.5 | 2569 | $12,000 | $4.67 | 13d | 1 | 1.19mi |
| 4150 Highway A1A #111 Vero Beach, FL | 2.0 | 2.0 | 1300 | $2,600 | $2.00 | 21d | 1 | 1.22mi |
| 1480 Ocean Dr Vero Beach, FL | 2.0 | 2.0 | 1230 | $6,250 | $5.08 | 21d | 4 | 1.32mi |
| 940 Turtle Cove Ln #210 Vero Beach, FL | 3.0 | 2.0 | 1916 | $7,500 | $3.91 | 21d | 1 | 1.39mi |
| 1890 Tarpon Ln #302 Vero Beach, FL | 3.0 | 2.0 | 1844 | $8,000 | $4.34 | 21d | 1 | 1.46mi |
| 1840 Tarpon Ln Unit D202 Vero Beach, FL | 2.0 | 2.0 | 1400 | $2,500 | $1.79 | 21d | 1 | 1.48mi |
| 4600 Highway A1A #507 Vero Beach, FL | 2.0 | 2.0 | 1400 | $5,000 | $3.57 | 21d | 1 | 1.49mi |
| 4600 Highway A1A #409 Vero Beach, FL | 2.0 | 2.0 | 1725 | $7,500 | $4.35 | 21d | 1 | 1.49mi |
HOA detail
- Monthly dues
- $899 · $10,788/yr
Listing history 30 events
-
2026-06-19days on market $449,000 Active 46 DOM
-
2026-06-18days on market $449,000 Active 45 DOM
-
2026-06-17days on market $449,000 Active 44 DOM
-
2026-06-16days on market $449,000 Active 43 DOM
-
2026-06-15days on market $449,000 Active 42 DOM
-
2026-06-14days on market $449,000 Active 40 DOM
-
2026-06-13pricedays on market $449,000 Active 39 DOM
-
2026-06-10days on market $474,900 Active 37 DOM
-
2026-06-09days on market $474,900 Active 36 DOM
-
2026-06-08days on market $474,900 Active 35 DOM
-
2026-06-07days on market $474,900 Active 34 DOM
-
2026-06-05days on market $474,900 Active 31 DOM
-
2026-06-02days on market $474,900 Active 29 DOM
-
2026-06-01days on market $474,900 Active 28 DOM
-
2026-05-31days on market $474,900 Active 27 DOM
-
2026-05-30days on market $474,900 Active 26 DOM
-
2026-05-04$474,900 Active
-
2026-04-21price $474,900
-
2026-04-06price $484,900
-
2026-03-17price $489,000
-
2026-03-03price $499,000
-
2026-02-11price $514,900
-
2026-01-05price $534,900
-
2025-10-24$549,900 Active
-
2015-04-30soldstatus $325,000
-
2015-04-29soldstatus $325,000 395-char remark
Show marketing remark (395 chars)
Impressive first floor condo with 1,700 sq. ft. of living space. Bright corner unit with lots of light features a large living room, formal dining room, newer kitchen, 2 walk-in closets in master, glass enclosed porch, tile floors and crown molding. Lovely front covered porch overlooking fountain. Perfect location across from beach access & steps to shops. Sizes approx. /subj. to error.
-
2015-03-01historical
-
2015-02-14$325,000
-
2009-03-11soldstatus $295,000
-
2004-07-23soldstatus $280,000
ⓘ Source: listings_history table (triggers on properties + properties_extension) + one-shot
backfill from property_details.listing_events for pre-trigger history.
Tax reassessment forecast FL · Resets to sale price
- Current annual tax
- $2,650 · $221/mo
- Projected year-2 tax
- $3,727 · $311/mo
- Expected delta
- +$1,077/yr (+$90/mo · 40.7%)
ⓘ Screening estimate from a state-policy table — verify with the county assessor before closing.
Climate risk First Street
- Flood 6/10 Major FEMA zone X (unshaded) · 68% chance over 30 yrs
- Wildfire 1/10 Low
- Heat 10/10 Extreme 7 d/yr ≥105°F today · 25 d/yr by 30 yrs out
- Wind 10/10 Extreme 99% chance of damaging wind over 30 yrs
- Air quality 1/10 Low 0 unhealthy d/yr today · 0 by 30 yrs out
Nearby sold comps map
Loading sold comps map…
Walkable amenities ~0.75 mi
Loading nearby amenities…
Taxation est. · year 1
- Rental income
- $67,236
- − Mortgage interest
- −$25,151
- − Property taxes
- −$2,650
- − Insurance
- −$2,245
- − Repairs & maintenance
- −$5,379
- − Management
- −$5,379
- − HOA
- −$10,788
- − Depreciation
- −$13,062
- Taxable income
- $2,582
- Est. tax owed @ 24.0%
- −$620
- After-tax cash flow
- $8,558/yr
For passive investors: Depreciation is non-cash, so a rental often shows a tax loss while cash-flowing — sheltering income. Rental losses are passive: they offset passive income freely, and up to $25,000/yr can offset ordinary (W-2) income if you actively participate and your MAGI is under $100k (phasing out to $0 by $150k); unused losses carry forward. On sale, claimed depreciation is recaptured at up to 25%, and gains may owe capital-gains tax (a 1031 exchange can defer both). Figures are a year-1 estimate at your 24.0% rate — not tax advice; consult a CPA.
Schools (NCES district)
- District
- Indian River
- NCES district ID
- 1200930
- Math proficiency
- 48% ▼ -9.00%
- Reading proficiency
- 52% ▼ -3.00%
- Median HH income
- $46,597
- Composite
- 42.45/100
- National rank
- #3218
- State rank
- #35 of 73 in FL
Livability — Vero Beach
- Score
- 80/100
- State rank
- #116
- US rank
- #1784
Category grades
Schools grade is shown separately in the Schools card above.
Census & demographics
- Census place
- Vero Beach, FL
- County
- Indian River County · 143,738 people
- City population
- 98,707
- Metro
- Sebastian-Vero Beach, FL
- Population (ZIP)
- 15,008
- Household income
- $149,923
- Rent vs Own
- Severe rent burden
- 119.0
Population outlook (Indian River County) Hauer SSP2
- Today (2025)
- 165,104 people
- By 2030
- 172,869 · +4.7%
- By 2040
- 185,640 · +12.4%
- By 2050
- 194,465 · +17.8%
- By 2075
- 211,115 · +27.9%
- By 2100
- 211,781 · +28.3%
Race, ethnicity, and origin ACS 2023
- Neighborhood character
- Predominantly White (92%)
- Race & ethnicity
- White 92% Two or more races 5% Hispanic / Latino 4% Asian 2%
- Common ancestry
- Slovak 5% Lithuanian 4% Italian 3%
- Foreign-born
- 9% · Canada
- Languages at home
- 92% English-only · Spanish 3% Other Indo-European 1% German/W. Germanic 1%
Political lean MEDSL · Indian River
- 2024 margin
- Strong R (+27.4) · D 36.0% · R 63.4%
- 2008→2024 swing
- -12.5pp toward R · 2008: -14.8pp · 2024: -27.4pp
- All cycles
- 2024: R+27.4 2020: R+21.6 2016: R+24.5 2012: R+22.3 2008: R+14.8
Not yet ingested
- Civics
- —
Market trends
- HPI YoY
- ▼ -180.47%
- Current HPI
- 312.0326
- Rent YoY
- ▲ 11.04%
- Metro
- Sebastian-Vero Beach, FL
- State GDP YoY
- ▲ 3.28%
- F500 in state
- 36
Industry mix (Fortune 500 HQ in FL)
| Industry | F500 HQs | Revenue |
|---|---|---|
| Industrial Technology | 2 | $29B |
|
||
| Insurance | 2 | $17B |
|
||
| Retail | 1 | $60B |
|
||
| Technology Distribution | 1 | $58B |
|
||
| Homebuilding | 1 | $35B |
|
||
| Technology Manufacturing | 1 | $35B |
|
||
Price history
+69.6% since first listed14 events — show timeline
- 2026-05-04 Listed $474,900 RAIRCMLS
- 2026-04-21 Price Changed $474,900 RAIRCMLS
- 2026-04-06 Price Changed $484,900 RAIRCMLS
- 2026-03-17 Price Changed $489,000 RAIRCMLS
- 2026-03-03 Price Changed $499,000 RAIRCMLS
- 2026-02-11 Price Changed $514,900 RAIRCMLS
- 2026-01-05 Price Changed $534,900 RAIRCMLS
- 2025-10-24 Listed $549,900 RAIRCMLS
- 2015-04-30 Sold (Public Records) $325,000 Public Records
- 2015-04-29 Sold (MLS) $325,000 RAIRCMLS
- 2015-03-01 Listing Removed — Beaches MLS
- 2015-02-14 Listed $325,000 Beaches MLS
- 2009-03-11 Sold (Public Records) $295,000 Public Records
- 2004-07-23 Sold (Public Records) $280,000 Public Records
Property tax history
-1.5%/yrLatest (2025): $2,650 · +15.1% YoY. Source: county tax records.
Cash-flow waterfall
monthlySold comps — $/sqft
last 12 mo · ≤1 miLoading sold comps…