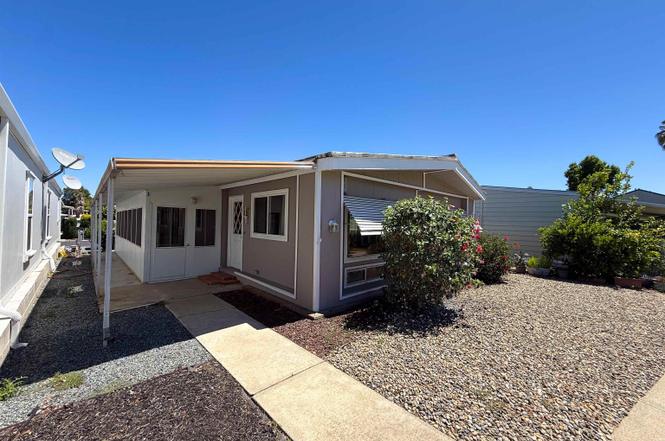
2203 Dalis Dr #127 · Concord, CA
Flood risk 9/10 · Severe
- FEMA flood zone
- X (unshaded)
- Chance of flooding over 30 yrs
- 0.99%
- Est. flood insurance / yr
- $507 – $1,088
Fire risk 5/10 · Moderate
- Est. fire insurance / yr
- $659 – $1,223
Heat risk 4/10 · Minor
- Hot days now (above 97°F)
- 7 days/yr
- Hot days in 30 yrs
- 13 days/yr
Wind risk 1/10 · Minimal
- Chance of severe wind over 30 yrs
- —
Air-quality risk 9/10 · Severe
- Unhealthy air days now
- 18 days/yr
- Unhealthy air days in 30 yrs
- 19 days/yr
Risk factors via First Street. Map © Google.
Why this score? — see what drove the B+ grade
The composite is a weighted blend of 9 inputs, each scored 0–100. Each bar is that input's sub-score; the figure is the points it added to the 100-point composite (weight × sub-score).
- Cash flow +30.0/30.0
- ARV discount +15.0/15.0
- 1% rule +10.0/10.0
- DSCR +10.0/10.0
- Schools +3.8/10.0
- Livability +3.2/5.0
- Rent growth +2.9/5.0
- Condition / age +2.5/5.0
- Appreciation +0.0/10.0
$127,000
🖨 Deal sheet 📄 Offer letter ✓ Due diligence
Listing remarks MLS
WELL MAINTAINED HOME. BEAUTIFUL AMANA COOK TOP. NEW FURNACE. NEW DOUBLE PANE WINDOWS. OWNER ANXIOUS. LEAVING AREA. THIS IS A
Key facts
- Community pool
- Built 1971
Property features AI
Finance
- Other: Community pool
- HOA & community: Pets allowed; Community features include clubhouse, greenbelt, pool, sauna, and spa; Senior community (Dalis Gardens)
Exterior
- Parking: Carport for 2 or more vehicles
- Utilities: Public water; Public sewer
- Home design: Manufactured in park (mobile home); Double wide
- Construction: Wood siding
- Exterior features: Patio (covered and enclosed); Back yard; Side yard; Storage shed(s); Landscaped
Interior
- Kitchen: Dishwasher; Microwave; Built-in oven; Refrigerator; Laminate counters; Breakfast bar
- Flooring: Laminate flooring; Carpet
- Bathrooms: 2 bathrooms (both full)
- Heating & cooling: Forced air heating; Central air; Ceiling fans
- Interior features: Breakfast bar; Pantry; No additional rooms
- Laundry & utility: Washer and dryer included
Neighborhood map
What this means for you Summary
Snapshot
- This is a 2-bed/2.0-bath manufactured listed at $127k.
Deal economics
- At list price, monthly cash flow is $1k ($13k/yr) — positive.
- The deal already cash-flows at list — no discount required.
- Meets the 1% rule at list price ($3k rent vs $127k).
- Cap rate 17.3% vs local median 2.8% in Concord — top-decile yield for the area; either an underpriced asset or a hidden risk that comps aren't pricing in. Stress-test before assuming the spread holds.
Location & tenants
- Location reads 65/100 on livability (#397 in CA) — a middle-class / working-renter tenant base. Strengths: employment A+, health & safety A+, housing B; Watch: schools C-, crime F, amenities F.
- Mt. Diablo Unified (suburban): math 36% / reading 45% proficiency, ranked #202 of 517 in CA (top 39%) — families likely to look elsewhere, expect single-tenant / working-renter base with shorter leases.
- Market conditions: Rents rising (+1.6%/yr); 116 active listings in the ZIP; 9 comparable units currently listed for rent nearby; rentals at typical pace (median 24d on market — plan ~3-4 weeks tenant-placement turnaround); solid renter incomes; 2,169 units permitted in Contra Costa County in 2024 (896 in 5+ unit buildings).
- This rent runs 38% of the median local income ($82k/yr) — at the standard rent-burdened threshold; future hikes will face affordability resistance.
Forward outlook
- Local home prices are declining (-3.0%/yr); year-one equity from $878 of loan paydown is wiped out by about $4k of value loss. Plan a longer hold.
- Contra Costa County population projected at +26% by 2050 — long-run rental-demand tailwind backs the buy-and-hold thesis.
- At projected returns (-3.0% appreciation + 1.6% rent growth), your $36k cash investment doubles in ~4 years — after that, you're playing with house money.
Negotiation context
- Only 1 days on market — expect competitive offers; lowballing is unlikely to land.
- 2 sale attempts since 24y ago with the ask held roughly flat each time — persistent listings suggest the price (not the market) is what's stuck; bring a comps-based counter.
- Current owner paid $86k; 48% above their basis — modest negotiation headroom, anchor on the comps not their cost.
Risks & watch-outs
- Watch-outs: flood insurance adds $66/mo.
- Climate carrying-cost: severe flood risk; moderate wildfire risk — expect insurance premiums to compound above CPI over the hold.
Questions for the listing agent
- Built in 1971 — when were the roof, HVAC, electrical panel, plumbing, and water heater last replaced?
- What's the actual annual flood-insurance premium (NFIP or private), and is the property in a SFHA with mandatory coverage?
- Is there a deadline driving the sale (1031 exchange, divorce, estate, relocation)? That informs how much negotiation room exists.
- Crime grade is F in this area — have there been break-ins, vandalism, or insurance claims at this property in the last 3 years? What carrier currently insures it and at what premium?
- What's the average days-on-market for RENTAL listings here right now (not sales)? A rising rental-DOM trend means longer vacancies and softer asking-rent achievability than the comps imply.
- What's the recent tenant-quality profile in this submarket — average credit score on applications, eviction rate, late-payment / NSF rate, and stable-employment percentage? A property-management company in the area should have these aggregated.
- How much new for-sale + rental construction is in the pipeline within 1–3 miles? Heavy new supply typically softens prices + rents 12–24 months out; constrained supply supports both.
Investment metrics
- 1% rule
- 2.04% ✓
- Cap rate
- 17.34%
- Cash-on-cash
- 39.47%
- DSCR
- 2.76
- GRM
- 4.1
CMA / ARV
- ARV (on-the-fly)
- $159,840
- Comps found
- 12
Show comp detail 12 sales within ~0.75 mi
| Address | Dist | Beds/Ba | Sqft | Sold | Price | $/sf | Match |
|---|---|---|---|---|---|---|---|
| 2227 Dalis Dr #159 | 0.02mi | 2/2.0 | 1,440 (0%) | 4mo | $129,950 | $90 | 95 |
| 2122 Dalis Dr #236 | 0.12mi | 2/2.0 | 1,440 (0%) | 3mo | $217,000 | $151 | 92 |
| 2259 Dalis Dr | 0.07mi | 2/2.0 | 1,440 (0%) | 6mo | $150,000 | $104 | 92 |
| 2110 Dalis #238 | 0.12mi | 2/2.0 | 1,440 (0%) | 11mo | $160,000 | $111 | 85 |
| 2217 Dalis Dr #134 | 0.04mi | 2/2.0 | 1,440 (0%) | 17mo | $148,500 | $103 | 84 |
| 2019 Dalis Dr #42 | 0.21mi | 2/2.0 | 1,440 (0%) | 11mo | $140,000 | $97 | 81 |
| 2137 Dalis Dr #95 | 0.09mi | 2/2.0 | 1,500 (+4%) | 11mo | $150,000 | $100 | 80 |
| 2031 Dalis Dr #48 | 0.22mi | 3/2.0 (+1) | 1,488 (+3%) | 6mo | $218,000 | $147 | 74 |
| 2161 Dalis Dr #107 | 0.07mi | 2/2.0 | 1,248 (-13%) | 7mo | $125,000 | $100 | 69 |
| 2113 Dalis Dr #87 | 0.07mi | 2/2.0 | 1,248 (-13%) | 9mo | $162,500 | $130 | 67 |
| 2006 Dalis Dr #256 | 0.27mi | 2/2.0 | 1,344 (-7%) | 13mo | $199,000 | $148 | 65 |
| 1027 Peralta Rd #12 | 0.27mi | 2/2.0 | 1,248 (-13%) | 11mo | $195,000 | $156 | 56 |
Match score weights: distance 35% · size 25% · config 20% · recency 20%. Top-matched comps best support the ARV.
Projected returns pro-forma
-3.0% appreciation · 1.59% rent growth · sell at horizon
- IRR
- 31.5%
- Equity multiple
- 2.30×
- Total profit
- $46,132
- Equity at exit
- $18,936
- IRR
- 37.8%
- Equity multiple
- 4.28×
- Total profit
- $116,501
- Equity at exit
- $10,981
Cash invested: $35,560 (down + closing). Projections, not guarantees.
Landlord ↔ Tenant lean methodology
- Overall (STATE)
- 18 Strongly Tenant-Friendly
- State California
- 18 Strongly Tenant-Friendly · D+13
- County
- — inherits STATE
- City
- — inherits STATE
ZIP-level market 94520
- Rents YoY
- 1.6%
- Active inventory
- 116
- Price-to-rent
- 4.1×
Monthly cashflow live
- Estimated rent
- $2,591 high interval (Pro) →
- Mortgage (P&I)
- −$666
- Tax est. 1.5%
- −$159 /mo · $1,905/yr
- Insurance
- −$53
- Flood insurance flood zone
- −$66 /mo · $798/yr
- HOA
- −$0
- Vacancy / Maint / Mgmt
- −$544
- Net cashflow
- $1,103
Break-even live
UW: 25.0% down · 7.5% · 30yr · 1.5% tax · 5.0% vac · 8.0% maint · 8.0% mgmt
Financing live
Cash to close
- Down payment
- $31,750
- Closing costs
- $3,810
- Reserves months
- —
- Total cash needed
- —
Loan-product check · same deal, 3 products live
Conventional
25% down · 7.5% · 30yr
- Down + closing
- —
- Monthly P&I
- —
- Monthly cashflow
- —
- DSCR
- —
- Eligible?
- —
Personal DTI + credit; lowest rate.
DSCR
20% down · 8.5% · 30yr
- Down + closing
- —
- Monthly P&I
- —
- Monthly cashflow
- —
- DSCR
- —
- Eligible?
- —
No personal income docs; deal must DSCR.
Hard money
10% down · 12.0% · 12mo
- Down + closing
- —
- Monthly P&I
- —
- Monthly cashflow
- —
- DSCR
- —
- Eligible?
- —
Short-term bridge; refi at stabilization.
Rent comps 9 comps
| Address | Beds | Baths | Sqft | Rent | $/sqft | DOM | Units | Dist |
|---|---|---|---|---|---|---|---|---|
| 2069 Olivera Rd Concord, CA | 2.0 | 1.5 | 975 | $2,450 | $2.51 | 24d | 1 | 0.15mi |
| 2225 Hillsborough Ct Apt 2 Concord, CA | 2.0 | 1.0 | 962 | $2,200 | $2.29 | 5d | 1 | 0.28mi |
| 2007 Olivera Rd Unit C Concord, CA | 2.0 | 1.5 | 975 | $2,700 | $2.77 | 5d | 1 | 0.31mi |
| 2838 Loma Vista Ave Concord, CA | 3.0 | 2.0 | 1260 | $2,995 | $2.38 | 24d | 1 | 0.54mi |
| 2451 Olivera Rd Concord, CA | 1.0–2.0 | 1.0 | 815 | $2,475 | $3.04 | 1d | 6 | 0.60mi |
| 3412 Flamingo Dr #3410 Concord, CA | 3.0 | 2.0 | 1062 | $4,000 | $3.77 | 24d | 1 | 0.67mi |
| 2756 Argyll Ave Unit C Concord, CA | 2.0 | 1.0 | 900 | $2,000 | $2.22 | 24d | 1 | 0.79mi |
| 3378 Moretti Dr Concord, CA | 3.0 | 2.0 | 1242 | $3,695 | $2.98 | 24d | 1 | 1.18mi |
| 2477 Pacheco St Concord, CA | 3.0 | 2.0 | 1200 | $3,400 | $2.83 | 18d | 1 | 1.46mi |
Listing history 2 events
-
2026-06-18remarks 699-char remark
-
2026-06-18$127,000 Active 1 DOM
ⓘ Source: listings_history table (triggers on properties + properties_extension) + one-shot
backfill from property_details.listing_events for pre-trigger history.
Climate risk First Street
- Flood 9/10 Extreme FEMA zone X (unshaded) · 99% chance over 30 yrs
- Wildfire 5/10 Major
- Heat 4/10 Moderate 7 d/yr ≥97°F today · 13 d/yr by 30 yrs out
- Wind 1/10 Low
- Air quality 9/10 Extreme 18 unhealthy d/yr today · 19 by 30 yrs out
Nearby sold comps map
Loading sold comps map…
Walkable amenities ~0.75 mi
Loading nearby amenities…
Taxation est. · year 1
- Rental income
- $31,097
- − Mortgage interest
- −$7,114
- − Property taxes
- −$1,905
- − Insurance
- −$1,432
- − Repairs & maintenance
- −$2,488
- − Management
- −$2,488
- − Depreciation
- −$3,695
- Taxable income
- $11,976
- Est. tax owed @ 24.0%
- −$2,874
- After-tax cash flow
- $10,363/yr
For passive investors: Depreciation is non-cash, so a rental often shows a tax loss while cash-flowing — sheltering income. Rental losses are passive: they offset passive income freely, and up to $25,000/yr can offset ordinary (W-2) income if you actively participate and your MAGI is under $100k (phasing out to $0 by $150k); unused losses carry forward. On sale, claimed depreciation is recaptured at up to 25%, and gains may owe capital-gains tax (a 1031 exchange can defer both). Figures are a year-1 estimate at your 24.0% rate — not tax advice; consult a CPA.
Schools (NCES district)
- District
- Mt. Diablo Unified
- NCES district ID
- 0626370
- Math proficiency
- 36% ▼ -2.00%
- Reading proficiency
- 45% ▼ -5.00%
- Median HH income
- $77,494
- Composite
- 37.5/100
- National rank
- #4401
- State rank
- #202 of 517 in CA
Livability — Concord
- Score
- 65/100
- State rank
- #397
- US rank
- #13519
Category grades
Schools grade is shown separately in the Schools card above.
Census & demographics
- Census place
- Concord, CA
- County
- Contra Costa County · 1,059,880 people
- City population
- 125,693
- Metro
- San Francisco-Oakland-Berkeley, CA
- Population (ZIP)
- 37,381
- Household income
- $82,479
- Rent vs Own
- Severe rent burden
- 2649.0
Population outlook (Contra Costa County) Hauer SSP2
- Today (2025)
- 1,287,720 people
- By 2030
- 1,364,937 · +6.0%
- By 2040
- 1,506,209 · +17.0%
- By 2050
- 1,624,373 · +26.1%
- By 2075
- 1,853,193 · +43.9%
- By 2100
- 1,901,231 · +47.6%
Race, ethnicity, and origin ACS 2023
- Neighborhood character
- Diverse neighborhood (Simpson 0.65)
- Race & ethnicity
- Hispanic / Latino 51% White 28% Two or more races 20% Asian 10% Black 4% Native American 2%
- Hispanic origin (detail)
- Mexican 35% Puerto Rican 3%
- Common ancestry
- Lithuanian 2% Italian 2% Russian 1%
- Foreign-born
- 35% · Canada, China, Vietnam
- Languages at home
- 43% English-only · Spanish 43% Tagalog/Filipino 3% Other Indo-European 2%
Political lean MEDSL · Contra Costa
- 2024 margin
- Solid D (+38.0) · D 67.3% · R 29.4% · Other 3.3%
- 2008→2024 swing
- +0.2pp no change · 2008: 37.8pp · 2024: 38.0pp
- All cycles
- 2024: D+38.0 2020: D+45.3 2016: D+43.5 2012: D+33.7 2008: D+37.8
Not yet ingested
- Civics
- —
Market trends
- HPI YoY
- ▼ -551.74%
- Current HPI
- 440.2872
- Rent YoY
- ▲ 1.59%
- Metro
- San Francisco-Oakland-Berkeley, CA
- State GDP YoY
- ▲ 3.21%
- F500 in state
- 116
Industry mix (Fortune 500 HQ in CA)
| Industry | F500 HQs | Revenue |
|---|---|---|
| Technology | 27 | $1,492B |
|
||
| Financial Services | 3 | $174B |
|
||
| Retail | 3 | $44B |
|
||
| Insurance | 3 | $26B |
|
||
| Media / Entertainment | 2 | $115B |
|
||
| Pharmaceuticals / Biotech | 2 | $62B |
|
||
Price history
+47.8% since first listed4 events — show timeline
- 2026-06-18 Listed $127,000 bridgeMLS, Bay East AOR, or Contra Costa AOR
- 2003-06-02 Sold (MLS) $86,000 bridgeMLS, Bay East AOR, or Contra Costa AOR
- 2003-03-26 Listing Removed — bridgeMLS, Bay East AOR, or Contra Costa AOR
- 2002-12-05 Listed $85,950 bridgeMLS, Bay East AOR, or Contra Costa AOR
Cash-flow waterfall
monthlySold comps — $/sqft
last 12 mo · ≤1 miLoading sold comps…