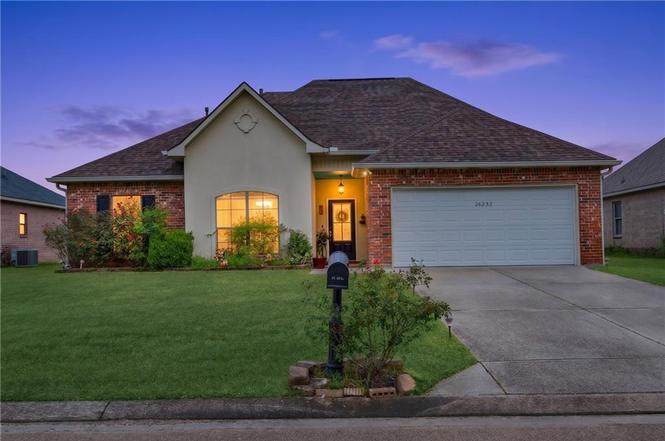
26232 Burlwood Ave · Walker, LA
Flood risk 1/10 · Minimal
- FEMA flood zone
- X (unshaded)
- Chance of flooding over 30 yrs
- 0.0%
- Est. flood insurance / yr
- $507 – $1,088
Fire risk 4/10 · Minor
- Est. fire insurance / yr
- $1,269 – $2,357
Heat risk 8/10 · Major
- Hot days now (above 108°F)
- 7 days/yr
- Hot days in 30 yrs
- 22 days/yr
Wind risk 9/10 · Severe
- Chance of severe wind over 30 yrs
- 99.0%
Air-quality risk 3/10 · Minor
- Unhealthy air days now
- 2 days/yr
- Unhealthy air days in 30 yrs
- 3 days/yr
Risk factors via First Street. Map © Google.
Why this score? — see what drove the C grade
The composite is a weighted blend of 9 inputs, each scored 0–100. Each bar is that input's sub-score; the figure is the points it added to the 100-point composite (weight × sub-score).
- Cash flow +18.7/30.0
- ARV discount +13.4/15.0
- DSCR +5.9/10.0
- 1% rule +4.5/10.0
- Schools +4.0/10.0
- Livability +3.8/5.0
- Rent growth +3.5/5.0
- Condition / age +2.5/5.0
- Appreciation +0.0/10.0
$215,000
🖨 Deal sheet (PDF) 📄 Offer letter ✓ Due diligence
Listing remarks MLS
Welcome to Woodland Crossing, only minutes from interstate and all Walker and Denham Springs has to offer. This home offers calming lake views great for relaxing evenings and mornings. Priced below appraised value this home brings instant equity. Vacant as easy to show
Key facts
- Lake views
- 9,156 sq ft lot
- Garage
Tags
Property features AI
Exterior
- Parking: Garage; Off-street parking; Three or more spaces
- Utilities: Public water; Public sewer; Property has heating and cooling
- Home design: Single-story; Very good condition
- Construction: Brick and stucco construction; Shingle roof; Slab foundation; Built in 1
- Exterior features: Outside city limits; Rectangular lot; Lake frontage
Interior
- Bathrooms: 2 full bathrooms
- Heating & cooling: Central heating; Central air conditioning
- Interior features: High speed internet; Pantry; Accessibility features
Neighborhood map
What this means for you Summary
Snapshot
- This is a 3-bed/2.0-bath single-family listed at $215k.
Deal economics
- At list price, monthly cash flow is $213 ($3k/yr) — positive.
- The deal already cash-flows at list — no discount required.
- To meet the 1% rule (rent ≥ 1% of price), the offer needs to be $205k (4.7% below list).
- Recommended offer: $205k (4.7% below list) — sets the bar for 1% rule.
- Cap rate 7.5% vs local median 4.8% in Walker — top-decile yield for the area; either an underpriced asset or a hidden risk that comps aren't pricing in. Stress-test before assuming the spread holds.
Location & tenants
- Location reads 75/100 on livability (#19 in LA, #3,999 nationally) — a middle-class / working-renter tenant base. Strengths: cost of living A+, housing A+, health & safety A+; Watch: crime F, amenities D-, commute F.
- Livingston Parish (suburban): math 40% / reading 52% proficiency, ranked #13 of 98 in LA (top 13%) — families likely to look elsewhere, expect single-tenant / working-renter base with shorter leases.
- Market conditions: Rents rising (+3.8%/yr); 976 active listings in the ZIP; 2 comparable units currently listed for rent nearby; solid renter incomes; 794 units permitted in Livingston Parish in 2024 (99 in 5+ unit buildings).
- This rent runs 31% of the median local income ($79k/yr) — at the standard rent-burdened threshold; future hikes will face affordability resistance.
Forward outlook
- Local home prices are declining (-3.0%/yr); year-one equity from $1k of loan paydown is wiped out by about $6k of value loss. Plan a longer hold.
- Livingston County population projected at +27% by 2050 — long-run rental-demand tailwind backs the buy-and-hold thesis.
Negotiation context
- Only 3 days on market — expect competitive offers; lowballing is unlikely to land.
- 3 sale attempts with the ask held roughly flat each time — persistent listings suggest the price (not the market) is what's stuck; bring a comps-based counter.
Risks & watch-outs
- Climate carrying-cost: severe wind risk, 99% chance of damaging wind over 30y; extreme-heat days projected 7→22/yr by 2055 (HVAC capex compounding) — expect insurance premiums to compound above CPI over the hold.
Questions for the listing agent
- Is there a deadline driving the sale (1031 exchange, divorce, estate, relocation)? That informs how much negotiation room exists.
- Schools are A-rated — typically a magnet for longer-tenancy family renters. What's the average tenant stay here, and is there a school-zone premium baked into asking?
- Crime grade is F in this area — have there been break-ins, vandalism, or insurance claims at this property in the last 3 years? What carrier currently insures it and at what premium?
- What's the average days-on-market for RENTAL listings here right now (not sales)? A rising rental-DOM trend means longer vacancies and softer asking-rent achievability than the comps imply.
- What's the recent tenant-quality profile in this submarket — average credit score on applications, eviction rate, late-payment / NSF rate, and stable-employment percentage? A property-management company in the area should have these aggregated.
- How much new for-sale + rental construction is in the pipeline within 1–3 miles? Heavy new supply typically softens prices + rents 12–24 months out; constrained supply supports both.
Investment metrics
- 1% rule
- 0.95% ✗
- Cap rate
- 7.48%
- Cash-on-cash
- 4.24%
- DSCR
- 1.19
- GRM
- 8.7
CMA / ARV
- ARV (on-the-fly)
- $247,250
- Comps found
- 12
Show comp detail 12 sales within ~0.75 mi
| Address | Dist | Beds/Ba | Sqft | Sold | Price | $/sf | Match |
|---|---|---|---|---|---|---|---|
| 12783 Bonnie Bleu Dr | 0.08mi | 3/2.0 | 1,894 (-4%) | 3mo | $206,000 | $109 | 86 |
| 26373 Poplar Glen Dr | 0.09mi | 4/2.0 (+1) | 2,000 (+1%) | 10mo | $260,000 | $130 | 80 |
| 26017 Willow Wood St | 0.24mi | 3/2.0 | 1,894 (-4%) | 3mo | $249,000 | $131 | 79 |
| 12726 Bonnie Bleu Dr | 0.15mi | 4/2.0 (+1) | 1,998 (+1%) | 10mo | $239,900 | $120 | 78 |
| 26184 Glenbrooke Dr | 0.34mi | 4/2.0 (+1) | 1,998 (+1%) | 2mo | $249,500 | $125 | 76 |
| 26328 Millstone Dr | 0.24mi | 4/2.0 (+1) | 1,998 (+1%) | 10mo | $250,000 | $125 | 74 |
| 26096 Avondale Ct | 0.16mi | 3/2.0 | 1,829 (-8%) | 9mo | $207,000 | $113 | 72 |
| 12795 Bonnie Bleu Dr | 0.08mi | 3/2.0 | 1,695 (-14%) | 4mo | $229,999 | $136 | 69 |
| 12495 Buddy Ellis Rd | 0.68mi | 4/3.0 (+1) | 1,926 (-3%) | 4mo | $235,000 | $122 | 52 |
| 25672 Buffwood St | 0.64mi | 4/2.0 (+1) | 1,820 (-8%) | 5mo | $235,000 | $129 | 48 |
| 26565 Parkwood Dr | 0.73mi | 3/2.0 | 1,684 (-15%) | 0mo | $225,000 | $134 | 41 |
| 12405 Buddy Ellis Rd | 0.75mi | 3/1.5 | 1,792 (-9%) | 8mo | $219,900 | $123 | 41 |
Match score weights: distance 35% · size 25% · config 20% · recency 20%. Top-matched comps best support the ARV.
Projected returns pro-forma
-3.0% appreciation · 3.83% rent growth · sell at horizon
- IRR
- -8.8%
- Equity multiple
- 0.67×
- Total profit
- $-19,585
- Equity at exit
- $32,057
- IRR
- 1.7%
- Equity multiple
- 1.12×
- Total profit
- $7,518
- Equity at exit
- $18,589
Cash invested: $60,200 (down + closing). Projections, not guarantees.
Landlord ↔ Tenant lean methodology
- Overall (STATE)
- 90 Strongly Landlord-Friendly
- State Louisiana
- 90 Strongly Landlord-Friendly · R+12
- County
- — inherits STATE
- City
- — inherits STATE
ZIP-level market 70726
- Rents YoY
- 3.8%
- Active inventory
- 976
- Price-to-rent
- 8.7×
Monthly cashflow live
- Estimated rent
- $2,050 medium interval (Pro) →
- Mortgage (P&I)
- −$1,127
- Tax from tax record
- −$190 /mo · $2,274/yr
- Insurance
- −$90
- HOA
- −$0
- Vacancy / Maint / Mgmt
- −$430
- Net cashflow
- $213
Break-even live
Sensitivity live
| Price | -10% $334 | -5% $274 | +0% $213 | +5% $152 | +10% $91 |
|---|---|---|---|---|---|
| Rent | -10% $51 | -5% $132 | +0% $213 | +5% $294 | +10% $375 |
| Rate | -1.0pp $321 | -0.5pp $267 | base $213 | +0.5pp $157 | +1.0pp $100 |
UW: 25.0% down · 7.5% · 30yr · 1.5% tax · 5.0% vac · 8.0% maint · 8.0% mgmt
Financing live
Cash to close
- Down payment
- $53,750
- Closing costs
- $6,450
- Reserves months
- —
- Total cash needed
- —
Loan-product check · same deal, 3 products live
Conventional
25% down · 7.5% · 30yr
- Down + closing
- —
- Monthly P&I
- —
- Monthly cashflow
- —
- DSCR
- —
- Eligible?
- —
Personal DTI + credit; lowest rate.
DSCR
20% down · 8.5% · 30yr
- Down + closing
- —
- Monthly P&I
- —
- Monthly cashflow
- —
- DSCR
- —
- Eligible?
- —
No personal income docs; deal must DSCR.
Hard money
10% down · 12.0% · 12mo
- Down + closing
- —
- Monthly P&I
- —
- Monthly cashflow
- —
- DSCR
- —
- Eligible?
- —
Short-term bridge; refi at stabilization.
Rent comps 2 comps
| Address | Beds | Baths | Sqft | Rent | $/sqft | DOM | Units | Dist |
|---|---|---|---|---|---|---|---|---|
| 12856 Silverbell Ave Denham Springs, LA | 4.0 | 2.0 | 1829 | $2,400 | $1.31 | 45d | 1 | 1.05mi |
| 12850 Silverbell Ave Denham Springs, LA | 3.0 | 2.0 | 1606 | $2,200 | $1.37 | 24d | 1 | 1.06mi |
Listing history 4 events
-
2026-06-18days on market $215,000 Active 3 DOM
-
2026-06-17days on market $215,000 Active 2 DOM
-
2026-06-15remarks 269-char remark
Show marketing remark (269 chars)
Welcome to Woodland Crossing, only minutes from interstate and all Walker and Denham Springs has to offer. This home offers calming lake views great for relaxing evenings and mornings. Priced below appraised value this home brings instant equity. Vacant as easy to show
-
2026-06-15$215,000 Active 1 DOM
Show marketing remark (269 chars)
Welcome to Woodland Crossing, only minutes from interstate and all Walker and Denham Springs has to offer. This home offers calming lake views great for relaxing evenings and mornings. Priced below appraised value this home brings instant equity. Vacant as easy to show
ⓘ Source: listings_history table (triggers on properties + properties_extension) + one-shot
backfill from property_details.listing_events for pre-trigger history.
Tax reassessment forecast LA · Resets to sale price
- Current annual tax
- $2,274 · $190/mo
- Projected year-2 tax
- $2,274 · $190/mo
- Expected delta
- $0/yr ($0/mo · 0.0%)
ⓘ Screening estimate from a state-policy table — verify with the county assessor before closing.
Climate risk First Street
- Flood 1/10 Low FEMA zone X (unshaded) · 0% chance over 30 yrs
- Wildfire 4/10 Moderate
- Heat 8/10 Severe 7 d/yr ≥108°F today · 22 d/yr by 30 yrs out
- Wind 9/10 Extreme 99% chance of damaging wind over 30 yrs
- Air quality 3/10 Moderate 2 unhealthy d/yr today · 3 by 30 yrs out
Nearby sold comps map
Loading sold comps map…
Walkable amenities ~0.75 mi
Loading nearby amenities…
Taxation est. · year 1
- Rental income
- $24,597
- − Mortgage interest
- −$12,043
- − Property taxes
- −$2,274
- − Insurance
- −$1,075
- − Repairs & maintenance
- −$1,968
- − Management
- −$1,968
- − Depreciation
- −$6,255
- Taxable loss
- −$986
- Est. tax savings @ 24.0%
- +$237
- After-tax cash flow
- $2,789/yr
For passive investors: Depreciation is non-cash, so a rental often shows a tax loss while cash-flowing — sheltering income. Rental losses are passive: they offset passive income freely, and up to $25,000/yr can offset ordinary (W-2) income if you actively participate and your MAGI is under $100k (phasing out to $0 by $150k); unused losses carry forward. On sale, claimed depreciation is recaptured at up to 25%, and gains may owe capital-gains tax (a 1031 exchange can defer both). Figures are a year-1 estimate at your 24.0% rate — not tax advice; consult a CPA.
Schools (NCES district)
- District
- Livingston Parish
- NCES district ID
- 2201020
- Math proficiency
- 40% ▼ -38.00%
- Reading proficiency
- 52% ▼ -32.00%
- Median HH income
- $56,755
- Composite
- 40.07/100
- National rank
- #3811
- State rank
- #13 of 98 in LA
Livability — Walker
- Score
- 75/100
- State rank
- #19
- US rank
- #3999
Category grades
Schools grade is shown separately in the Schools card above.
Census & demographics
- County
- Livingston Parish · 87,496 people
- City population
- 23,921
- Metro
- Baton Rouge, LA
- Population (ZIP)
- 63,575
- Household income
- $78,621
- Rent vs Own
- Severe rent burden
- 1211.0
Population outlook (Livingston County) Hauer SSP2
- Today (2025)
- 158,511 people
- By 2030
- 168,241 · +6.1%
- By 2040
- 186,252 · +17.5%
- By 2050
- 201,516 · +27.1%
- By 2075
- 231,217 · +45.9%
- By 2100
- 241,697 · +52.5%
Race, ethnicity, and origin ACS 2023
- Neighborhood character
- Predominantly White (74%)
- Race & ethnicity
- White 74% Black 13% Hispanic / Latino 9% Two or more races 6%
- Hispanic origin (detail)
- Mexican 3%
- Common ancestry
- Lithuanian 9% Serbian 1% Italian 1%
- Foreign-born
- 6% · Canada
- Languages at home
- 91% English-only · Spanish 6% Other Indo-European 1%
Political lean MEDSL · Livingston
- 2024 margin
- Solid R (+68.5) · D 15.1% · R 83.6% · Other 1.3%
- 2008→2024 swing
- +3.4pp toward D · 2008: -71.9pp · 2024: -68.5pp
- All cycles
- 2024: R+68.5 2020: R+70.0 2016: R+72.5 2012: R+70.4 2008: R+71.9
Not yet ingested
- Civics
- —
Market trends
- HPI YoY
- ▼ -104.37%
- Current HPI
- 170.2207
- Rent YoY
- ▲ 3.83%
- Metro
- Baton Rouge, LA
- State GDP YoY
- ▲ 3.29%
- F500 in state
- 10
Industry mix (Fortune 500 HQ in LA)
| Industry | F500 HQs | Revenue |
|---|---|---|
| Telecommunications | 2 | $23B |
|
||
| Utilities | 1 | $12B |
|
||
| Wholesale / Distribution | 1 | $5B |
|
||
| Advertising | 1 | $2B |
|
||
Price history
+0.0% since first listed3 events — show timeline
- 2026-06-15 Relisted — AcadianaMLS
- 2026-06-15 Listed $215,000 GSREIN
- 2026-06-15 Listed $215,000 AcadianaMLS
Property tax history
+1.6%/yrLatest (2024): $2,274 · +14.1% YoY. Source: county tax records.
Cash-flow waterfall
monthlySold comps — $/sqft
last 12 mo · ≤1 miLoading sold comps…