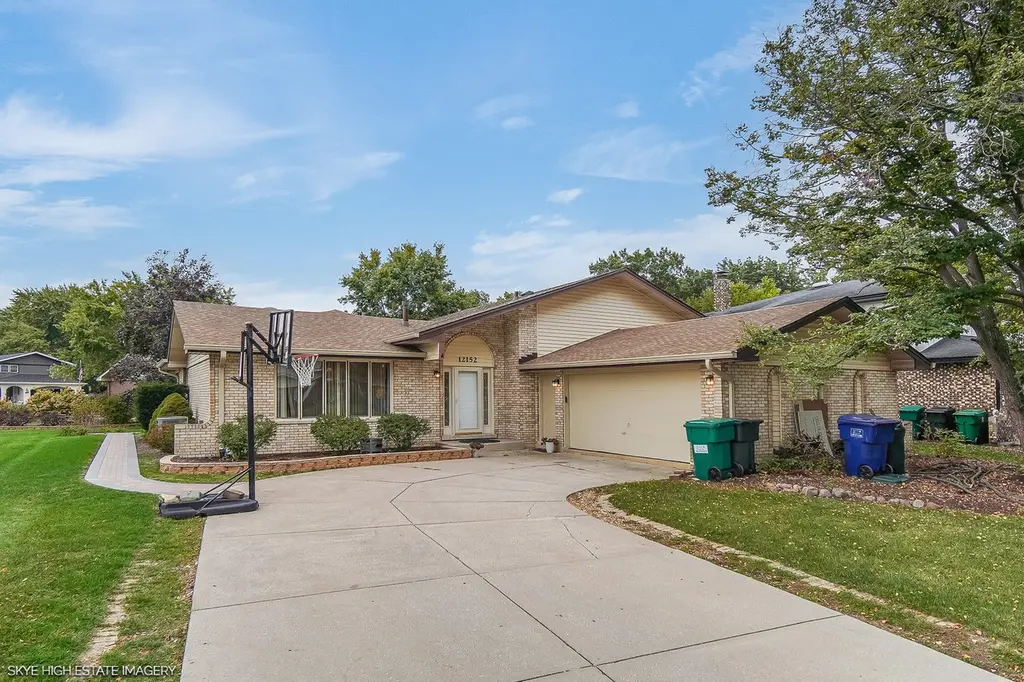
12152 Forestview Dr · Homer Glen, IL
Flood risk 5/10 · Moderate
- FEMA flood zone
- X (unshaded)
- Chance of flooding over 30 yrs
- 0.51%
- Est. flood insurance / yr
- $507 – $1,088
Fire risk 3/10 · Minor
- Est. fire insurance / yr
- $804 – $1,492
Heat risk 3/10 · Minor
- Hot days now (above 102°F)
- 7 days/yr
- Hot days in 30 yrs
- 15 days/yr
Wind risk 2/10 · Minimal
- Chance of severe wind over 30 yrs
- —
Air-quality risk 2/10 · Minimal
- Unhealthy air days now
- 1 days/yr
- Unhealthy air days in 30 yrs
- 1 days/yr
Risk factors via First Street. Map © Google.
Why this score? — see what drove the F grade
The composite is a weighted blend of 9 inputs, each scored 0–100. Each bar is that input's sub-score; the figure is the points it added to the 100-point composite (weight × sub-score).
- Cash flow +4.9/30.0
- Schools +3.4/10.0
- Livability +3.4/5.0
- Rent growth +2.5/5.0
- Condition / age +2.5/5.0
- 1% rule +1.1/10.0
- DSCR +0.0/10.0
- ARV discount +0.0/15.0
- Appreciation +0.0/10.0
$495,000
🖨 Deal sheet 📄 Offer letter ✓ Due diligence
Listing remarks
Beautifully updated 4-bedroom, 3-bath quad-level home featuring an open floor plan and numerous upgrades. The first-floor family room boasts skylights and a cathedral ceiling, opening to a modern kitchen with newer appliances. The living room, dining room, and family room feature brand-new carpeting. Recent improvements include a new roof, kitchen, and brick patio, along with newer siding and fully remodeled bathrooms and basement. Additional updates include an A/C unit (approx. 5 years old), furnace (approx. 10 years old) with a new blower and warranty, and a washer and dryer less than 3 years old. The garage showcases durable epoxy flooring. Situated on a corner lot with a side-entry gara
Key facts
- Open floor plan
- Brick patio
- Cathedral ceiling
Tags
Property features AI
Finance
- Other: Property not currently leased; Possession at closing
- HOA & community: No master association fee required
Exterior
- Parking: Attached garage with concrete driveway; 2 garage spaces (2 total parking spaces)
- Utilities: Water source: Lake Michigan; Public sewer
- Home design: Detached single-family home; Quad-level / split level with sub-basement; Fee simple ownership; Built approximately 41–50 years ago; Home built before 1978; Model: QUAD; School bus service available
- Construction: Brick construction
- Exterior features: Patio; Lake community access
Interior
- Kitchen: Eating area with breakfast bar and island; Range; Microwave; Dishwasher; Refrigerator; Disposal; Stainless steel appliances
- Bedrooms: Master bedroom on second level (15 x 12); Bedroom 2 on second level (15 x 11); Bedroom 3 on second level (12 x 10); Bedroom 4 on lower level (12 x 10)
- Flooring: Carpet in living areas and most bedrooms; Ceramic tile in foyer and kitchen; Vinyl in recreation room and basement laundry
- Bathrooms: Three full bathrooms; Separate shower(s)
- Heating & cooling: Natural gas forced air heating; Central air conditioning
- Interior features: Skylights; Finished partial/sub-basement; 10 total rooms; Wood-burning fireplace with gas starter in family room
- Laundry & utility: Laundry room in basement (25 x 9); Washer; Dryer; Gas dryer hookup; Sump pump
Neighborhood map
What this means for you Summary
Snapshot
- This is a 4-bed/3.0-bath single-family listed at $495k.
Deal economics
- At list price, monthly cash flow is $-1k ($-14k/yr) — negative.
- To cash-flow at today's rent, offer at most $284k (42.7% below list).
- To meet the 1% rule (rent ≥ 1% of price), the offer needs to be $300k (39.4% below list).
- Recommended offer: $284k (42.7% below list) — sets the bar for cash-flow.
- Cap rate 3.4% vs local median 2.4% in Homer Glen — top-decile yield for the area; either an underpriced asset or a hidden risk that comps aren't pricing in. Stress-test before assuming the spread holds.
Location & tenants
- Location reads 68/100 on livability (#449 in IL) — a middle-class / working-renter tenant base. Strengths: crime A+, employment A+, housing A+; Watch: cost of living D, amenities F, commute F.
- Lockport Twp Hsd 205 (suburban): math 35% / reading 38% proficiency, ranked #153 of 620 in IL (top 25%) — families likely to look elsewhere, expect single-tenant / working-renter base with shorter leases.
- Market conditions: 119 active listings in the ZIP; 1 comparable units currently listed for rent nearby; 2,028 units permitted in Will County in 2024 (530 in 5+ unit buildings).
Forward outlook
- Local home prices are declining (-3.0%/yr); year-one equity from $3k of loan paydown is wiped out by about $15k of value loss. Plan a longer hold.
- Will County population projected to shrink 4% by 2050 — rents likely to lag national; underwrite the cash flow, not the appreciation.
Negotiation context
- It's been on market 21 days — a 2% lower offer ($488k) is reasonable based on typical stale-listing flexibility.
- 3 sale attempts since 16y ago with the ask held roughly flat each time — persistent listings suggest the price (not the market) is what's stuck; bring a comps-based counter.
Risks & watch-outs
- Climate carrying-cost: moderate flood risk — expect insurance premiums to compound above CPI over the hold.
Questions for the listing agent
- What do current leases actually rent for vs. the listed asking? Can we see a recent rent roll and the last 12 months of T-12 income?
- Built in 1977 — when were the roof, HVAC, electrical panel, plumbing, and water heater last replaced?
- Is there a deadline driving the sale (1031 exchange, divorce, estate, relocation)? That informs how much negotiation room exists.
- Schools are B-rated — typically a magnet for longer-tenancy family renters. What's the average tenant stay here, and is there a school-zone premium baked into asking?
- The area grade is low — what's the realistic commute time and amenity access for the typical tenant pool here? Any planned neighborhood developments (good or bad) we should know about?
- What's the average days-on-market for RENTAL listings here right now (not sales)? A rising rental-DOM trend means longer vacancies and softer asking-rent achievability than the comps imply.
- What's the recent tenant-quality profile in this submarket — average credit score on applications, eviction rate, late-payment / NSF rate, and stable-employment percentage? A property-management company in the area should have these aggregated.
- How much new for-sale + rental construction is in the pipeline within 1–3 miles? Heavy new supply typically softens prices + rents 12–24 months out; constrained supply supports both.
Investment metrics
- 1% rule
- 0.61% ✗
- Cap rate
- 3.39%
- Cash-on-cash
- -10.36%
- DSCR
- 0.54
- GRM
- 13.8
CMA / ARV
- ARV (on-the-fly)
- $378,768
- Comps found
- 12
Show comp detail 12 sales within ~0.75 mi
| Address | Dist | Beds/Ba | Sqft | Sold | Price | $/sf | Match |
|---|---|---|---|---|---|---|---|
| 12316 Forestview Dr | 0.24mi | 4/3.0 | 2,000 (+10%) | 6mo | $380,000 | $190 | 67 |
| 13622 Murvey Ct | 0.04mi | 3/2.0 (-1) | 1,966 (+8%) | 10mo | $380,000 | $193 | 67 |
| 13740 Venetian Ct | 0.21mi | 3/2.0 (-1) | 1,900 (+4%) | 12mo | $400,000 | $211 | 64 |
| 13766 Mccabe Dr | 0.51mi | 3/2.5 (-1) | 1,854 (+2%) | 7mo | $444,400 | $240 | 60 |
| 11739 Kristoffer Ln | 0.52mi | 3/2.5 (-1) | 1,895 (+4%) | 8mo | $481,500 | $254 | 55 |
| 13810 Logan Dr | 0.70mi | 3/2.5 (-1) | 1,833 (+1%) | 7mo | $435,000 | $237 | 54 |
| 14010 Hialeah Ct | 0.50mi | 3/2.5 (-1) | 2,031 (+12%) | 1mo | $384,000 | $189 | 50 |
| 12305 Derby Ln | 0.53mi | 3/2.0 (-1) | 1,987 (+9%) | 14mo | $335,000 | $169 | 40 |
| 12032 Lancaster Ct | 0.64mi | 3/3.0 (-1) | 1,917 (+5%) | 22mo | $395,000 | $206 | 38 |
| 14106 Chestnut Ln | 0.63mi | 3/3.0 (-1) | 2,047 (+12%) | 10mo | $425,000 | $208 | 37 |
| 12310 Partridge Ln | 0.63mi | 3/3.0 (-1) | 1,645 (-10%) | 16mo | $335,000 | $204 | 36 |
| 13800 Logan Dr | 0.69mi | 3/2.5 (-1) | 1,923 (+6%) | 22mo | $450,000 | $234 | 34 |
Match score weights: distance 35% · size 25% · config 20% · recency 20%. Top-matched comps best support the ARV.
Projected returns pro-forma
-3.0% appreciation · 3.0% rent growth · sell at horizon
- IRR
- -35.0%
- Equity multiple
- -0.13×
- Total profit
- $-156,298
- Equity at exit
- $73,806
- IRR
- -45.6%
- Equity multiple
- -0.69×
- Total profit
- $-233,701
- Equity at exit
- $42,799
Cash invested: $138,600 (down + closing). Projections, not guarantees.
Landlord ↔ Tenant lean methodology
- Overall (STATE)
- 43 Moderately Tenant-Leaning
- State Illinois
- 43 Moderately Tenant-Leaning · D+7
- County
- — inherits STATE
- City
- — inherits STATE
ZIP-level market 60467
- Home prices YoY
- -30.4%
- Active inventory
- 119
- Price-to-rent
- 13.8×
Monthly cashflow live
- Estimated rent
- $3,000 medium interval (Pro) →
- Mortgage (P&I)
- −$2,596
- Tax from tax record
- −$765 /mo · $9,176/yr
- Insurance
- −$206
- HOA
- −$0
- Vacancy / Maint / Mgmt
- −$630
- Net cashflow
- $-1,197
Break-even live
UW: 25.0% down · 7.5% · 30yr · 1.5% tax · 5.0% vac · 8.0% maint · 8.0% mgmt
Financing live
Cash to close
- Down payment
- $123,750
- Closing costs
- $14,850
- Reserves months
- —
- Total cash needed
- —
Loan-product check · same deal, 3 products live
Conventional
25% down · 7.5% · 30yr
- Down + closing
- —
- Monthly P&I
- —
- Monthly cashflow
- —
- DSCR
- —
- Eligible?
- —
Personal DTI + credit; lowest rate.
DSCR
20% down · 8.5% · 30yr
- Down + closing
- —
- Monthly P&I
- —
- Monthly cashflow
- —
- DSCR
- —
- Eligible?
- —
No personal income docs; deal must DSCR.
Hard money
10% down · 12.0% · 12mo
- Down + closing
- —
- Monthly P&I
- —
- Monthly cashflow
- —
- DSCR
- —
- Eligible?
- —
Short-term bridge; refi at stabilization.
Rent comps 1 comps
| Address | Beds | Baths | Sqft | Rent | $/sqft | DOM | Units | Dist |
|---|---|---|---|---|---|---|---|---|
| 14310 Mallard Dr Homer Glen, IL | 4.0 | 3.0 | 1610 | $3,000 | $1.86 | 16d | 1 | 0.90mi |
Listing history 20 events
-
2026-06-18days on market $495,000 Active 21 DOM
-
2026-06-17days on market $495,000 Active 20 DOM
-
2026-06-16days on market $495,000 Active 19 DOM
-
2026-06-15days on market $495,000 Active 18 DOM
-
2026-06-13days on market $495,000 Active 16 DOM
-
2026-06-09days on market $495,000 Active 12 DOM
-
2026-06-08days on market $495,000 Active 11 DOM
-
2026-06-07days on market $495,000 Active 10 DOM
-
2026-06-04days on market $495,000 Active 7 DOM
-
2026-06-03days on market $495,000 Active 6 DOM
-
2026-06-02days on market $495,000 Active 5 DOM
-
2026-06-01days on market $495,000 Active 4 DOM
-
2026-05-31days on market $495,000 Active 3 DOM
-
2026-05-28$495,000 Active
-
2026-04-26historical
-
2025-11-05price
-
2025-10-19Active
-
2011-01-01historical
-
2010-11-24price Price Change
-
2010-05-02New
ⓘ Source: listings_history table (triggers on properties + properties_extension) + one-shot
backfill from property_details.listing_events for pre-trigger history.
Tax reassessment forecast IL · Partial reset (capped growth)
- Current annual tax
- $9,176 · $765/mo
- Projected year-2 tax
- $10,206 · $851/mo
- Expected delta
- +$1,030/yr (+$86/mo · 11.2%)
ⓘ Screening estimate from a state-policy table — verify with the county assessor before closing.
Climate risk First Street
- Flood 5/10 Major FEMA zone X (unshaded) · 51% chance over 30 yrs
- Wildfire 3/10 Moderate
- Heat 3/10 Moderate 7 d/yr ≥102°F today · 15 d/yr by 30 yrs out
- Wind 2/10 Low
- Air quality 2/10 Low 1 unhealthy d/yr today · 1 by 30 yrs out
Nearby sold comps map
Loading sold comps map…
Walkable amenities ~0.75 mi
Loading nearby amenities…
Taxation est. · year 1
- Rental income
- $36,000
- − Mortgage interest
- −$27,728
- − Property taxes
- −$9,176
- − Insurance
- −$2,475
- − Repairs & maintenance
- −$2,880
- − Management
- −$2,880
- − Depreciation
- −$14,400
- Taxable loss
- −$23,539
- Est. tax savings @ 24.0%
- +$5,649
- After-tax cash flow
- $-8,712/yr
For passive investors: Depreciation is non-cash, so a rental often shows a tax loss while cash-flowing — sheltering income. Rental losses are passive: they offset passive income freely, and up to $25,000/yr can offset ordinary (W-2) income if you actively participate and your MAGI is under $100k (phasing out to $0 by $150k); unused losses carry forward. On sale, claimed depreciation is recaptured at up to 25%, and gains may owe capital-gains tax (a 1031 exchange can defer both). Figures are a year-1 estimate at your 24.0% rate — not tax advice; consult a CPA.
Schools (NCES district)
- District
- Lockport Twp Hsd 205
- NCES district ID
- 1723350
- Math proficiency
- 35% ▼ -5.00%
- Reading proficiency
- 38% ▼ -4.00%
- Median HH income
- $69,994
- Composite
- 33.5/100
- National rank
- #5440
- State rank
- #153 of 620 in IL
Livability — Homer Glen
- Score
- 68/100
- State rank
- #449
- US rank
- #9274
Category grades
Schools grade is shown separately in the Schools card above.
Census & demographics
- Census place
- Homer Glen, IL
- City population
- 22,585
- Population (ZIP)
- 24,952
Population outlook (Will County) Hauer SSP2
- Today (2025)
- 705,368 people
- By 2030
- 708,154 · +0.4%
- By 2040
- 702,692 · -0.4%
- By 2050
- 680,249 · -3.6%
- By 2075
- 611,990 · -13.2%
- By 2100
- 516,215 · -26.8%
Race, ethnicity, and origin ACS 2023
- Neighborhood character
- Predominantly White (83%)
- Race & ethnicity
- White 83% Hispanic / Latino 6% Asian 5% Two or more races 4% Black 4%
- Hispanic origin (detail)
- Mexican 5%
- Common ancestry
- Romanian 15% Armenian 2% Iranian 2%
- Foreign-born
- 14% · Canada, South Korea, China
- Languages at home
- 78% English-only · Arabic 9% Russian/Polish/Slavic 4% Other Indo-European 4%
Political lean MEDSL · Will
- 2024 margin
- Toss-up / Even · D 50.1% · R 48.5% · Other 1.4%
- 2008→2024 swing
- -11.6pp toward R · 2008: 13.2pp · 2024: 1.6pp
- All cycles
- 2024: D+1.6 2020: D+8.3 2016: D+5.7 2012: D+3.7 2008: D+13.2
Not yet ingested
- Civics
- —
Market trends
- HPI YoY
- ▼ -82.13%
- Current HPI
- 188.3676
- Rent YoY
- —
- Metro
- —
- State GDP YoY
- ▲ 1.59%
- F500 in state
- 60
Industry mix (Fortune 500 HQ in IL)
| Industry | F500 HQs | Revenue |
|---|---|---|
| Insurance | 4 | $201B |
|
||
| Consumer Goods | 4 | $87B |
|
||
| Industrial Machinery | 3 | $64B |
|
||
| Healthcare | 2 | $55B |
|
||
| Retail / Pharmacy | 1 | $148B |
|
||
| Agriculture / Food | 1 | $86B |
|
||
Price history
7 events — show timeline
- 2026-05-28 Listed $495,000 MRED as Distributed by MLS Grid
- 2026-04-26 Listing Removed — MRED as Distributed by MLS Grid
- 2025-11-05 Price Changed — MRED as Distributed by MLS Grid
- 2025-10-19 Listed — MRED as Distributed by MLS Grid
- 2011-01-01 Listing Removed — MRED as Distributed by MLS Grid
- 2010-11-24 Price Changed — MRED as Distributed by MLS Grid
- 2010-05-02 Listed — MRED as Distributed by MLS Grid
Property tax history
+3.0%/yrLatest (2024): $9,176 · +4.2% YoY. Source: county tax records.
Cash-flow waterfall
monthlySold comps — $/sqft
last 12 mo · ≤1 miLoading sold comps…