7090 Merlyn Dethlefsen Rd · Panama City, FL
Flood risk 1/10 · Minimal
- FEMA flood zone
- X (unshaded)
- Chance of flooding over 30 yrs
- 0.0%
- Est. flood insurance / yr
- $507 – $1,088
Fire risk 7/10 · Major
- Est. fire insurance / yr
- $947 – $1,759
Heat risk 9/10 · Severe
- Hot days now (above 104°F)
- 7 days/yr
- Hot days in 30 yrs
- 21 days/yr
Wind risk 9/10 · Severe
- Chance of severe wind over 30 yrs
- 99.0%
Air-quality risk 1/10 · Minimal
- Unhealthy air days now
- 0 days/yr
- Unhealthy air days in 30 yrs
- 0 days/yr
Risk factors via First Street. Map © Google.
Why this score? — see what drove the D- grade
The composite is a weighted blend of 9 inputs, each scored 0–100. Each bar is that input's sub-score; the figure is the points it added to the 100-point composite (weight × sub-score).
- Cash flow +11.3/30.0
- ARV discount +8.1/15.0
- Schools +4.3/10.0
- Livability +3.6/5.0
- 1% rule +3.3/10.0
- DSCR +3.3/10.0
- Rent growth +2.8/5.0
- Condition / age +2.5/5.0
- Appreciation +0.0/10.0
$264,900
🖨 Deal sheet 📄 Offer letter ✓ Due diligence
Listing remarks
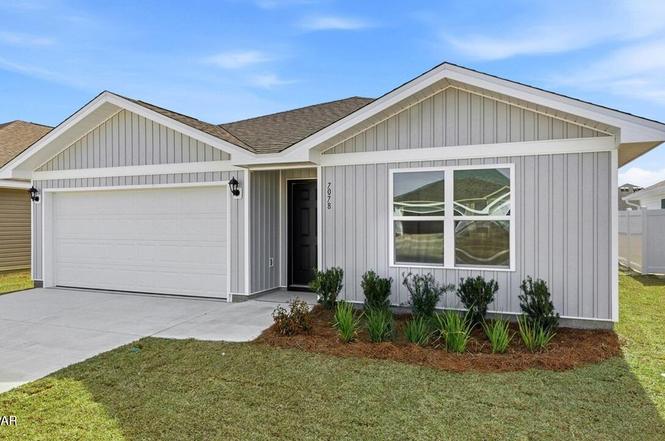
Welcome to the Freeport, a new home floor plan at Liberty in Panama City, Florida. The Freeport is a one-story home with a double garage designed with space for the family in mind and affordability. On the outside of your home, you will see durable vinyl siding, a spacious two-car garage with an opener and a fully sodded yard to the property lines. This home comes equipped with dimensional shingles with a limited lifetime warranty, electronic deadbolts on all exterior doors, weatherproof outlets, and hose bibs. Sidewalks line the neighborhood streets for you to enjoy the beautiful Florida weather at Liberty. As you enter this 4 bedroom, 2 bath home, you will see 1,458 square feet of spaciou
Key facts
- Durable vinyl siding
- Fully sodded yard
- Hose bibs
Tags
Neighborhood map
What this means for you Summary
Snapshot
- This is a 4-bed/2.0-bath single-family listed at $265k.
Deal economics
- At list price, monthly cash flow is $-99 ($-1k/yr) — negative.
- To cash-flow at today's rent, offer at most $251k (5.4% below list).
- To meet the 1% rule (rent ≥ 1% of price), the offer needs to be $219k (17.3% below list).
- Recommended offer: $219k (17.3% below list) — sets the bar for 1% rule.
- Cap rate 5.8% vs local median 4.7% in Panama City — meaningfully above typical; check what's discounted (condition, days-on-market, listing class) to confirm the premium yield is real.
Location & tenants
- Location reads 72/100 on livability (#350 in FL) — a middle-class / working-renter tenant base. Strengths: cost of living A+, housing A+, health & safety A+; Watch: crime F, amenities F, commute F.
- Bay (suburban): math 51% / reading 51% proficiency, ranked #29 of 73 in FL (top 40%) — acceptable for families but not a draw, mixed tenant base, ~2y average lease.
- Market conditions: Rents rising (+1.1%/yr); 969 active listings in the ZIP; 1 comparable units currently listed for rent nearby; 2,473 units permitted in Bay County in 2024 (559 in 5+ unit buildings).
- This rent runs 35% of the median local income ($75k/yr) — at the standard rent-burdened threshold; future hikes will face affordability resistance.
Forward outlook
- Local home prices are declining (-3.0%/yr); year-one equity from $2k of loan paydown is wiped out by about $8k of value loss. Plan a longer hold.
- Bay County population projected at +24% by 2050 — long-run rental-demand tailwind backs the buy-and-hold thesis.
Negotiation context
- It's been on market 115 days — a 9% lower offer ($241k) is reasonable based on typical stale-listing flexibility.
- 2 sale attempts with the ask held roughly flat each time — persistent listings suggest the price (not the market) is what's stuck; bring a comps-based counter.
Risks & watch-outs
- Climate carrying-cost: severe wind risk, 99% chance of damaging wind over 30y; major wildfire risk; extreme-heat days projected 7→21/yr by 2055 (HVAC capex compounding) — expect insurance premiums to compound above CPI over the hold.
Questions for the listing agent
- What do current leases actually rent for vs. the listed asking? Can we see a recent rent roll and the last 12 months of T-12 income?
- It's been on market 115 days. Have you received any prior offers? Is the seller open to a 17% concession, seller financing, or rate buy-down credit?
- Why hasn't it sold? Are there any deal-killer items the seller is aware of (foundation, flood, title, zoning, code violations)?
- Is there a deadline driving the sale (1031 exchange, divorce, estate, relocation)? That informs how much negotiation room exists.
- Schools are B-rated — typically a magnet for longer-tenancy family renters. What's the average tenant stay here, and is there a school-zone premium baked into asking?
- Crime grade is F in this area — have there been break-ins, vandalism, or insurance claims at this property in the last 3 years? What carrier currently insures it and at what premium?
- The area grade is low — what's the realistic commute time and amenity access for the typical tenant pool here? Any planned neighborhood developments (good or bad) we should know about?
- What's the average days-on-market for RENTAL listings here right now (not sales)? A rising rental-DOM trend means longer vacancies and softer asking-rent achievability than the comps imply.
- What's the recent tenant-quality profile in this submarket — average credit score on applications, eviction rate, late-payment / NSF rate, and stable-employment percentage? A property-management company in the area should have these aggregated.
- How much new for-sale + rental construction is in the pipeline within 1–3 miles? Heavy new supply typically softens prices + rents 12–24 months out; constrained supply supports both.
Investment metrics
- 1% rule
- 0.83% ✗
- Cap rate
- 5.84%
- Cash-on-cash
- -1.60%
- DSCR
- 0.93
- GRM
- 10.1
CMA / ARV
- ARV (on-the-fly)
- $268,272
- Comps found
- 12
Show comp detail 12 sales within ~0.75 mi
| Address | Dist | Beds/Ba | Sqft | Sold | Price | $/sf | Match |
|---|---|---|---|---|---|---|---|
| 7067 George Day Ln | 0.06mi | 4/2.0 | 1,458 (0%) | 1mo | $269,900 | $185 | 96 |
| 6913 William Pitsenbarger Rd | 0.10mi | 4/2.0 | 1,458 (0%) | 7mo | $263,900 | $181 | 90 |
| 7062 George Day Ln | 0.23mi | 4/2.0 | 1,458 (0%) | 7mo | $269,900 | $185 | 84 |
| 7090 George Day Ln | 0.21mi | 4/2.0 | 1,458 (0%) | 9mo | $254,900 | $175 | 83 |
| 7086 Merlyn Dethlefsen Rd | 0.01mi | 3/2.0 (-1) | 1,580 (+8%) | 5mo | $290,500 | $184 | 77 |
| 7102 Merlyn Dethlefsen Rd | 0.03mi | 3/2.0 (-1) | 1,580 (+8%) | 6mo | $279,900 | $177 | 75 |
| 7058 Merlyn Dethlefsen Rd | 0.08mi | 3/2.0 (-1) | 1,580 (+8%) | 4mo | $289,900 | $183 | 74 |
| 7039 George Day Ln | 0.13mi | 3/2.0 (-1) | 1,580 (+8%) | 2mo | $299,400 | $189 | 74 |
| 7043 George Day Ln | 0.12mi | 3/2.0 (-1) | 1,580 (+8%) | 3mo | $299,900 | $190 | 73 |
| 7087 George Day Ln | 0.15mi | 3/2.0 (-1) | 1,580 (+8%) | 4mo | $279,900 | $177 | 71 |
| 6909 William Pitsenbarger Rd | 0.21mi | 3/2.0 (-1) | 1,580 (+8%) | 8mo | $264,400 | $167 | 65 |
| 6905 William Pitsenbarger Rd | 0.22mi | 3/2.0 (-1) | 1,272 (-13%) | 7mo | $249,900 | $196 | 58 |
Match score weights: distance 35% · size 25% · config 20% · recency 20%. Top-matched comps best support the ARV.
Projected returns pro-forma
-3.0% appreciation · 1.12% rent growth · sell at horizon
- IRR
- -21.1%
- Equity multiple
- 0.28×
- Total profit
- $-53,277
- Equity at exit
- $39,497
- IRR
- -19.5%
- Equity multiple
- 0.05×
- Total profit
- $-70,471
- Equity at exit
- $22,904
Cash invested: $74,172 (down + closing). Projections, not guarantees.
Landlord ↔ Tenant lean methodology
- Overall (STATE)
- 87 Strongly Landlord-Friendly
- State Florida
- 87 Strongly Landlord-Friendly · R+3
- County
- — inherits STATE
- City
- — inherits STATE
ZIP-level market 32404
- Home prices YoY
- -16.1%
- Rents YoY
- 1.1%
- Active inventory
- 969
- Price-to-rent
- 10.1×
Monthly cashflow live
- Estimated rent
- $2,192 medium interval (Pro) →
- Mortgage (P&I)
- −$1,389
- Tax est. 1.5%
- −$331 /mo · $3,974/yr
- Insurance
- −$110
- HOA
- −$0
- Vacancy / Maint / Mgmt
- −$460
- Net cashflow
- $-99
Break-even live
UW: 25.0% down · 7.5% · 30yr · 1.5% tax · 5.0% vac · 8.0% maint · 8.0% mgmt
Financing live
Cash to close
- Down payment
- $66,225
- Closing costs
- $7,947
- Reserves months
- —
- Total cash needed
- —
Loan-product check · same deal, 3 products live
Conventional
25% down · 7.5% · 30yr
- Down + closing
- —
- Monthly P&I
- —
- Monthly cashflow
- —
- DSCR
- —
- Eligible?
- —
Personal DTI + credit; lowest rate.
DSCR
20% down · 8.5% · 30yr
- Down + closing
- —
- Monthly P&I
- —
- Monthly cashflow
- —
- DSCR
- —
- Eligible?
- —
No personal income docs; deal must DSCR.
Hard money
10% down · 12.0% · 12mo
- Down + closing
- —
- Monthly P&I
- —
- Monthly cashflow
- —
- DSCR
- —
- Eligible?
- —
Short-term bridge; refi at stabilization.
Rent comps 1 comps
| Address | Beds | Baths | Sqft | Rent | $/sqft | DOM | Units | Dist |
|---|---|---|---|---|---|---|---|---|
| 6416 Bellavia Ln Panama City, FL | 4.0 | 2.0 | 1812 | $2,100 | $1.16 | 13d | 1 | 0.83mi |
Listing history 9 events
-
2026-04-18status Pending
-
2026-04-17price $264,900
-
2026-04-14status Active
-
2026-03-01status Pending
-
2026-02-24price $269,900
-
2026-02-24price $284,900
-
2026-01-12price $283,900
-
2025-12-10price $279,900
-
2025-11-10$274,900 Active
ⓘ Source: listings_history table (triggers on properties + properties_extension) + one-shot
backfill from property_details.listing_events for pre-trigger history.
Climate risk First Street
- Flood 1/10 Low FEMA zone X (unshaded) · 0% chance over 30 yrs
- Wildfire 7/10 Severe
- Heat 9/10 Extreme 7 d/yr ≥104°F today · 21 d/yr by 30 yrs out
- Wind 9/10 Extreme 99% chance of damaging wind over 30 yrs
- Air quality 1/10 Low 0 unhealthy d/yr today · 0 by 30 yrs out
Nearby sold comps map
Loading sold comps map…
Walkable amenities ~0.75 mi
Loading nearby amenities…
Taxation est. · year 1
- Rental income
- $26,301
- − Mortgage interest
- −$14,839
- − Property taxes
- −$3,974
- − Insurance
- −$1,324
- − Repairs & maintenance
- −$2,104
- − Management
- −$2,104
- − Depreciation
- −$7,706
- Taxable loss
- −$5,749
- Est. tax savings @ 24.0%
- +$1,380
- After-tax cash flow
- $190/yr
For passive investors: Depreciation is non-cash, so a rental often shows a tax loss while cash-flowing — sheltering income. Rental losses are passive: they offset passive income freely, and up to $25,000/yr can offset ordinary (W-2) income if you actively participate and your MAGI is under $100k (phasing out to $0 by $150k); unused losses carry forward. On sale, claimed depreciation is recaptured at up to 25%, and gains may owe capital-gains tax (a 1031 exchange can defer both). Figures are a year-1 estimate at your 24.0% rate — not tax advice; consult a CPA.
Schools (NCES district)
- District
- Bay
- NCES district ID
- 1200090
- Math proficiency
- 51% ▼ -8.00%
- Reading proficiency
- 51% ▼ -7.00%
- Median HH income
- $47,740
- Composite
- 43.41/100
- National rank
- #3014
- State rank
- #29 of 73 in FL
Livability — Panama City
- Score
- 72/100
- State rank
- #350
- US rank
- #5823
Category grades
Schools grade is shown separately in the Schools card above.
Census & demographics
- Census place
- Panama City, FL
- County
- Bay County · 163,593 people
- City population
- 91,445
- Metro
- Panama City, FL
- Population (ZIP)
- 42,514
- Household income
- $74,708
- Rent vs Own
- Severe rent burden
- 1218.0
Population outlook (Bay County) Hauer SSP2
- Today (2025)
- 206,264 people
- By 2030
- 217,740 · +5.6%
- By 2040
- 238,738 · +15.7%
- By 2050
- 255,545 · +23.9%
- By 2075
- 288,295 · +39.8%
- By 2100
- 288,638 · +39.9%
Race, ethnicity, and origin ACS 2023
- Neighborhood character
- Predominantly White (69%)
- Race & ethnicity
- White 69% Black 12% Two or more races 10% Hispanic / Latino 9% Asian 3%
- Hispanic origin (detail)
- Mexican 2% Puerto Rican 3%
- Common ancestry
- Lithuanian 3% Slovak 2% Italian 2%
- Foreign-born
- 7% · Canada, Vietnam, Mexico
- Languages at home
- 90% English-only · Spanish 6% Vietnamese 1% Other Asian/Pacific 1%
Political lean MEDSL · Bay
- 2024 margin
- Solid R (+47.4) · D 25.8% · R 73.1% · Other 1.1%
- 2008→2024 swing
- -6.6pp toward R · 2008: -40.7pp · 2024: -47.4pp
- All cycles
- 2024: R+47.4 2020: R+43.5 2016: R+46.3 2012: R+43.6 2008: R+40.7
Not yet ingested
- Civics
- —
Market trends
- HPI YoY
- ▼ -50.59%
- Current HPI
- 263.7178
- Rent YoY
- ▲ 1.12%
- Metro
- Panama City, FL
- State GDP YoY
- ▲ 3.28%
- F500 in state
- 36
Industry mix (Fortune 500 HQ in FL)
| Industry | F500 HQs | Revenue |
|---|---|---|
| Industrial Technology | 2 | $29B |
|
||
| Insurance | 2 | $17B |
|
||
| Retail | 1 | $60B |
|
||
| Technology Distribution | 1 | $58B |
|
||
| Homebuilding | 1 | $35B |
|
||
| Technology Manufacturing | 1 | $35B |
|
||
Price history
-3.6% since first listed9 events — show timeline
- 2026-04-18 Pending — CPARMLS
- 2026-04-17 Price Changed $264,900 CPARMLS
- 2026-04-14 Relisted — CPARMLS
- 2026-03-01 Pending — CPARMLS
- 2026-02-24 Price Changed $269,900 CPARMLS
- 2026-02-24 Price Changed $284,900 CPARMLS
- 2026-01-12 Price Changed $283,900 CPARMLS
- 2025-12-10 Price Changed $279,900 CPARMLS
- 2025-11-10 Listed $274,900 CPARMLS
Cash-flow waterfall
monthlySold comps — $/sqft
last 12 mo · ≤1 miLoading sold comps…