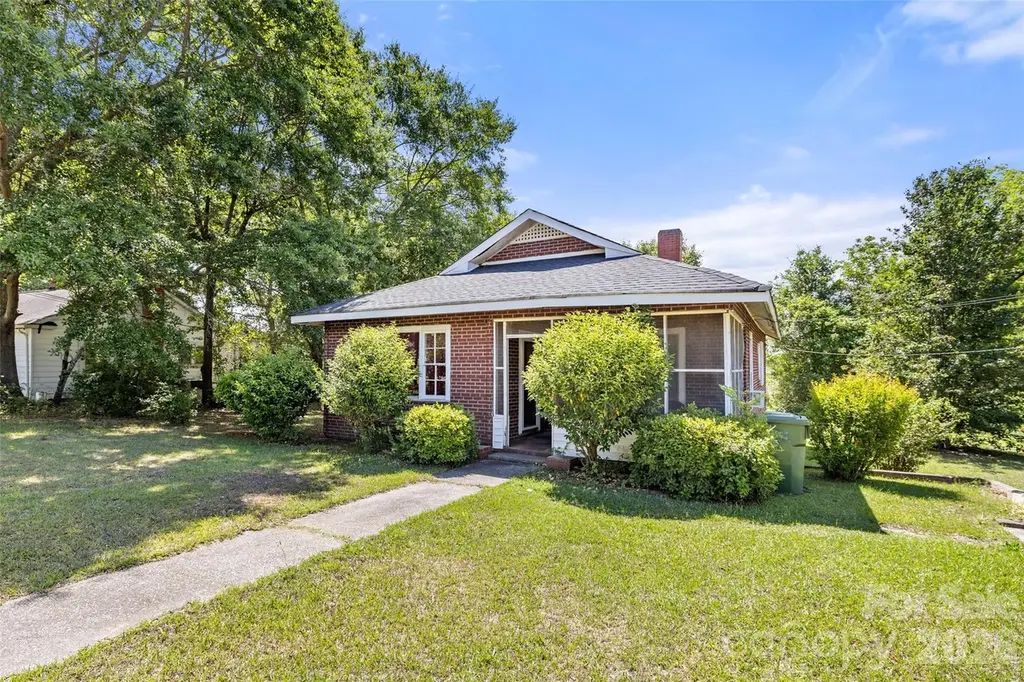
519 Central Ave · Lancaster, SC
Flood risk 1/10 · Minimal
- FEMA flood zone
- X (unshaded)
- Chance of flooding over 30 yrs
- 0.0%
- Est. flood insurance / yr
- $507 – $1,088
Fire risk 3/10 · Minor
- Est. fire insurance / yr
- $783 – $1,453
Heat risk 6/10 · Moderate
- Hot days now (above 106°F)
- 7 days/yr
- Hot days in 30 yrs
- 16 days/yr
Wind risk 6/10 · Moderate
- Chance of severe wind over 30 yrs
- 47.0%
Air-quality risk 2/10 · Minimal
- Unhealthy air days now
- 2 days/yr
- Unhealthy air days in 30 yrs
- 2 days/yr
Risk factors via First Street. Map © Google.
Why this score? — see what drove the C- grade
The composite is a weighted blend of 9 inputs, each scored 0–100. Each bar is that input's sub-score; the figure is the points it added to the 100-point composite (weight × sub-score).
- Cash flow +23.3/30.0
- DSCR +7.5/10.0
- ARV discount +6.8/15.0
- 1% rule +5.7/10.0
- Schools +3.7/10.0
- Livability +2.8/5.0
- Rent growth +2.5/5.0
- Condition / age +2.5/5.0
- Appreciation +0.0/10.0
$125,000
🖨 Deal sheet 📄 Offer letter ✓ Due diligence
Listing remarks MLS
Great investment property. Tennant pays month to month and has paid 5 months in advance for rent through October. Close proximity to MUSC and right down the street from uptown Lancaster.
Key facts
- Added privacy
- Community amenities
- Spacious lot
Tags
Property features AI
Finance
- HOA & community: No HOA
Exterior
- Parking: Driveway; No garage
- Utilities: City water; Public sewer
- Home design: Single-family residence; One story; Site-built construction; City zoning
- Construction: Asbestos exterior material; Crawl space foundation
- Exterior features: Porch
Interior
- Kitchen: Electric Range
- Bedrooms: 3 bedrooms on the main level
- Flooring: Carpet; Vinyl
- Bathrooms: 2 full bathrooms on the main level
- Heating & cooling: Forced air heating; Central air conditioning
- Interior features: 5 total rooms; Primary-bedroom fireplace
- Laundry & utility: Mud room laundry area
Neighborhood map
What this means for you Summary
Snapshot
- This is a 3-bed/1.0-bath single-family listed at $125k.
Deal economics
- At list price, monthly cash flow is $229 ($3k/yr) — positive.
- The deal already cash-flows at list — no discount required.
- Meets the 1% rule at list price ($1k rent vs $125k).
- Recommended offer: $121k (3.0% below list) — sets the bar for market timing.
- Cap rate 8.5% vs local median 3.0% in Lancaster — top-decile yield for the area; either an underpriced asset or a hidden risk that comps aren't pricing in. Stress-test before assuming the spread holds.
Location & tenants
- Location reads 55/100 on livability (#301 in SC) — a working-class tenant base; expect higher turnover. Strengths: cost of living A+, housing B+; Watch: schools C-, crime F, amenities F.
- Lancaster 01 (rural): math 41% / reading 47% proficiency, ranked #26 of 80 in SC (top 32%) — families likely to look elsewhere, expect single-tenant / working-renter base with shorter leases.
- Market conditions: 675 active listings in the ZIP; 9 comparable units currently listed for rent nearby; rentals at typical pace (median 16d on market — plan ~3-4 weeks tenant-placement turnaround); 976 units permitted in Lancaster County in 2024 (0 in 5+ unit buildings).
Forward outlook
- Local home prices are declining (-3.0%/yr); year-one equity from $864 of loan paydown is wiped out by about $4k of value loss. Plan a longer hold.
- Lancaster County population projected at +40% by 2050 — long-run rental-demand tailwind backs the buy-and-hold thesis.
Negotiation context
- It's been on market 38 days — a 3% lower offer ($121k) is reasonable based on typical stale-listing flexibility.
- 2 sale attempts since 3y ago; this cycle's ask has dropped $25k (17%) from the opening price — seller is motivated, your offer sets the floor, not the list.
- Current owner paid $60k; list at $125k implies a 108% gain — meaningful room to come down on a strong offer.
Risks & watch-outs
- Watch-outs: built in 1940 — expect roof / HVAC / electrical / plumbing capex.
- Climate carrying-cost: major wind risk, 47% chance of damaging wind over 30y; extreme-heat days projected 7→16/yr by 2055 (HVAC capex compounding) — expect insurance premiums to compound above CPI over the hold.
Questions for the listing agent
- It's been on market 38 days. Have you received any prior offers? Is the seller open to a 3% concession, seller financing, or rate buy-down credit?
- Built in 1940 — when were the roof, HVAC, electrical panel, plumbing, and water heater last replaced?
- Is there a deadline driving the sale (1031 exchange, divorce, estate, relocation)? That informs how much negotiation room exists.
- Crime grade is F in this area — have there been break-ins, vandalism, or insurance claims at this property in the last 3 years? What carrier currently insures it and at what premium?
- What's the average days-on-market for RENTAL listings here right now (not sales)? A rising rental-DOM trend means longer vacancies and softer asking-rent achievability than the comps imply.
- What's the recent tenant-quality profile in this submarket — average credit score on applications, eviction rate, late-payment / NSF rate, and stable-employment percentage? A property-management company in the area should have these aggregated.
- How much new for-sale + rental construction is in the pipeline within 1–3 miles? Heavy new supply typically softens prices + rents 12–24 months out; constrained supply supports both.
Investment metrics
- 1% rule
- 1.07% ✓
- Cap rate
- 8.49%
- Cash-on-cash
- 7.84%
- DSCR
- 1.35
- GRM
- 7.8
CMA / ARV
- ARV (on-the-fly)
- $123,000
- Comps found
- 7
Show comp detail 7 sales within ~0.75 mi
| Address | Dist | Beds/Ba | Sqft | Sold | Price | $/sf | Match |
|---|---|---|---|---|---|---|---|
| 126 S Jackson Rd | 0.11mi | 2/1.0 (-1) | 800 (-2%) | 4mo | $120,000 | $150 | 82 |
| 1141 6th St | 0.16mi | 2/1.0 (-1) | 811 (-1%) | 18mo | $85,000 | $105 | 71 |
| 521 Central Ave | 0.02mi | 2/1.0 (-1) | 764 (-7%) | 24mo | $169,000 | $221 | 63 |
| 1127 6th St | 0.18mi | 3/2.0 | 910 (+11%) | 21mo | $185,000 | $203 | 52 |
| 944 15th St | 0.54mi | 3/2.0 | 878 (+7%) | 15mo | $169,999 | $194 | 46 |
| 813 N Woodland Dr | 0.59mi | 2/1.0 (-1) | 875 (+7%) | 24mo | $85,000 | $97 | 37 |
| 1010 13th St #11 | 0.69mi | 2/1.0 (-1) | 932 (+14%) | 13mo | $67,500 | $72 | 29 |
Match score weights: distance 35% · size 25% · config 20% · recency 20%. Top-matched comps best support the ARV.
Projected returns pro-forma
-3.0% appreciation · 3.0% rent growth · sell at horizon
- IRR
- -4.4%
- Equity multiple
- 0.84×
- Total profit
- $-5,696
- Equity at exit
- $18,638
- IRR
- 5.3%
- Equity multiple
- 1.39×
- Total profit
- $13,788
- Equity at exit
- $10,808
Cash invested: $35,000 (down + closing). Projections, not guarantees.
Landlord ↔ Tenant lean methodology
- Overall (STATE)
- 90 Strongly Landlord-Friendly
- State South Carolina
- 90 Strongly Landlord-Friendly · R+6
- County
- — inherits STATE
- City
- — inherits STATE
ZIP-level market 29720
- Home prices YoY
- -28.2%
- Active inventory
- 675
- Price-to-rent
- 7.8×
Monthly cashflow live
- Estimated rent
- $1,341 high interval (Pro) →
- Mortgage (P&I)
- −$656
- Tax from tax record
- −$124 /mo · $1,483/yr
- Insurance
- −$52
- HOA
- −$0
- Vacancy / Maint / Mgmt
- −$282
- Net cashflow
- $229
Break-even live
UW: 25.0% down · 7.5% · 30yr · 1.5% tax · 5.0% vac · 8.0% maint · 8.0% mgmt
Financing live
Cash to close
- Down payment
- $31,250
- Closing costs
- $3,750
- Reserves months
- —
- Total cash needed
- —
Loan-product check · same deal, 3 products live
Conventional
25% down · 7.5% · 30yr
- Down + closing
- —
- Monthly P&I
- —
- Monthly cashflow
- —
- DSCR
- —
- Eligible?
- —
Personal DTI + credit; lowest rate.
DSCR
20% down · 8.5% · 30yr
- Down + closing
- —
- Monthly P&I
- —
- Monthly cashflow
- —
- DSCR
- —
- Eligible?
- —
No personal income docs; deal must DSCR.
Hard money
10% down · 12.0% · 12mo
- Down + closing
- —
- Monthly P&I
- —
- Monthly cashflow
- —
- DSCR
- —
- Eligible?
- —
Short-term bridge; refi at stabilization.
Rent comps 9 comps
| Address | Beds | Baths | Sqft | Rent | $/sqft | DOM | Units | Dist |
|---|---|---|---|---|---|---|---|---|
| 205 S Catawba St Lancaster, SC | 2.0 | 1.0 | 950 | $1,350 | $1.42 | 1d | 1 | 0.60mi |
| 409 Plantation Rd Unit B Lancaster, SC | 2.0 | 1.0 | 800 | $900 | $1.12 | 16d | 1 | 1.01mi |
| 1045 W Meadow Dr Unit F Lancaster, SC | 2.0 | 1.0 | 800 | $900 | $1.12 | 23d | 1 | 1.01mi |
| 417 Plantation Rd Unit C Lancaster, SC | 2.0 | 1.0 | 800 | $900 | $1.12 | 23d | 1 | 1.02mi |
| 730 Taylor St Lancaster, SC | 2.0 | 1.0 | 868 | $985 | $1.13 | 1d | 1 | 1.05mi |
| 732 Taylor St Lancaster, SC | 2.0 | 1.0 | 868 | $985 | $1.13 | 1d | 1 | 1.06mi |
| 3038 Miller St Unit 3016-A Lancaster, SC | 2.0 | 2.0 | 915 | $1,363 | $1.49 | 17d | 1 | 1.10mi |
| 1340 Wade St Lancaster, SC | 2.0 | 1.0 | 964 | $1,350 | $1.40 | 3d | 1 | 1.28mi |
| 1727 Summit Ave Lancaster, SC | 2.0 | 1.0 | 720 | $1,200 | $1.67 | 23d | 1 | 1.34mi |
Listing history 18 events
-
2026-06-18days on market $125,000 Active 38 DOM
-
2026-06-17days on market $125,000 Active 37 DOM
-
2026-06-16days on market $125,000 Active 36 DOM
-
2026-06-15pricedays on market $125,000 Active 35 DOM
-
2026-06-13days on market $150,000 Active 33 DOM
-
2026-06-09days on market $150,000 Active 29 DOM
-
2026-06-08days on market $150,000 Active 28 DOM
-
2026-06-07days on market $150,000 Active 27 DOM
-
2026-06-04days on market $150,000 Active 24 DOM
-
2026-06-03days on market $150,000 Active 23 DOM
-
2026-06-02days on market $150,000 Active 22 DOM
-
2026-06-01days on market $150,000 Active 21 DOM
-
2026-05-31days on market $150,000 Active 20 DOM
-
2026-05-12$150,000 Active
-
2023-08-09soldstatus $60,000 Closed 186-char remark
Show marketing remark (186 chars)
Great investment property. Tennant pays month to month and has paid 5 months in advance for rent through October. Close proximity to MUSC and right down the street from uptown Lancaster.
-
2023-07-18status Pending 186-char remark
Show marketing remark (186 chars)
Great investment property. Tennant pays month to month and has paid 5 months in advance for rent through October. Close proximity to MUSC and right down the street from uptown Lancaster.
-
2023-07-13$30,000 Active 186-char remark
Show marketing remark (186 chars)
Great investment property. Tennant pays month to month and has paid 5 months in advance for rent through October. Close proximity to MUSC and right down the street from uptown Lancaster.
-
2004-02-13soldstatus $15,000
ⓘ Source: listings_history table (triggers on properties + properties_extension) + one-shot
backfill from property_details.listing_events for pre-trigger history.
Tax reassessment forecast SC · Resets to sale price
- Current annual tax
- $1,483 · $124/mo
- Projected year-2 tax
- $1,483 · $124/mo
- Expected delta
- $0/yr ($0/mo · 0.0%)
ⓘ Screening estimate from a state-policy table — verify with the county assessor before closing.
Climate risk First Street
- Flood 1/10 Low FEMA zone X (unshaded) · 0% chance over 30 yrs
- Wildfire 3/10 Moderate
- Heat 6/10 Major 7 d/yr ≥106°F today · 16 d/yr by 30 yrs out
- Wind 6/10 Major 47% chance of damaging wind over 30 yrs
- Air quality 2/10 Low 2 unhealthy d/yr today · 2 by 30 yrs out
Nearby sold comps map
Loading sold comps map…
Walkable amenities ~0.75 mi
Loading nearby amenities…
Taxation est. · year 1
- Rental income
- $16,098
- − Mortgage interest
- −$7,002
- − Property taxes
- −$1,483
- − Insurance
- −$625
- − Repairs & maintenance
- −$1,288
- − Management
- −$1,288
- − Depreciation
- −$3,636
- Taxable income
- $776
- Est. tax owed @ 24.0%
- −$186
- After-tax cash flow
- $2,557/yr
For passive investors: Depreciation is non-cash, so a rental often shows a tax loss while cash-flowing — sheltering income. Rental losses are passive: they offset passive income freely, and up to $25,000/yr can offset ordinary (W-2) income if you actively participate and your MAGI is under $100k (phasing out to $0 by $150k); unused losses carry forward. On sale, claimed depreciation is recaptured at up to 25%, and gains may owe capital-gains tax (a 1031 exchange can defer both). Figures are a year-1 estimate at your 24.0% rate — not tax advice; consult a CPA.
Schools (NCES district)
- District
- Lancaster 01
- NCES district ID
- 4502580
- Math proficiency
- 41% ▼ -7.00%
- Reading proficiency
- 47% ▼ -1.00%
- Median HH income
- $44,165
- Composite
- 37.23/100
- National rank
- #4462
- State rank
- #26 of 80 in SC
Livability — Lancaster
- Score
- 55/100
- State rank
- #301
- US rank
- #23178
Category grades
Schools grade is shown separately in the Schools card above.
Census & demographics
- Census place
- Lancaster, SC
- County
- Lancaster County · 91,213 people
- City population
- 53,584
- Metro
- Charlotte-Concord-Gastonia, NC-SC
- Population (ZIP)
- 53,584
- Household income
- $62,969
- Rent vs Own
- Severe rent burden
- 1158.0
Population outlook (Lancaster County) Hauer SSP2
- Today (2025)
- 105,572 people
- By 2030
- 114,865 · +8.8%
- By 2040
- 132,268 · +25.3%
- By 2050
- 148,252 · +40.4%
- By 2075
- 182,540 · +72.9%
- By 2100
- 202,237 · +91.6%
Race, ethnicity, and origin ACS 2023
- Neighborhood character
- Majority White (62%)
- Race & ethnicity
- White 62% Black 26% Hispanic / Latino 8% Two or more races 5%
- Hispanic origin (detail)
- Mexican 4%
- Common ancestry
- Slovak 3% Serbian 2% Romanian 1%
- Foreign-born
- 6% · Canada
- Languages at home
- 91% English-only · Spanish 7% Other Indo-European 1%
Political lean MEDSL · Lancaster
- 2024 margin
- Strong R (+24.8) · D 37.0% · R 61.8% · Other 1.2%
- 2008→2024 swing
- -9.9pp toward R · 2008: -14.9pp · 2024: -24.8pp
- All cycles
- 2024: R+24.8 2020: R+22.8 2016: R+25.5 2012: R+18.0 2008: R+14.9
Not yet ingested
- Civics
- —
Market trends
- HPI YoY
- ▼ -95.90%
- Current HPI
- 244.328
- Rent YoY
- —
- Metro
- Charlotte-Concord-Gastonia, NC-SC
- State GDP YoY
- ▲ 4.51%
- F500 in state
- 2
Industry mix (Fortune 500 HQ in SC)
| Industry | F500 HQs | Revenue |
|---|---|---|
| Packaging | 1 | $7B |
|
||
Price history
+900.0% since first listed5 events — show timeline
- 2026-05-12 Listed $150,000 CANOPYMLS as Distributed by MLS Grid
- 2023-08-09 Sold (MLS) $60,000 CANOPYMLS as Distributed by MLS Grid
- 2023-07-18 Pending — CANOPYMLS as Distributed by MLS Grid
- 2023-07-13 Listed $30,000 CANOPYMLS as Distributed by MLS Grid
- 2004-02-13 Sold (Public Records) $15,000 Public Records
Property tax history
+8.0%/yrLatest (2024): $1,483 · +61.4% YoY. Source: county tax records.
Cash-flow waterfall
monthlySold comps — $/sqft
last 12 mo · ≤1 miLoading sold comps…