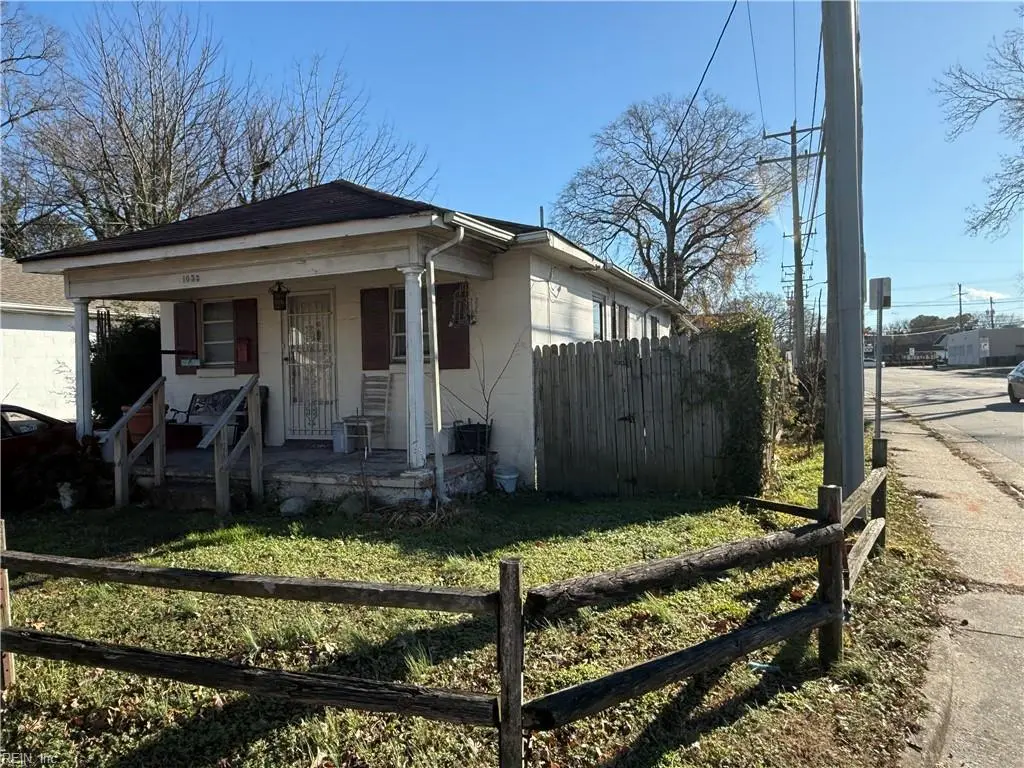
1053 Hannah St · Norfolk, VA
Flood risk 6/10 · Moderate
- FEMA flood zone
- X (unshaded)
- Chance of flooding over 30 yrs
- 0.72%
- Est. flood insurance / yr
- $507 – $1,088
Fire risk 1/10 · Minimal
- Est. fire insurance / yr
- $666 – $1,236
Heat risk 9/10 · Severe
- Hot days now (above 104°F)
- 7 days/yr
- Hot days in 30 yrs
- 16 days/yr
Wind risk 8/10 · Major
- Chance of severe wind over 30 yrs
- 80.0%
Air-quality risk 3/10 · Minor
- Unhealthy air days now
- 2 days/yr
- Unhealthy air days in 30 yrs
- 5 days/yr
Risk factors via First Street. Map © Google.
Why this score? — see what drove the C grade
The composite is a weighted blend of 9 inputs, each scored 0–100. Each bar is that input's sub-score; the figure is the points it added to the 100-point composite (weight × sub-score).
- Cash flow +17.3/30.0
- ARV discount +15.0/15.0
- DSCR +5.4/10.0
- Rent growth +5.0/5.0
- 1% rule +4.4/10.0
- Livability +4.2/5.0
- Schools +3.5/10.0
- Condition / age +2.5/5.0
- Appreciation +0.0/10.0
$140,000
🖨 Deal sheet 📄 Offer letter ✓ Due diligence
Listing remarks MLS
Investors — rental or flip potential- Anyone seeking a project — add your own updates and build equity! Inside this 722 sf home, you’ll find 2 BR, 1 BA. Home is being sold "As-Is, Where Is."
Key facts
- Built 1960
- Listed 181 days
Neighborhood map
What this means for you Summary
Snapshot
- This is a 2-bed/1.0-bath single-family listed at $140k.
Deal economics
- At list price, monthly cash flow is $103 ($1k/yr) — positive.
- The deal already cash-flows at list — no discount required.
- To meet the 1% rule (rent ≥ 1% of price), the offer needs to be $132k (5.7% below list).
- Recommended offer: $123k (12.0% below list) — sets the bar for market timing.
- Cap rate 7.2% vs local median 4.0% in Norfolk — top-decile yield for the area; either an underpriced asset or a hidden risk that comps aren't pricing in. Stress-test before assuming the spread holds.
Location & tenants
- Location reads 83/100 on livability (#43 in VA, #1,026 nationally) — a professional / high-income tenant draw. Strengths: amenities A+, commute A+, health & safety A+; Watch: employment C-, crime F.
- Norfolk City Public School District (urban): math 27% / reading 56% proficiency, ranked #118 of 131 in VA (top 90%) — families likely to look elsewhere, expect single-tenant / working-renter base with shorter leases.
- Market conditions: Rents rising fast (+12.1%/yr); 106 active listings in the ZIP; 10 comparable units currently listed for rent nearby; rentals at typical pace (median 24d on market — plan ~3-4 weeks tenant-placement turnaround); 40% of comp listings sitting > 30 days — soft ceiling on asking rent; 438 units permitted in Norfolk city in 2024 (273 in 5+ unit buildings).
Forward outlook
- Local home prices are declining (-3.0%/yr); year-one equity from $968 of loan paydown is wiped out by about $4k of value loss. Plan a longer hold.
- At projected returns (-3.0% appreciation + 8.0% rent growth), your $39k cash investment doubles in ~10 years — after that, you're playing with house money.
Negotiation context
- It's been on market 181 days — a 12% lower offer ($123k) is reasonable based on typical stale-listing flexibility.
- Current owner paid $9k; list at $140k implies a 1491% gain — meaningful room to come down on a strong offer.
Risks & watch-outs
- Climate carrying-cost: major flood risk; severe wind risk, 80% chance of damaging wind over 30y; extreme-heat days projected 7→16/yr by 2055 (HVAC capex compounding) — expect insurance premiums to compound above CPI over the hold.
Questions for the listing agent
- It's been on market 181 days. Have you received any prior offers? Is the seller open to a 12% concession, seller financing, or rate buy-down credit?
- Built in 1960 — when were the roof, HVAC, electrical panel, plumbing, and water heater last replaced?
- Why hasn't it sold? Are there any deal-killer items the seller is aware of (foundation, flood, title, zoning, code violations)?
- Is there a deadline driving the sale (1031 exchange, divorce, estate, relocation)? That informs how much negotiation room exists.
- Schools are A-rated — typically a magnet for longer-tenancy family renters. What's the average tenant stay here, and is there a school-zone premium baked into asking?
- Crime grade is F in this area — have there been break-ins, vandalism, or insurance claims at this property in the last 3 years? What carrier currently insures it and at what premium?
- What's the average days-on-market for RENTAL listings here right now (not sales)? A rising rental-DOM trend means longer vacancies and softer asking-rent achievability than the comps imply.
- What's the recent tenant-quality profile in this submarket — average credit score on applications, eviction rate, late-payment / NSF rate, and stable-employment percentage? A property-management company in the area should have these aggregated.
- How much new for-sale + rental construction is in the pipeline within 1–3 miles? Heavy new supply typically softens prices + rents 12–24 months out; constrained supply supports both.
Investment metrics
- 1% rule
- 0.94% ✗
- Cap rate
- 7.18%
- Cash-on-cash
- 3.16%
- DSCR
- 1.14
- GRM
- 8.8
CMA / ARV
- ARV (median comp)
- $199,000
- List price
- $140,000
- Delta
- -29.65%
- Verdict
- UNDERPRICED
- Comps
- 7 within 1.0 mi
Show comp detail 6 sales within ~0.75 mi
| Address | Dist | Beds/Ba | Sqft | Sold | Price | $/sf | Match |
|---|---|---|---|---|---|---|---|
| 1108 Hannah St | 0.03mi | 2/1.0 | 704 (-2%) | 2mo | $162,000 | $230 | 92 |
| 1113 Matthew Henson St | 0.09mi | 2/1.0 | 672 (-7%) | 4mo | $195,000 | $290 | 81 |
| 1112 Matthew Henson St | 0.11mi | 2/1.0 | 672 (-7%) | 4mo | $199,000 | $296 | 80 |
| 1029 Hannah St | 0.04mi | 2/2.0 | 750 (+4%) | 10mo | $248,800 | $332 | 79 |
| 1115 Matthew Henson St | 0.09mi | 2/1.0 | 672 (-7%) | 9mo | $129,000 | $192 | 76 |
| 7475 Diven St | 0.32mi | 2/1.0 | 760 (+5%) | 10mo | $209,900 | $276 | 68 |
Match score weights: distance 35% · size 25% · config 20% · recency 20%. Top-matched comps best support the ARV.
Projected returns pro-forma
-3.0% appreciation · 8.0% rent growth · sell at horizon
- IRR
- -6.0%
- Equity multiple
- 0.77×
- Total profit
- $-9,121
- Equity at exit
- $20,874
- IRR
- 8.8%
- Equity multiple
- 1.82×
- Total profit
- $32,313
- Equity at exit
- $12,105
Cash invested: $39,200 (down + closing). Projections, not guarantees.
Landlord ↔ Tenant lean methodology
- Overall (STATE)
- 55 Moderately Landlord-Leaning
- State Virginia
- 55 Moderately Landlord-Leaning · D+2
- County
- — inherits STATE
- City
- — inherits STATE
ZIP-level market 23505
- Home prices YoY
- -19.6%
- Rents YoY
- 12.1%
- Active inventory
- 106
- Price-to-rent
- 8.8×
Monthly cashflow live
- Estimated rent
- $1,321 high interval (Pro) →
- Mortgage (P&I)
- −$734
- Tax from tax record
- −$147 /mo · $1,770/yr
- Insurance
- −$58
- HOA
- −$0
- Vacancy / Maint / Mgmt
- −$277
- Net cashflow
- $103
Break-even live
UW: 25.0% down · 7.5% · 30yr · 1.5% tax · 5.0% vac · 8.0% maint · 8.0% mgmt
Financing live
Cash to close
- Down payment
- $35,000
- Closing costs
- $4,200
- Reserves months
- —
- Total cash needed
- —
Loan-product check · same deal, 3 products live
Conventional
25% down · 7.5% · 30yr
- Down + closing
- —
- Monthly P&I
- —
- Monthly cashflow
- —
- DSCR
- —
- Eligible?
- —
Personal DTI + credit; lowest rate.
DSCR
20% down · 8.5% · 30yr
- Down + closing
- —
- Monthly P&I
- —
- Monthly cashflow
- —
- DSCR
- —
- Eligible?
- —
No personal income docs; deal must DSCR.
Hard money
10% down · 12.0% · 12mo
- Down + closing
- —
- Monthly P&I
- —
- Monthly cashflow
- —
- DSCR
- —
- Eligible?
- —
Short-term bridge; refi at stabilization.
Rent comps 10 comps
| Address | Beds | Baths | Sqft | Rent | $/sqft | DOM | Units | Dist |
|---|---|---|---|---|---|---|---|---|
| 7704 Enfield Ave Norfolk, VA | 2.0 | 1.0 | 725 | $1,250 | $1.72 | 23d | 1 | 0.18mi |
| 7872 Ogden Ave Norfolk, VA | 1.0–3.0 | 1.0–2.0 | 963 | $1,285 | $1.33 | 43d | 1 | 0.33mi |
| 1482 Meads Rd Norfolk, VA | 1.0 | 1.0 | 700 | $1,209 | $1.73 | 23d | 1 | 0.49mi |
| 502 Grantham Rd Norfolk, VA | 1.0–2.0 | 1.0 | 740 | $1,128 | $1.52 | 43d | 3 | 0.64mi |
| 7715 Harrisons Rd Norfolk, VA | 2.0 | 1.0 | 862 | $1,620 | $1.88 | 16d | 8 | 0.74mi |
| 7314 Hampton Blvd Norfolk, VA | 1.0 | 1.0 | 650 | $1,025 | $1.58 | 43d | 1 | 0.76mi |
| 408 W Little Creek Rd Norfolk, VA | 1.0 | 1.0 | 550 | $1,075 | $1.95 | 43d | 2 | 0.78mi |
| 8600 Glen Myrtle Ave Norfolk, VA | 1.0–2.0 | 1.0 | 820 | $1,589 | $1.94 | 1d | 18 | 1.28mi |
| 201 Glendale Ave Unit B Norfolk, VA | 1.0 | 1.0 | 650 | $1,150 | $1.77 | 10d | 1 | 1.36mi |
| 211 Rogers Ave Unit B Norfolk, VA | 2.0 | 1.0 | 700 | $1,300 | $1.86 | 23d | 1 | 1.44mi |
Listing history 15 events
-
2026-06-18days on market $140,000 Active 181 DOM
-
2026-06-17days on market $140,000 Active 180 DOM
-
2026-06-16days on market $140,000 Active 179 DOM
-
2026-06-15days on market $140,000 Active 178 DOM
-
2026-06-13days on market $140,000 Active 176 DOM
-
2026-06-09days on market $140,000 Active 172 DOM
-
2026-06-08days on market $140,000 Active 171 DOM
-
2026-06-07days on market $140,000 Active 170 DOM
-
2026-06-03days on market $140,000 Active 166 DOM
-
2026-06-02days on market $140,000 Active 165 DOM
-
2026-06-01days on market $140,000 Active 164 DOM
-
2026-05-31days on market $140,000 Active 163 DOM
-
2026-04-30price $140,000 218-char remark
Show marketing remark (218 chars)
Investors — rental or flip potential- Anyone seeking a project — add your own updates and build equity! Inside this 722 sf home, you’ll find 2 BR, 1 BA. Home is being sold "As-Is, Where Is."
-
2025-12-19$150,000 Active 218-char remark
Show marketing remark (218 chars)
Investors — rental or flip potential- Anyone seeking a project — add your own updates and build equity! Inside this 722 sf home, you’ll find 2 BR, 1 BA. Home is being sold "As-Is, Where Is."
-
1976-02-09soldstatus $8,800
ⓘ Source: listings_history table (triggers on properties + properties_extension) + one-shot
backfill from property_details.listing_events for pre-trigger history.
Tax reassessment forecast VA · Resets to sale price
- Current annual tax
- $1,770 · $147/mo
- Projected year-2 tax
- $1,770 · $147/mo
- Expected delta
- $0/yr ($0/mo · 0.0%)
ⓘ Screening estimate from a state-policy table — verify with the county assessor before closing.
Climate risk First Street
- Flood 6/10 Major FEMA zone X (unshaded) · 72% chance over 30 yrs
- Wildfire 1/10 Low
- Heat 9/10 Extreme 7 d/yr ≥104°F today · 16 d/yr by 30 yrs out
- Wind 8/10 Severe 80% chance of damaging wind over 30 yrs
- Air quality 3/10 Moderate 2 unhealthy d/yr today · 5 by 30 yrs out
Nearby sold comps map
Loading sold comps map…
Walkable amenities ~0.75 mi
Loading nearby amenities…
Taxation est. · year 1
- Rental income
- $15,848
- − Mortgage interest
- −$7,842
- − Property taxes
- −$1,770
- − Insurance
- −$700
- − Repairs & maintenance
- −$1,268
- − Management
- −$1,268
- − Depreciation
- −$4,073
- Taxable loss
- −$1,072
- Est. tax savings @ 24.0%
- +$257
- After-tax cash flow
- $1,498/yr
For passive investors: Depreciation is non-cash, so a rental often shows a tax loss while cash-flowing — sheltering income. Rental losses are passive: they offset passive income freely, and up to $25,000/yr can offset ordinary (W-2) income if you actively participate and your MAGI is under $100k (phasing out to $0 by $150k); unused losses carry forward. On sale, claimed depreciation is recaptured at up to 25%, and gains may owe capital-gains tax (a 1031 exchange can defer both). Figures are a year-1 estimate at your 24.0% rate — not tax advice; consult a CPA.
Schools (NCES district)
- District
- Norfolk City Public School District
- NCES district ID
- 5102670
- Math proficiency
- 27% ▼ -44.00%
- Reading proficiency
- 56% ▼ -10.00%
- Median HH income
- $44,358
- Composite
- 35.08/100
- National rank
- #5026
- State rank
- #118 of 131 in VA
Livability — Norfolk
- Score
- 83/100
- State rank
- #43
- US rank
- #1026
Category grades
Schools grade is shown separately in the Schools card above.
Census & demographics
- Census place
- Norfolk, VA
- County
- Norfolk City · 214,042 people
- City population
- 214,042
- Metro
- Virginia Beach-Norfolk-Newport News, VA-NC
- Population (ZIP)
- 28,247
- Household income
- $58,579
- Rent vs Own
- Severe rent burden
- 2299.0
Population outlook (Norfolk County) Hauer SSP2
- Today (2025)
- 249,032 people
- By 2030
- 252,347 · +1.3%
- By 2040
- 253,644 · +1.9%
- By 2050
- 251,913 · +1.2%
- By 2075
- 245,281 · -1.5%
- By 2100
- 219,548 · -11.8%
Race, ethnicity, and origin ACS 2023
- Neighborhood character
- Diverse neighborhood (Simpson 0.67)
- Race & ethnicity
- White 44% Black 34% Hispanic / Latino 12% Two or more races 8% Asian 4%
- Hispanic origin (detail)
- Mexican 4% Puerto Rican 3%
- Common ancestry
- Romanian 2% Slovak 2% Italian 2%
- Foreign-born
- 9% · Canada, United Kingdom, South Korea
- Languages at home
- 87% English-only · Spanish 6% Tagalog/Filipino 1% French/Haitian/Cajun 1%
Political lean MEDSL · Norfolk
- 2024 margin
- Solid D (+41.5) · D 70.0% · R 28.5% · Other 1.6%
- 2008→2024 swing
- -1.4pp toward R · 2008: 43.0pp · 2024: 41.5pp
- All cycles
- 2024: D+41.5 2020: D+45.6 2016: D+42.0 2012: D+44.0 2008: D+43.0
Not yet ingested
- Civics
- —
Market trends
- HPI YoY
- ▼ -71.86%
- Current HPI
- 294.9807
- Rent YoY
- ▲ 12.08%
- Metro
- Virginia Beach-Norfolk-Newport News, VA-NC
- State GDP YoY
- ▲ 2.40%
- F500 in state
- 50
Industry mix (Fortune 500 HQ in VA)
| Industry | F500 HQs | Revenue |
|---|---|---|
| Aerospace / Defense | 4 | $236B |
|
||
| Technology / Defense | 3 | $32B |
|
||
| Financial Services | 2 | $176B |
|
||
| Utilities | 2 | $27B |
|
||
| Insurance | 2 | $25B |
|
||
| Technology | 2 | $15B |
|
||
Price history
+1490.9% since first listed3 events — show timeline
- 2026-04-30 Price Changed $140,000 REINMLS
- 2025-12-19 Listed $150,000 REINMLS
- 1976-02-09 Sold (Public Records) $8,800 Public Records
Property tax history
+6.0%/yrLatest (2025): $1,770 · +11.4% YoY. Source: county tax records.
Cash-flow waterfall
monthlySold comps — $/sqft
last 12 mo · ≤1 miLoading sold comps…