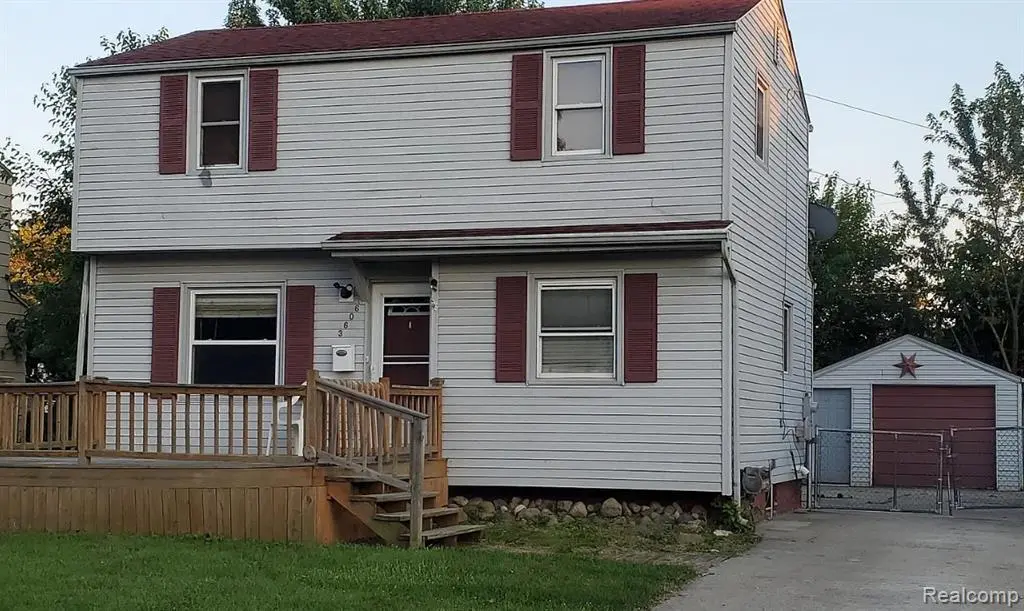
3606 Dale Ave · Flint, MI
Flood risk 1/10 · Minimal
- FEMA flood zone
- X (unshaded)
- Chance of flooding over 30 yrs
- 0.0%
- Est. flood insurance / yr
- $473 – $860
Fire risk 1/10 · Minimal
- Est. fire insurance / yr
- $784 – $1,456
Heat risk 2/10 · Minimal
- Hot days now (above 96°F)
- 7 days/yr
- Hot days in 30 yrs
- 15 days/yr
Wind risk 2/10 · Minimal
- Chance of severe wind over 30 yrs
- —
Air-quality risk 3/10 · Minor
- Unhealthy air days now
- 2 days/yr
- Unhealthy air days in 30 yrs
- 3 days/yr
Risk factors via First Street. Map © Google.
Why this score? — see what drove the C grade
The composite is a weighted blend of 9 inputs, each scored 0–100. Each bar is that input's sub-score; the figure is the points it added to the 100-point composite (weight × sub-score).
- Cash flow +21.7/30.0
- ARV discount +12.3/15.0
- DSCR +6.9/10.0
- 1% rule +5.5/10.0
- Livability +3.7/5.0
- Rent growth +2.5/5.0
- Condition / age +2.5/5.0
- Schools +1.1/10.0
- Appreciation +0.0/10.0
$99,999
🖨 Deal sheet 📄 Offer letter ✓ Due diligence
Listing remarks MLS
Welcome to this beautifully renovated home offering an exceptional combination of character, space, and modern updates. This impressive multi-story residence has been thoughtfully improved while maintaining the charm and presence that make it truly stand out from the competition. Inside, you'll find spacious living areas, updated finishes, and a functional layout designed for both comfortable everyday living and entertaining. The home's generous size provides flexibility for larger households, home offices, guest space, or additional recreational areas. Natural light fills the interior, creating a warm and inviting atmosphere throughout. Location is one of this property's strongest features. Situated in a highly desirable area with convenient access to shopping, dining, schools, parks, and major roadways, this home offers the perfect balance of neighborhood appeal and accessibility. Properties of this size and quality are becoming increasingly difficult to find, especially those that have already undergone extensive renovations. Whether you're searching for your next primary residence or a turnkey investment opportunity, this home delivers outstanding value, space, and curb appeal. With its impressive presence, modern updates, and sought-after location, this is an opportunity you won't want to miss. Buyer to verify all information, measurements, and condition. Schedule your showing today and experience everything this exceptional home has to offer.
Key facts
- Renovated home
- Updated finishes
- Natural light
Tags
Property features AI
Exterior
- Parking: Detached garage with 1 parking space
- Utilities: Natural gas heat; Forced air heating; Public water
- Home design: Residential property; Two-story structure; Built in 1953
- Construction: Michigan-style basement foundation
- Exterior features: Vinyl siding; Paved street access; Frontage approximately 45 feet
Interior
- Kitchen: Entry-level kitchen about 10 x 9
- Bedrooms: Entry-level bedroom about 11 x 10; Second-floor bedroom about 9 x 9; Second-floor bedroom about 18 (width shown)
- Bathrooms: One full bathroom on the entry level (approx. 6 x 5)
- Interior features: 6 total rooms; Basement present
- Laundry & utility: Basement (utility/laundry area available)
Neighborhood map
What this means for you Summary
Snapshot
- This is a 3-bed/1.0-bath single-family listed at $100k.
Deal economics
- At list price, monthly cash flow is $153 ($2k/yr) — positive.
- The deal already cash-flows at list — no discount required.
- Meets the 1% rule at list price ($1k rent vs $100k).
- Cap rate 8.1% vs local median 11.5% in Flint — below-typical yield; the buyer is paying a premium for something (appreciation thesis, condition, location) that the cap rate doesn't capture.
Location & tenants
- Location reads 74/100 on livability (#196 in MI, #4,946 nationally) — a middle-class / working-renter tenant base. Strengths: commute A+, cost of living A+, housing A+; Watch: schools F, crime F, employment F.
- Flint School District (urban): math 7% / reading 13% proficiency, ranked #714 of 760 in MI (top 94%) — low school quality limits family demand, transient renter base, plan for 1-2y turnover; 83% free/reduced lunch — lower-income household profile, screen leases tightly.
- Market conditions: 202 active listings in the ZIP; 8 comparable units currently listed for rent nearby; rentals leasing fast (median 14d on market — plan ~1-2 weeks tenant-placement turnaround); 419 units permitted in Genesee County in 2024 (68 in 5+ unit buildings).
Forward outlook
- Local home prices are declining (-3.0%/yr); year-one equity from $691 of loan paydown is wiped out by about $3k of value loss. Plan a longer hold.
- Genesee County population projected at -27% by 2050 — secular population decline; favor cash flow + early exit over multi-decade hold.
Negotiation context
- Only 4 days on market — expect competitive offers; lowballing is unlikely to land.
- 14 sale attempts since 34y ago with the ask held roughly flat each time — persistent listings suggest the price (not the market) is what's stuck; bring a comps-based counter.
- Current owner paid $70k; 43% above their basis — modest negotiation headroom, anchor on the comps not their cost.
Risks & watch-outs
- Watch-outs: built in 1953 — expect roof / HVAC / electrical / plumbing capex.
Questions for the listing agent
- Built in 1953 — when were the roof, HVAC, electrical panel, plumbing, and water heater last replaced?
- Is there a deadline driving the sale (1031 exchange, divorce, estate, relocation)? That informs how much negotiation room exists.
- Schools are F-rated, which usually means shorter tenancies and higher turnover. Who's the typical renter profile here, and what's been the actual vacancy rate?
- Crime grade is F in this area — have there been break-ins, vandalism, or insurance claims at this property in the last 3 years? What carrier currently insures it and at what premium?
- What's the average days-on-market for RENTAL listings here right now (not sales)? A rising rental-DOM trend means longer vacancies and softer asking-rent achievability than the comps imply.
- What's the recent tenant-quality profile in this submarket — average credit score on applications, eviction rate, late-payment / NSF rate, and stable-employment percentage? A property-management company in the area should have these aggregated.
- How much new for-sale + rental construction is in the pipeline within 1–3 miles? Heavy new supply typically softens prices + rents 12–24 months out; constrained supply supports both.
Investment metrics
- 1% rule
- 1.05% ✓
- Cap rate
- 8.13%
- Cash-on-cash
- 6.58%
- DSCR
- 1.29
- GRM
- 7.9
CMA / ARV
- ARV (on-the-fly)
- $111,824
- Comps found
- 12
Show comp detail 12 sales within ~0.75 mi
| Address | Dist | Beds/Ba | Sqft | Sold | Price | $/sf | Match |
|---|---|---|---|---|---|---|---|
| 3614 Holly Ave Ave | 0.05mi | 3/1.0 | 975 (+1%) | 0mo | $79,000 | $81 | 95 |
| 3745 Holly Ave | 0.18mi | 2/1.0 (-1) | 949 (-2%) | 7mo | $126,500 | $133 | 78 |
| 3826 Woodrow Ave | 0.33mi | 3/1.0 | 954 (-1%) | 7mo | $116,900 | $123 | 77 |
| 3730 Holly Ave | 0.13mi | 2/1.0 (-1) | 904 (-6%) | 6mo | $108,000 | $119 | 73 |
| 3617 Churchill Ave | 0.03mi | 2/1.0 (-1) | 864 (-10%) | 4mo | $97,675 | $113 | 72 |
| 3220 Woodrow Ave | 0.34mi | 3/1.0 | 910 (-6%) | 5mo | $71,000 | $78 | 70 |
| 3740 Ivanhoe Ave | 0.24mi | 2/1.0 (-1) | 898 (-7%) | 3mo | $69,000 | $77 | 70 |
| 3813 Holly Ave | 0.23mi | 2/2.0 (-1) | 906 (-6%) | 2mo | $72,000 | $79 | 69 |
| 3809 Delaware Ave | 0.45mi | 3/1.0 | 898 (-7%) | 3mo | $140,000 | $156 | 66 |
| 3413 Dakota Ave | 0.53mi | 3/2.0 | 1,018 (+6%) | 2mo | $113,351 | $111 | 60 |
| 4093 Coral St | 0.58mi | 2/1.0 (-1) | 906 (-6%) | 1mo | $105,000 | $116 | 57 |
| 4140 Risedorph St | 0.61mi | 2/1.0 (-1) | 864 (-10%) | 5mo | $100,500 | $116 | 45 |
Match score weights: distance 35% · size 25% · config 20% · recency 20%. Top-matched comps best support the ARV.
Projected returns pro-forma
-3.0% appreciation · 3.0% rent growth · sell at horizon
- IRR
- -6.2%
- Equity multiple
- 0.77×
- Total profit
- $-6,427
- Equity at exit
- $14,910
- IRR
- 3.5%
- Equity multiple
- 1.25×
- Total profit
- $7,010
- Equity at exit
- $8,646
Cash invested: $28,000 (down + closing). Projections, not guarantees.
Landlord ↔ Tenant lean methodology
- Overall (STATE)
- 62 Landlord-Friendly
- State Michigan
- 62 Landlord-Friendly · EVEN
- County
- — inherits STATE
- City
- — inherits STATE
ZIP-level market 48506
- Active inventory
- 202
- Price-to-rent
- 7.9×
Monthly cashflow live
- Estimated rent
- $1,048 high interval (Pro) →
- Mortgage (P&I)
- −$524
- Tax from tax record
- −$109 /mo · $1,305/yr
- Insurance
- −$42
- HOA
- −$0
- Vacancy / Maint / Mgmt
- −$220
- Net cashflow
- $153
Break-even live
UW: 25.0% down · 7.5% · 30yr · 1.5% tax · 5.0% vac · 8.0% maint · 8.0% mgmt
Financing live
Cash to close
- Down payment
- $25,000
- Closing costs
- $3,000
- Reserves months
- —
- Total cash needed
- —
Loan-product check · same deal, 3 products live
Conventional
25% down · 7.5% · 30yr
- Down + closing
- —
- Monthly P&I
- —
- Monthly cashflow
- —
- DSCR
- —
- Eligible?
- —
Personal DTI + credit; lowest rate.
DSCR
20% down · 8.5% · 30yr
- Down + closing
- —
- Monthly P&I
- —
- Monthly cashflow
- —
- DSCR
- —
- Eligible?
- —
No personal income docs; deal must DSCR.
Hard money
10% down · 12.0% · 12mo
- Down + closing
- —
- Monthly P&I
- —
- Monthly cashflow
- —
- DSCR
- —
- Eligible?
- —
Short-term bridge; refi at stabilization.
Rent comps 8 comps
| Address | Beds | Baths | Sqft | Rent | $/sqft | DOM | Units | Dist |
|---|---|---|---|---|---|---|---|---|
| 2311 N Averill Ave Unit Main Flint, MI | 3.0 | 1.0 | 950 | $1,200 | $1.26 | 13d | 1 | 0.32mi |
| 2621 Churchill Ave Flint, MI | 2.0 | 1.0 | 736 | $795 | $1.08 | 13d | 1 | 0.80mi |
| 3618 Branch Rd Flint, MI | 2.0 | 1.0 | 950 | $950 | $1.00 | 13d | 1 | 1.06mi |
| 3901 N Averill Apt #307 Ave heuristic Flint, MI | 2.0 | 1.0 | 850 | $975 | $1.15 | 7d | 1 | 1.10mi |
| 902 Burlington Dr Flint, MI | 1.0–2.0 | 1.0 | 850 | $998 | $1.17 | 13d | 4 | 1.11mi |
| 501 S Meade St Flint, MI | 2.0 | 1.0 | 850 | $695 | $0.82 | 13d | 1 | 1.13mi |
| 1605 Kearsley Park Blvd Flint, MI | 2.0 | 1.0 | 875 | $975 | $1.11 | 13d | 1 | 1.49mi |
| 1553 Illinois Ave Flint, MI | 2.0 | 1.0 | 702 | $900 | $1.28 | 21d | 1 | 1.50mi |
Listing history 6 events
-
2026-06-18days on market $99,999 Active 4 DOM
-
2026-06-17days on market $99,999 Active 3 DOM
-
2026-06-16days on market $99,999 Active 2 DOM
-
2026-06-15$99,999 Active 1 DOM
-
2026-06-15remarks 699-char remark
-
2026-06-15$99,999 Active 1 DOM
ⓘ Source: listings_history table (triggers on properties + properties_extension) + one-shot
backfill from property_details.listing_events for pre-trigger history.
Tax reassessment forecast MI · Partial reset (capped growth)
- Current annual tax
- $1,305 · $109/mo
- Projected year-2 tax
- $1,423 · $119/mo
- Expected delta
- +$117/yr (+$10/mo · 9.0%)
ⓘ Screening estimate from a state-policy table — verify with the county assessor before closing.
Climate risk First Street
- Flood 1/10 Low FEMA zone X (unshaded) · 0% chance over 30 yrs
- Wildfire 1/10 Low
- Heat 2/10 Low 7 d/yr ≥96°F today · 15 d/yr by 30 yrs out
- Wind 2/10 Low
- Air quality 3/10 Moderate 2 unhealthy d/yr today · 3 by 30 yrs out
Nearby sold comps map
Loading sold comps map…
Walkable amenities ~0.75 mi
Loading nearby amenities…
Taxation est. · year 1
- Rental income
- $12,581
- − Mortgage interest
- −$5,601
- − Property taxes
- −$1,305
- − Insurance
- −$500
- − Repairs & maintenance
- −$1,006
- − Management
- −$1,006
- − Depreciation
- −$2,909
- Taxable income
- $252
- Est. tax owed @ 24.0%
- −$61
- After-tax cash flow
- $1,781/yr
For passive investors: Depreciation is non-cash, so a rental often shows a tax loss while cash-flowing — sheltering income. Rental losses are passive: they offset passive income freely, and up to $25,000/yr can offset ordinary (W-2) income if you actively participate and your MAGI is under $100k (phasing out to $0 by $150k); unused losses carry forward. On sale, claimed depreciation is recaptured at up to 25%, and gains may owe capital-gains tax (a 1031 exchange can defer both). Figures are a year-1 estimate at your 24.0% rate — not tax advice; consult a CPA.
Schools (NCES district)
- District
- Flint School District
- NCES district ID
- 2614520
- Math proficiency
- 7% ▬ 0.00%
- Reading proficiency
- 13% ▲ 3.00%
- Median HH income
- $25,954
- Composite
- 10.97/100
- National rank
- #14642
- State rank
- #714 of 760 in MI
Livability — Flint
- Score
- 74/100
- State rank
- #196
- US rank
- #4946
Category grades
Schools grade is shown separately in the Schools card above.
Census & demographics
- Census place
- Flint, MI
- County
- Genesee County · 221,329 people
- City population
- 93,814
- Metro
- Flint, MI
- Population (ZIP)
- 24,712
- Household income
- $47,929
- Rent vs Own
- Severe rent burden
- 954.0
Population outlook (Genesee County) Hauer SSP2
- Today (2025)
- 381,312 people
- By 2030
- 362,731 · -4.9%
- By 2040
- 321,550 · -15.7%
- By 2050
- 279,212 · -26.8%
- By 2075
- 193,336 · -49.3%
- By 2100
- 128,118 · -66.4%
Race, ethnicity, and origin ACS 2023
- Neighborhood character
- Predominantly White (76%)
- Race & ethnicity
- White 76% Black 9% Hispanic / Latino 8% Two or more races 7%
- Hispanic origin (detail)
- Mexican 6%
- Common ancestry
- Lithuanian 6% Romanian 4% Slovak 3%
- Foreign-born
- 3% · Canada
- Languages at home
- 96% English-only · Spanish 3%
Political lean MEDSL · Genesee
- 2024 margin
- Toss-up / Even · D 51.4% · R 47.2% · Other 1.4%
- 2008→2024 swing
- -28.3pp toward R · 2008: 32.5pp · 2024: 4.2pp
- All cycles
- 2024: D+4.2 2020: D+9.3 2016: D+9.5 2012: D+28.2 2008: D+32.5
Not yet ingested
- Civics
- —
Market trends
- HPI YoY
- ▼ -173.31%
- Current HPI
- 90.0494
- Rent YoY
- —
- Metro
- Flint, MI
- State GDP YoY
- ▲ 1.37%
- F500 in state
- 28
Industry mix (Fortune 500 HQ in MI)
| Industry | F500 HQs | Revenue |
|---|---|---|
| Automotive Parts | 3 | $48B |
|
||
| Automotive | 2 | $372B |
|
||
| Chemicals | 1 | $45B |
|
||
| Automotive Retail | 1 | $29B |
|
||
| Healthcare / Medical Devices | 1 | $23B |
|
||
| Automotive Technology | 1 | $20B |
|
||
Price history
+132.6% since first listed33 events — show timeline
- 2026-06-13 Listed $99,999 MiRealSource-MiMLS
- 2026-06-13 Listed $99,999 REALCOMP
- 2026-04-20 Rental Removed $1,400 BUILDIUM
- 2026-03-29 Listed for Rent $1,400 BUILDIUM
- 2024-10-31 Rental Removed $1,100 BUILDIUM
- 2024-10-25 Price Changed $1,100 BUILDIUM
- 2024-10-20 Price Changed $950 BUILDIUM
- 2024-09-16 Price Changed $1,000 BUILDIUM
- 2024-07-20 Listed for Rent $1,100 BUILDIUM
- 2023-07-03 Rental Removed — APPFOLIO
- 2018-07-23 Listing Removed — MiRealSource-MiMLS
- 2018-07-19 Listed $19,900 MiRealSource-MiMLS
- 2018-07-19 Listed $19,900 REALCOMP
- 2018-02-13 Pending — MiRealSource-MiMLS
- 2018-02-12 Listing Removed — MiRealSource-MiMLS
- 2018-02-12 Listing Removed — REALCOMP
- 2018-02-09 Listed $19,900 MiRealSource-MiMLS
- 2018-02-09 Listed $19,900 REALCOMP
- 2010-12-03 Listing Removed — REALCOMP
- 2001-08-31 Sold (Public Records) $70,000 Public Records
- 2001-08-17 Sold (MLS) $70,000 REALCOMP
- 2001-08-17 Sold (MLS) $70,000 MiRealSource-MiMLS
- 2001-07-17 Listing Removed — MiRealSource-MiMLS
- 2001-05-08 Listed $74,900 REALCOMP
- 2001-05-08 Listed $74,900 MiRealSource-MiMLS
- 2001-01-24 Listing Removed — MiRealSource-MiMLS
- 2001-01-24 Listed $76,900 MiRealSource-MiMLS
- 2001-01-24 Listed $76,900 REALCOMP
- 1992-10-20 Sold (MLS) $40,000 MiRealSource-MiMLS
- 1992-10-20 Sold (MLS) $40,000 REALCOMP
- 1992-08-12 Listing Removed — MiRealSource-MiMLS
- 1992-07-14 Listed $43,000 MiRealSource-MiMLS
- 1992-07-14 Listed $43,000 REALCOMP
Property tax history
+4.7%/yrLatest (2025): $1,305 · +1.8% YoY. Source: county tax records.
Cash-flow waterfall
monthlySold comps — $/sqft
last 12 mo · ≤1 miLoading sold comps…