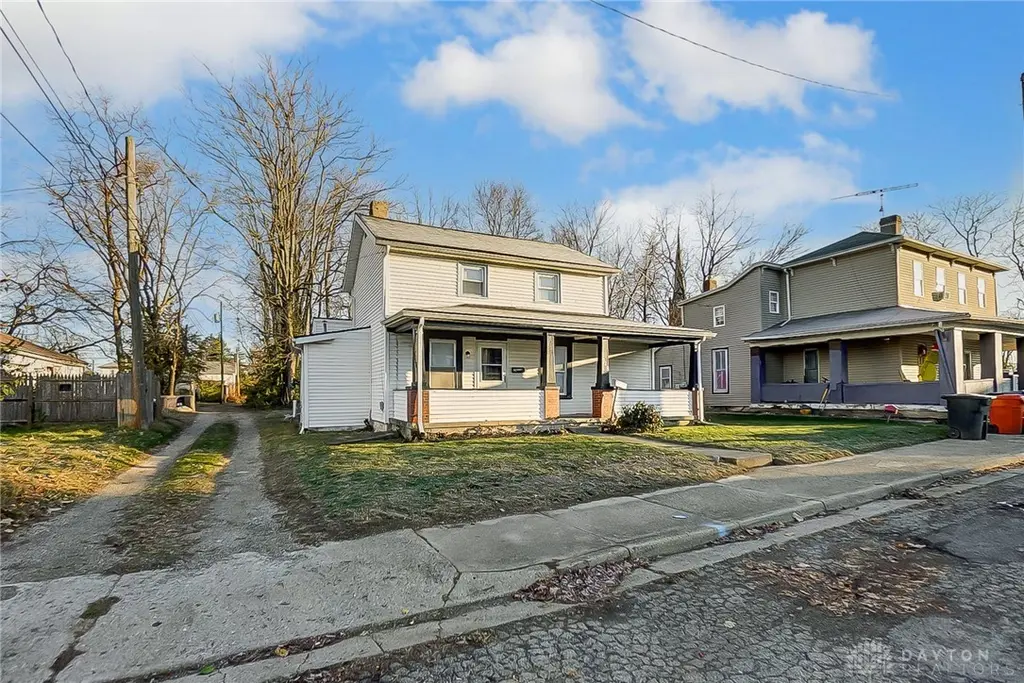
718 Summer St · Springfield, OH
Flood risk 1/10 · Minimal
- FEMA flood zone
- X (unshaded)
- Chance of flooding over 30 yrs
- 0.0%
- Est. flood insurance / yr
- $473 – $860
Fire risk 1/10 · Minimal
- Est. fire insurance / yr
- $713 – $1,323
Heat risk 3/10 · Minor
- Hot days now (above 100°F)
- 7 days/yr
- Hot days in 30 yrs
- 18 days/yr
Wind risk 2/10 · Minimal
- Chance of severe wind over 30 yrs
- —
Air-quality risk 3/10 · Minor
- Unhealthy air days now
- 2 days/yr
- Unhealthy air days in 30 yrs
- 3 days/yr
Risk factors via First Street. Map © Google.
Why this score? — see what drove the C+ grade
The composite is a weighted blend of 9 inputs, each scored 0–100. Each bar is that input's sub-score; the figure is the points it added to the 100-point composite (weight × sub-score).
- Cash flow +28.0/30.0
- DSCR +9.9/10.0
- ARV discount +7.5/15.0
- 1% rule +6.9/10.0
- Livability +2.8/5.0
- Rent growth +2.5/5.0
- Condition / age +2.5/5.0
- Schools +1.9/10.0
- Appreciation +0.0/10.0
$129,900
🖨 Deal sheet (PDF) 📄 Offer letter ✓ Due diligence
Listing remarks
This is a fantastic opportunity for both owner occupants and investors. Currently rented at $1,500 per month, the property offers immediate, reliable income. The tenant covers all utilities except water, helping keep operating costs low and returns strong. The home features four bedrooms and two full bathrooms, with two bedrooms and one full bath on each level. The layout provides flexibility for a variety of living arrangements, whether you are accommodating guests, creating private space, or planning for multi generational living. The kitchen and bathrooms have been recently updated with modern finishes, and the kitchen includes brand new stainless steel appliances. Recent plumbing update
Key facts
- 7,500 sq ft lot
- Built 1866
- Listed 75 days
Neighborhood map
What this means for you Summary
Snapshot
- This is a 4-bed/2.0-bath single-family listed at $130k.
Deal economics
- At list price, monthly cash flow is $404 ($5k/yr) — positive.
- The deal already cash-flows at list — no discount required.
- Meets the 1% rule at list price ($2k rent vs $130k).
- Recommended offer: $122k (6.0% below list) — sets the bar for market timing.
- Cap rate 10.0% vs local median 4.7% in Springfield — top-decile yield for the area; either an underpriced asset or a hidden risk that comps aren't pricing in. Stress-test before assuming the spread holds.
Location & tenants
- Location reads 56/100 on livability (#1,108 in OH) — a working-class tenant base; expect higher turnover. Strengths: cost of living A+, housing A+; Watch: crime F, amenities F, commute F.
- Springfield City School District (urban): math 20% / reading 27% proficiency, ranked #616 of 656 in OH (top 94%) — low school quality limits family demand, transient renter base, plan for 1-2y turnover; 75% free/reduced lunch — lower-income household profile, screen leases tightly.
- Market conditions: 158 active listings in the ZIP; 14 comparable units currently listed for rent nearby; rentals at typical pace (median 15d on market — plan ~3-4 weeks tenant-placement turnaround); lower-income renter base — watch delinquency; 232 units permitted in Clark County in 2024 (116 in 5+ unit buildings).
- This rent runs 42% of the median local income ($44k/yr) — at the standard rent-burdened threshold; future hikes will face affordability resistance.
Forward outlook
- Local home prices are declining (-3.0%/yr); year-one equity from $898 of loan paydown is wiped out by about $4k of value loss. Plan a longer hold.
- Clark County population projected at -16% by 2050 — secular population decline; favor cash flow + early exit over multi-decade hold.
- At projected returns (-3.0% appreciation + 3.0% rent growth), your $36k cash investment doubles in ~9 years — after that, you're playing with house money.
Negotiation context
- It's been on market 76 days — a 6% lower offer ($122k) is reasonable based on typical stale-listing flexibility.
- 10 sale attempts since 2y ago with the ask held roughly flat each time — persistent listings suggest the price (not the market) is what's stuck; bring a comps-based counter.
- Current owner paid $100k; 30% above their basis — modest negotiation headroom, anchor on the comps not their cost.
Risks & watch-outs
- Watch-outs: built in 1866 — expect roof / HVAC / electrical / plumbing capex.
Questions for the listing agent
- It's been on market 76 days. Have you received any prior offers? Is the seller open to a 6% concession, seller financing, or rate buy-down credit?
- Built in 1866 — when were the roof, HVAC, electrical panel, plumbing, and water heater last replaced?
- Why hasn't it sold? Are there any deal-killer items the seller is aware of (foundation, flood, title, zoning, code violations)?
- Is there a deadline driving the sale (1031 exchange, divorce, estate, relocation)? That informs how much negotiation room exists.
- Crime grade is F in this area — have there been break-ins, vandalism, or insurance claims at this property in the last 3 years? What carrier currently insures it and at what premium?
- What's the average days-on-market for RENTAL listings here right now (not sales)? A rising rental-DOM trend means longer vacancies and softer asking-rent achievability than the comps imply.
- What's the recent tenant-quality profile in this submarket — average credit score on applications, eviction rate, late-payment / NSF rate, and stable-employment percentage? A property-management company in the area should have these aggregated.
- How much new for-sale + rental construction is in the pipeline within 1–3 miles? Heavy new supply typically softens prices + rents 12–24 months out; constrained supply supports both.
Investment metrics
- 1% rule
- 1.19% ✓
- Cap rate
- 10.02%
- Cash-on-cash
- 13.33%
- DSCR
- 1.59
- GRM
- 7.0
CMA / ARV
- ARV (median comp)
- $61,775
- List price
- $129,900
- Delta
- 110.28%
- Verdict
- OVERPRICED
- Comps
- 20 within 1.0 mi
Show comp detail 12 sales within ~0.75 mi
| Address | Dist | Beds/Ba | Sqft | Sold | Price | $/sf | Match |
|---|---|---|---|---|---|---|---|
| 644 Clifton Ave | 0.42mi | 3/2.0 (-1) | 1,420 (+1%) | 7mo | $165,000 | $116 | 68 |
| 710 Clifton Ave | 0.42mi | 3/2.0 (-1) | 1,420 (+1%) | 9mo | $165,000 | $116 | 66 |
| 1417 Kenton St | 0.57mi | 3/2.0 (-1) | 1,384 (-2%) | 1mo | $70,000 | $51 | 65 |
| 1213 Gable St | 0.63mi | 3/2.0 (-1) | 1,430 (+2%) | 3mo | $189,900 | $133 | 60 |
| 1024 Elder St | 0.30mi | 3/2.0 (-1) | 1,242 (-12%) | 4mo | $33,334 | $27 | 58 |
| 1126 Oak St | 0.36mi | 4/1.0 | 1,596 (+14%) | 2mo | $29,200 | $18 | 56 |
| 833 E Southern Ave | 0.43mi | 3/1.0 (-1) | 1,320 (-6%) | 9mo | $100,000 | $76 | 53 |
| 1159 Selma Rd | 0.44mi | 3/1.0 (-1) | 1,519 (+8%) | 5mo | $125,000 | $82 | 53 |
| 1318 Maryland Ave | 0.51mi | 3/1.0 (-1) | 1,528 (+9%) | 4mo | $169,000 | $111 | 50 |
| 1601 Kenton St | 0.69mi | 4/2.0 | 1,538 (+9%) | 5mo | $180,000 | $117 | 48 |
| 1210 Burt St | 0.72mi | 3/2.0 (-1) | 1,490 (+6%) | 8mo | $163,720 | $110 | 45 |
| 305 Catherine St | 0.71mi | 3/1.5 (-1) | 1,272 (-10%) | 9mo | $143,000 | $112 | 37 |
Match score weights: distance 35% · size 25% · config 20% · recency 20%. Top-matched comps best support the ARV.
Projected returns pro-forma
-3.0% appreciation · 3.0% rent growth · sell at horizon
- IRR
- 3.3%
- Equity multiple
- 1.13×
- Total profit
- $4,648
- Equity at exit
- $19,369
- IRR
- 12.8%
- Equity multiple
- 2.02×
- Total profit
- $37,062
- Equity at exit
- $11,231
Cash invested: $36,372 (down + closing). Projections, not guarantees.
Landlord ↔ Tenant lean methodology
- Overall (STATE)
- 73 Landlord-Friendly
- State Ohio
- 73 Landlord-Friendly · R+6
- County
- — inherits STATE
- City
- — inherits STATE
ZIP-level market 45505
- Home prices YoY
- -34.3%
- Active inventory
- 158
- Price-to-rent
- 7.0×
Monthly cashflow live
- Estimated rent
- $1,544 high interval (Pro) →
- Mortgage (P&I)
- −$681
- Tax from tax record
- −$80 /mo · $963/yr
- Insurance
- −$54
- HOA
- −$0
- Vacancy / Maint / Mgmt
- −$324
- Net cashflow
- $404
Break-even live
Sensitivity live
| Price | -10% $477 | -5% $441 | +0% $404 | +5% $367 | +10% $330 |
|---|---|---|---|---|---|
| Rent | -10% $282 | -5% $343 | +0% $404 | +5% $465 | +10% $526 |
| Rate | -1.0pp $469 | -0.5pp $437 | base $404 | +0.5pp $370 | +1.0pp $336 |
UW: 25.0% down · 7.5% · 30yr · 1.5% tax · 5.0% vac · 8.0% maint · 8.0% mgmt
Financing live
Cash to close
- Down payment
- $32,475
- Closing costs
- $3,897
- Reserves months
- —
- Total cash needed
- —
Loan-product check · same deal, 3 products live
Conventional
25% down · 7.5% · 30yr
- Down + closing
- —
- Monthly P&I
- —
- Monthly cashflow
- —
- DSCR
- —
- Eligible?
- —
Personal DTI + credit; lowest rate.
DSCR
20% down · 8.5% · 30yr
- Down + closing
- —
- Monthly P&I
- —
- Monthly cashflow
- —
- DSCR
- —
- Eligible?
- —
No personal income docs; deal must DSCR.
Hard money
10% down · 12.0% · 12mo
- Down + closing
- —
- Monthly P&I
- —
- Monthly cashflow
- —
- DSCR
- —
- Eligible?
- —
Short-term bridge; refi at stabilization.
Rent comps 14 comps
| Address | Beds | Baths | Sqft | Rent | $/sqft | DOM | Units | Dist |
|---|---|---|---|---|---|---|---|---|
| 830 Oak St Unit 830 Springfield, OH | 4.0 | 1.5 | 1400 | $1,250 | $0.89 | 15d | 1 | 0.42mi |
| 401 Section St Springfield, OH | 4.0 | 2.0 | 1612 | $1,850 | $1.15 | 11d | 1 | 0.58mi |
| 18 E Grand Ave Springfield, OH | 4.0 | 2.0 | 1452 | $1,575 | $1.08 | 19d | 1 | 0.67mi |
| 421 Catherine St Springfield, OH | 3.0 | 2.0 | 1498 | $1,500 | $1.00 | 44d | 1 | 0.68mi |
| 1306 S Limestone St Springfield, OH | 4.0 | 2.0 | 1452 | $1,695 | $1.17 | 22d | 1 | 0.73mi |
| 515 Ludlow Ave Springfield, OH | 3.0 | 1.0 | 1000 | $950 | $0.95 | 44d | 1 | 0.77mi |
| 306 S Plum St Springfield, OH | 4.0 | 2.0 | 1352 | $1,700 | $1.26 | 44d | 1 | 1.06mi |
| 524 W Pleasant St Springfield, OH | 4.0 | 2.0 | 1456 | $1,645 | $1.13 | 11d | 1 | 1.17mi |
| 523 W Mulberry St Springfield, OH | 4.0 | 2.0 | 1456 | $1,825 | $1.25 | 11d | 1 | 1.18mi |
| 220 S Yellow Springs St Springfield, OH | 4.0 | 2.0 | 1456 | $1,645 | $1.13 | 24d | 1 | 1.19mi |
| 302 S Yellow Springs St Springfield, OH | 4.0 | 2.0 | 1456 | $1,845 | $1.27 | 11d | 1 | 1.19mi |
| 356 S Yellow Springs St Springfield, OH | 4.0 | 2.0 | 1606 | $1,825 | $1.14 | 11d | 1 | 1.20mi |
| 545 W Grand Ave Springfield, OH | 4.0 | 2.0 | 1456 | $1,595 | $1.10 | 4d | 1 | 1.28mi |
| 509 E Northern Ave Unit 511 Springfield, OH | 3.0 | 1.0 | 995 | $995 | $1.00 | 2d | 1 | 1.43mi |
Listing history 42 events
-
2026-06-19days on market $129,900 Active 76 DOM
-
2026-06-18days on market $129,900 Active 75 DOM
-
2026-06-17days on market $129,900 Active 74 DOM
-
2026-06-16days on market $129,900 Active 73 DOM
-
2026-06-15days on market $129,900 Active 72 DOM
-
2026-06-14days on market $129,900 Active 70 DOM
-
2026-06-12statusdays on market $129,900 Active 69 DOM
-
2026-05-11historical
-
2026-04-07price $129,900
-
2026-04-07price $129,900
-
2026-03-04$134,900 Active
-
2025-05-01historical $1,500
-
2025-04-16$1,500
-
2025-04-15soldstatus $100,000
-
2025-04-10soldstatus $100,000 Closed
-
2025-04-10soldstatus $100,000 Closed
-
2025-04-10soldstatus $100,000 Closed
-
2025-03-24status Pending
-
2025-03-24status Pending
-
2025-03-24status Pending
-
2025-03-13historical Contingent
-
2025-03-13historical ActiveUnderContract
-
2025-03-13historical Contingency - Finance and Inspections
-
2025-03-11price $107,910
-
2025-03-11price $107,910
-
2025-02-20price $109,000
-
2025-02-20price $109,000
-
2025-02-20price $109,000
-
2025-01-17status Active
-
2025-01-17status Active
-
2025-01-17status Active
-
2025-01-11historical Contingent
-
2025-01-11historical ActiveUnderContract
-
2025-01-11historical Contingency - Finance and Inspections
-
2024-12-03price $110,000
-
2024-12-03$110,000 Active
-
2024-12-03$110 Active
-
2024-12-03$110,000 Active
-
2024-12-02historical
-
2024-12-02historical
-
2024-10-15$130,000 Active
-
2024-10-15$130,000 Active
ⓘ Source: listings_history table (triggers on properties + properties_extension) + one-shot
backfill from property_details.listing_events for pre-trigger history.
Tax reassessment forecast OH · Partial reset (capped growth)
- Current annual tax
- $963 · $80/mo
- Projected year-2 tax
- $1,495 · $125/mo
- Expected delta
- +$532/yr (+$44/mo · 55.2%)
ⓘ Screening estimate from a state-policy table — verify with the county assessor before closing.
Climate risk First Street
- Flood 1/10 Low FEMA zone X (unshaded) · 0% chance over 30 yrs
- Wildfire 1/10 Low
- Heat 3/10 Moderate 7 d/yr ≥100°F today · 18 d/yr by 30 yrs out
- Wind 2/10 Low
- Air quality 3/10 Moderate 2 unhealthy d/yr today · 3 by 30 yrs out
Nearby sold comps map
Loading sold comps map…
Walkable amenities ~0.75 mi
Loading nearby amenities…
Taxation est. · year 1
- Rental income
- $18,524
- − Mortgage interest
- −$7,276
- − Property taxes
- −$963
- − Insurance
- −$650
- − Repairs & maintenance
- −$1,482
- − Management
- −$1,482
- − Depreciation
- −$3,779
- Taxable income
- $2,892
- Est. tax owed @ 24.0%
- −$694
- After-tax cash flow
- $4,153/yr
For passive investors: Depreciation is non-cash, so a rental often shows a tax loss while cash-flowing — sheltering income. Rental losses are passive: they offset passive income freely, and up to $25,000/yr can offset ordinary (W-2) income if you actively participate and your MAGI is under $100k (phasing out to $0 by $150k); unused losses carry forward. On sale, claimed depreciation is recaptured at up to 25%, and gains may owe capital-gains tax (a 1031 exchange can defer both). Figures are a year-1 estimate at your 24.0% rate — not tax advice; consult a CPA.
Schools (NCES district)
- District
- Springfield City School District
- NCES district ID
- 3904481
- Math proficiency
- 20% ▼ -16.00%
- Reading proficiency
- 27% ▼ -12.00%
- Median HH income
- $32,541
- Composite
- 19.12/100
- National rank
- #8834
- State rank
- #616 of 656 in OH
Livability — Springfield
- Score
- 56/100
- State rank
- #1108
- US rank
- #22551
Category grades
Schools grade is shown separately in the Schools card above.
Census & demographics
- Census place
- Springfield, OH
- County
- Clark County · 33,261 people
- City population
- 33,261
- Metro
- Springfield, OH
- Population (ZIP)
- 19,826
- Household income
- $43,819
- Rent vs Own
- Severe rent burden
- 950.0
Population outlook (Clark County) Hauer SSP2
- Today (2025)
- 130,703 people
- By 2030
- 126,952 · -2.9%
- By 2040
- 118,344 · -9.5%
- By 2050
- 109,590 · -16.2%
- By 2075
- 89,464 · -31.6%
- By 2100
- 68,810 · -47.4%
Race, ethnicity, and origin ACS 2023
- Neighborhood character
- Predominantly White (75%)
- Race & ethnicity
- White 75% Black 14% Two or more races 7% Hispanic / Latino 4%
- Common ancestry
- Slovak 1% German 1% Iranian 1%
- Foreign-born
- 2% · Canada
- Languages at home
- 96% English-only · Spanish 2% French/Haitian/Cajun 1% German/W. Germanic 1%
Political lean MEDSL · Clark
- 2024 margin
- Strong R (+29.5) · D 34.8% · R 64.3%
- 2008→2024 swing
- -27.0pp toward R · 2008: -2.5pp · 2024: -29.5pp
- All cycles
- 2024: R+29.5 2020: R+23.3 2016: R+19.5 2012: R+1.8 2008: R+2.5
Not yet ingested
- Civics
- —
Market trends
- HPI YoY
- ▼ -135.16%
- Current HPI
- 258.9037
- Rent YoY
- —
- Metro
- Springfield, OH
- State GDP YoY
- ▲ 1.98%
- F500 in state
- 48
Industry mix (Fortune 500 HQ in OH)
| Industry | F500 HQs | Revenue |
|---|---|---|
| Insurance | 3 | $145B |
|
||
| Industrial Machinery | 3 | $49B |
|
||
| Financial Services | 3 | $24B |
|
||
| Consumer Goods | 2 | $93B |
|
||
| Aerospace / Defense | 2 | $47B |
|
||
| Utilities | 2 | $33B |
|
||
Price history
-0.1% since first listed35 events — show timeline
- 2026-05-11 Listing Removed — WRIST
- 2026-04-07 Price Changed $129,900 Dayton MLS
- 2026-04-07 Price Changed $129,900 WRIST
- 2026-03-04 Listed $134,900 WRIST
- 2025-05-01 Rental Removed $1,500 Avail
- 2025-04-16 Listed for Rent $1,500 Avail
- 2025-04-15 Sold (Public Records) $100,000 Public Records
- 2025-04-10 Sold (MLS) $100,000 WRIST
- 2025-04-10 Sold (MLS) $100,000 CBRMLS
- 2025-04-10 Sold (MLS) $100,000 Dayton MLS
- 2025-03-24 Pending — CBRMLS
- 2025-03-24 Pending — Dayton MLS
- 2025-03-24 Pending — WRIST
- 2025-03-13 Contingent — CBRMLS
- 2025-03-13 Contingent — Dayton MLS
- 2025-03-13 Contingent — WRIST
- 2025-03-11 Price Changed $107,910 Dayton MLS
- 2025-03-11 Price Changed $107,910 WRIST
- 2025-02-20 Price Changed $109,000 CBRMLS
- 2025-02-20 Price Changed $109,000 WRIST
- 2025-02-20 Price Changed $109,000 Dayton MLS
- 2025-01-17 Relisted — CBRMLS
- 2025-01-17 Relisted — WRIST
- 2025-01-17 Relisted — Dayton MLS
- 2025-01-11 Contingent — CBRMLS
- 2025-01-11 Contingent — Dayton MLS
- 2025-01-11 Contingent — WRIST
- 2024-12-03 Price Changed $110,000 CBRMLS
- 2024-12-03 Listed $110,000 WRIST
- 2024-12-03 Listed $110 CBRMLS
- 2024-12-03 Listed $110,000 Dayton MLS
- 2024-12-02 Listing Removed — Dayton MLS
- 2024-12-02 Listing Removed — Cincy MLS
- 2024-10-15 Listed $130,000 Cincy MLS
- 2024-10-15 Listed $130,000 Dayton MLS
Property tax history
+36.8%/yrLatest (2025): $963 · +22.5% YoY. Source: county tax records.
Cash-flow waterfall
monthlySold comps — $/sqft
last 12 mo · ≤1 miLoading sold comps…