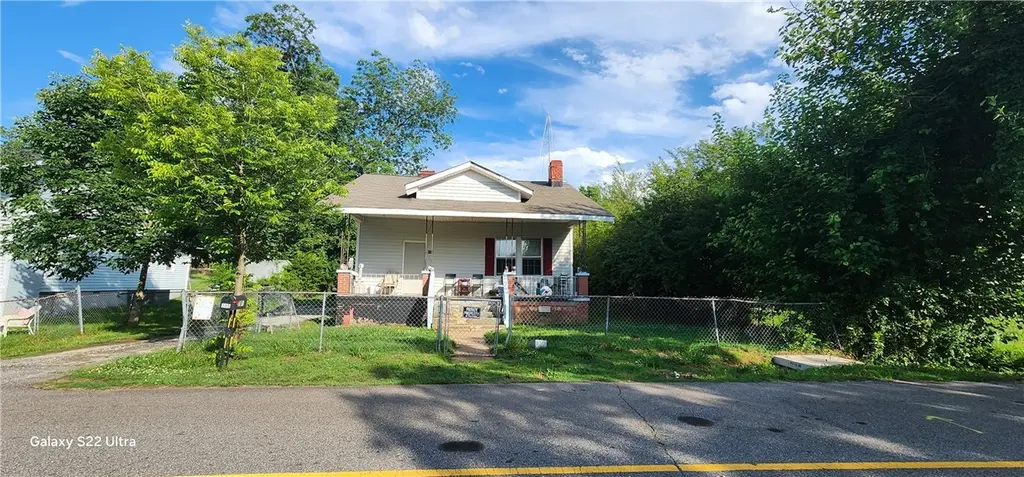
105 Hope Ave · Utica, SC
Flood risk 1/10 · Minimal
- FEMA flood zone
- X (unshaded)
- Chance of flooding over 30 yrs
- 0.0%
- Est. flood insurance / yr
- $507 – $1,088
Fire risk 4/10 · Minor
- Est. fire insurance / yr
- $783 – $1,453
Heat risk 5/10 · Moderate
- Hot days now (above 104°F)
- 7 days/yr
- Hot days in 30 yrs
- 17 days/yr
Wind risk 2/10 · Minimal
- Chance of severe wind over 30 yrs
- 1.0%
Air-quality risk 3/10 · Minor
- Unhealthy air days now
- 3 days/yr
- Unhealthy air days in 30 yrs
- 3 days/yr
Risk factors via First Street. Map © Google.
Why this score? — see what drove the B+ grade
The composite is a weighted blend of 9 inputs, each scored 0–100. Each bar is that input's sub-score; the figure is the points it added to the 100-point composite (weight × sub-score).
- Cash flow +30.0/30.0
- ARV discount +15.0/15.0
- DSCR +10.0/10.0
- 1% rule +9.7/10.0
- Rent growth +4.4/5.0
- Schools +3.7/10.0
- Livability +3.2/5.0
- Condition / age +2.5/5.0
- Appreciation +0.0/10.0
$125,000
🖨 Deal sheet 📄 Offer letter ✓ Due diligence
Listing remarks MLS
This is a well-built, spacious house with tremendous potential. It comes with a great porch for visiting with friends and family, a small amount of yard maintenance and a good location to town. It has carpet in some rooms as well as original hardwood floors and vinyl flooring.
Key facts
- 4 br rental
- Level 0.25 acre lot
- Utica subdivision
Tags
Property features AI
Finance
- HOA & community: Short-term rentals allowed
Exterior
- Parking: Driveway
- Utilities: Electricity available; Natural gas available; Public water; Public sewer
- Home design: 2 stories; Over 50 years old
- Construction: Vinyl siding; Architectural shingle roof; Crawlspace foundation
- Exterior features: Paved driveway; Front porch; Porch
Interior
- Kitchen: Electric oven; Electric range; Smooth cooktop; Refrigerator
- Bedrooms: 2 main-level bedrooms
- Bathrooms: 1 full bathroom on the main level
- Heating & cooling: Natural gas heating; Central electric cooling
- Interior features: Ceiling fan(s); High ceilings; Laminate countertops; Wood window frames
- Laundry & utility: Washer hookup
Neighborhood map
What this means for you Summary
Snapshot
- This is a 3-bed/2.0-bath single-family listed at $125k.
Deal economics
- At list price, monthly cash flow is $702 ($8k/yr) — positive.
- The deal already cash-flows at list — no discount required.
- Meets the 1% rule at list price ($2k rent vs $125k).
- Recommended offer: $123k (1.5% below list) — sets the bar for market timing.
- Cap rate 13.0% vs local median 2.6% in Utica — top-decile yield for the area; either an underpriced asset or a hidden risk that comps aren't pricing in. Stress-test before assuming the spread holds.
Location & tenants
- Location reads 64/100 on livability (#158 in SC) — a middle-class / working-renter tenant base. Strengths: cost of living A+, housing A+, crime A; Watch: schools F, amenities F, commute F.
- Oconee 01 (rural): math 41% / reading 47% proficiency, ranked #27 of 80 in SC (top 34%) — families likely to look elsewhere, expect single-tenant / working-renter base with shorter leases.
- Market conditions: Rents rising fast (+7.7%/yr); 367 active listings in the ZIP; 3 comparable units currently listed for rent nearby; rentals at typical pace (median 24d on market — plan ~3-4 weeks tenant-placement turnaround); 648 units permitted in Oconee County in 2024 (40 in 5+ unit buildings).
- This rent runs 42% of the median local income ($53k/yr) — at the standard rent-burdened threshold; future hikes will face affordability resistance.
Forward outlook
- Local home prices are declining (-3.0%/yr); year-one equity from $864 of loan paydown is wiped out by about $4k of value loss. Plan a longer hold.
- At projected returns (-3.0% appreciation + 7.7% rent growth), your $35k cash investment doubles in ~5 years — after that, you're playing with house money.
Negotiation context
- It's been on market 17 days — a 2% lower offer ($123k) is reasonable based on typical stale-listing flexibility.
- 2 sale attempts since 7y ago with the ask held roughly flat each time — persistent listings suggest the price (not the market) is what's stuck; bring a comps-based counter.
- Current owner paid $40k; list at $125k implies a 212% gain — meaningful room to come down on a strong offer.
Risks & watch-outs
- Watch-outs: built in 1938 — expect roof / HVAC / electrical / plumbing capex.
- Climate carrying-cost: extreme-heat days projected 7→17/yr by 2055 (HVAC capex compounding) — expect insurance premiums to compound above CPI over the hold.
Questions for the listing agent
- Built in 1938 — when were the roof, HVAC, electrical panel, plumbing, and water heater last replaced?
- Is there a deadline driving the sale (1031 exchange, divorce, estate, relocation)? That informs how much negotiation room exists.
- Schools are F-rated, which usually means shorter tenancies and higher turnover. Who's the typical renter profile here, and what's been the actual vacancy rate?
- What's the average days-on-market for RENTAL listings here right now (not sales)? A rising rental-DOM trend means longer vacancies and softer asking-rent achievability than the comps imply.
- What's the recent tenant-quality profile in this submarket — average credit score on applications, eviction rate, late-payment / NSF rate, and stable-employment percentage? A property-management company in the area should have these aggregated.
- How much new for-sale + rental construction is in the pipeline within 1–3 miles? Heavy new supply typically softens prices + rents 12–24 months out; constrained supply supports both.
Investment metrics
- 1% rule
- 1.47% ✓
- Cap rate
- 13.03%
- Cash-on-cash
- 24.05%
- DSCR
- 2.07
- GRM
- 5.7
CMA / ARV
- ARV (on-the-fly)
- $205,744
- Comps found
- 12
Show comp detail 12 sales within ~0.75 mi
| Address | Dist | Beds/Ba | Sqft | Sold | Price | $/sf | Match |
|---|---|---|---|---|---|---|---|
| 42 Sirrine St | 0.25mi | 3/1.0 | 1,187 (-4%) | 6mo | $185,000 | $156 | 73 |
| 2306 E Ashton St | 0.17mi | 3/1.0 | 1,188 (-4%) | 12mo | $100,000 | $84 | 72 |
| 313 Hunter St | 0.30mi | 2/1.0 (-1) | 1,200 (-3%) | 13mo | $130,000 | $108 | 61 |
| 273 Utica Bend Ct | 0.55mi | 3/2.0 | 1,321 (+7%) | 2mo | $275,000 | $208 | 61 |
| 405 Keith Ln | 0.64mi | 3/2.0 | 1,206 (-2%) | 7mo | $201,000 | $167 | 61 |
| 502 Keith Ln | 0.62mi | 3/2.0 | 1,288 (+4%) | 5mo | $256,000 | $199 | 60 |
| 602 S Stribling St | 0.42mi | 3/2.0 | 1,357 (+10%) | 11mo | $262,500 | $193 | 55 |
| 705 Sherwood Dr | 0.74mi | 2/1.0 (-1) | 1,218 (-1%) | 2mo | $217,500 | $179 | 53 |
| 513 Shiloh Rd | 0.68mi | 2/2.0 (-1) | 1,279 (+4%) | 10mo | $235,000 | $184 | 48 |
| 909 E South 2nd St | 0.60mi | 3/1.0 | 1,140 (-8%) | 11mo | $53,500 | $47 | 46 |
| 807 E South 2nd St | 0.71mi | 3/2.0 | 1,118 (-9%) | 14mo | $105,000 | $94 | 40 |
| 905 E South 2nd St | 0.63mi | 2/1.0 (-1) | 1,400 (+14%) | 6mo | $165,000 | $118 | 34 |
Match score weights: distance 35% · size 25% · config 20% · recency 20%. Top-matched comps best support the ARV.
Projected returns pro-forma
-3.0% appreciation · 7.71% rent growth · sell at horizon
- IRR
- 22.1%
- Equity multiple
- 1.96×
- Total profit
- $33,515
- Equity at exit
- $18,638
- IRR
- 32.9%
- Equity multiple
- 4.65×
- Total profit
- $127,844
- Equity at exit
- $10,808
Cash invested: $35,000 (down + closing). Projections, not guarantees.
Landlord ↔ Tenant lean methodology
- Overall (STATE)
- 90 Strongly Landlord-Friendly
- State South Carolina
- 90 Strongly Landlord-Friendly · R+6
- County
- — inherits STATE
- City
- — inherits STATE
ZIP-level market 29678
- Home prices YoY
- -32.5%
- Rents YoY
- 7.7%
- Active inventory
- 367
- Price-to-rent
- 5.7×
Monthly cashflow live
- Estimated rent
- $1,839 medium interval (Pro) →
- Mortgage (P&I)
- −$656
- Tax from tax record
- −$44 /mo · $522/yr
- Insurance
- −$52
- HOA
- −$0
- Vacancy / Maint / Mgmt
- −$386
- Net cashflow
- $702
Break-even live
UW: 25.0% down · 7.5% · 30yr · 1.5% tax · 5.0% vac · 8.0% maint · 8.0% mgmt
Financing live
Cash to close
- Down payment
- $31,250
- Closing costs
- $3,750
- Reserves months
- —
- Total cash needed
- —
Loan-product check · same deal, 3 products live
Conventional
25% down · 7.5% · 30yr
- Down + closing
- —
- Monthly P&I
- —
- Monthly cashflow
- —
- DSCR
- —
- Eligible?
- —
Personal DTI + credit; lowest rate.
DSCR
20% down · 8.5% · 30yr
- Down + closing
- —
- Monthly P&I
- —
- Monthly cashflow
- —
- DSCR
- —
- Eligible?
- —
No personal income docs; deal must DSCR.
Hard money
10% down · 12.0% · 12mo
- Down + closing
- —
- Monthly P&I
- —
- Monthly cashflow
- —
- DSCR
- —
- Eligible?
- —
Short-term bridge; refi at stabilization.
Rent comps 3 comps
| Address | Beds | Baths | Sqft | Rent | $/sqft | DOM | Units | Dist |
|---|---|---|---|---|---|---|---|---|
| 132 Wells Station Rd Seneca, SC | 3.0 | 2.0 | 1300 | $2,150 | $1.65 | 23d | 1 | 0.76mi |
| 511 Oakmont Valley Trl Unit 1 Seneca, SC | 3.0 | 3.0 | 1381 | $1,900 | $1.38 | 23d | 1 | 1.18mi |
| 804 Hunter Oaks Dr Seneca, SC | 2.0–3.0 | 2.0 | 1153 | $1,258 | $1.09 | 23d | 1 | 1.30mi |
Listing history 13 events
-
2026-06-18days on market $125,000 Active 17 DOM
-
2026-06-17days on market $125,000 Active 16 DOM
-
2026-06-16days on market $125,000 Active 15 DOM
-
2026-06-15days on market $125,000 Active 14 DOM
-
2026-06-13days on market $125,000 Active 12 DOM
-
2026-06-10days on market $125,000 Active 9 DOM
-
2026-06-09days on market $125,000 Active 8 DOM
-
2026-06-08days on market $125,000 Active 7 DOM
-
2026-06-07days on market $125,000 Active 6 DOM
-
2026-06-05days on market $125,000 Active 3 DOM
-
2026-06-03days on market $125,000 Active 2 DOM
-
2026-06-01remarks 689-char remark
-
2026-06-01$125,000 Active 1 DOM
ⓘ Source: listings_history table (triggers on properties + properties_extension) + one-shot
backfill from property_details.listing_events for pre-trigger history.
Tax reassessment forecast SC · Resets to sale price
- Current annual tax
- $522 · $44/mo
- Projected year-2 tax
- $712 · $59/mo
- Expected delta
- +$190/yr (+$16/mo · 36.4%)
ⓘ Screening estimate from a state-policy table — verify with the county assessor before closing.
Climate risk First Street
- Flood 1/10 Low FEMA zone X (unshaded) · 0% chance over 30 yrs
- Wildfire 4/10 Moderate
- Heat 5/10 Major 7 d/yr ≥104°F today · 17 d/yr by 30 yrs out
- Wind 2/10 Low 100% chance of damaging wind over 30 yrs
- Air quality 3/10 Moderate 3 unhealthy d/yr today · 3 by 30 yrs out
Nearby sold comps map
Loading sold comps map…
Walkable amenities ~0.75 mi
Loading nearby amenities…
Taxation est. · year 1
- Rental income
- $22,066
- − Mortgage interest
- −$7,002
- − Property taxes
- −$522
- − Insurance
- −$625
- − Repairs & maintenance
- −$1,765
- − Management
- −$1,765
- − Depreciation
- −$3,636
- Taxable income
- $6,750
- Est. tax owed @ 24.0%
- −$1,620
- After-tax cash flow
- $6,799/yr
For passive investors: Depreciation is non-cash, so a rental often shows a tax loss while cash-flowing — sheltering income. Rental losses are passive: they offset passive income freely, and up to $25,000/yr can offset ordinary (W-2) income if you actively participate and your MAGI is under $100k (phasing out to $0 by $150k); unused losses carry forward. On sale, claimed depreciation is recaptured at up to 25%, and gains may owe capital-gains tax (a 1031 exchange can defer both). Figures are a year-1 estimate at your 24.0% rate — not tax advice; consult a CPA.
Schools (NCES district)
- District
- Oconee 01
- NCES district ID
- 4503060
- Math proficiency
- 41% ▼ -7.00%
- Reading proficiency
- 47% ▼ -1.00%
- Median HH income
- $42,074
- Composite
- 37.03/100
- National rank
- #4516
- State rank
- #27 of 80 in SC
Livability — Utica
- Score
- 64/100
- State rank
- #158
- US rank
- #14701
Category grades
Schools grade is shown separately in the Schools card above.
Census & demographics
- Census place
- Utica, SC
- County
- Oconee County · 36,517 people
- Metro
- Seneca, SC
- Population (ZIP)
- 23,767
- Household income
- $52,550
- Rent vs Own
- Severe rent burden
- 822.0
Population outlook (Oconee County) Hauer SSP2
- Today (2025)
- 77,950 people
- By 2030
- 78,551 · +0.8%
- By 2040
- 78,628 · +0.9%
- By 2050
- 77,052 · -1.2%
- By 2075
- 71,098 · -8.8%
- By 2100
- 61,216 · -21.5%
Race, ethnicity, and origin ACS 2023
- Neighborhood character
- Predominantly White (74%)
- Race & ethnicity
- White 74% Black 18% Two or more races 5% Hispanic / Latino 4%
- Common ancestry
- Slovak 2% Lithuanian 2% Italian 2%
- Foreign-born
- 2% · Canada, United Kingdom
- Languages at home
- 97% English-only · Spanish 1% French/Haitian/Cajun 1%
Political lean MEDSL · Oconee
- 2024 margin
- Solid R (+51.5) · D 23.6% · R 75.2% · Other 1.2%
- 2008→2024 swing
- -14.0pp toward R · 2008: -37.5pp · 2024: -51.5pp
- All cycles
- 2024: R+51.5 2020: R+47.4 2016: R+48.1 2012: R+42.6 2008: R+37.5
Not yet ingested
- Civics
- —
Market trends
- HPI YoY
- ▼ -91.37%
- Current HPI
- 189.6751
- Rent YoY
- ▲ 7.71%
- Metro
- Seneca, SC
- State GDP YoY
- ▲ 4.51%
- F500 in state
- 2
Industry mix (Fortune 500 HQ in SC)
| Industry | F500 HQs | Revenue |
|---|---|---|
| Packaging | 1 | $7B |
|
||
Price history
+111.9% since first listed3 events — show timeline
- 2026-06-01 Listed $125,000 WUMLS
- 2019-10-30 Sold (MLS) $40,000 WUMLS
- 2019-09-16 Listed $59,000 WUMLS
Property tax history
+10.9%/yrLatest (2025): $522 · +0.0% YoY. Source: county tax records.
Cash-flow waterfall
monthlySold comps — $/sqft
last 12 mo · ≤1 miLoading sold comps…