 Duplex
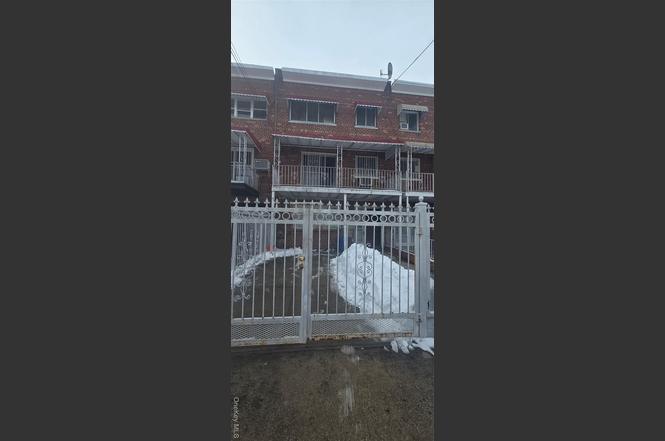
405 Saint Lawrence Ave · New York, NY
Flood risk 7/10 · Major
- FEMA flood zone
- X (shaded)
- Chance of flooding over 30 yrs
- 0.76%
- Est. flood insurance / yr
- $507 – $1,088
Fire risk 2/10 · Minimal
- Est. fire insurance / yr
- $691 – $1,283
Heat risk 6/10 · Moderate
- Hot days now (above 99°F)
- 7 days/yr
- Hot days in 30 yrs
- 14 days/yr
Wind risk 6/10 · Moderate
- Chance of severe wind over 30 yrs
- 27.0%
Air-quality risk 4/10 · Minor
- Unhealthy air days now
- 5 days/yr
- Unhealthy air days in 30 yrs
- 6 days/yr
Risk factors via First Street. Map © Google.
Why this score? — see what drove the D+ grade
The composite is a weighted blend of 9 inputs, each scored 0–100. Each bar is that input's sub-score; the figure is the points it added to the 100-point composite (weight × sub-score).
- Cash flow +14.1/30.0
- ARV discount +11.5/15.0
- Schools +5.0/10.0
- DSCR +4.3/10.0
- Livability +3.8/5.0
- 1% rule +3.2/10.0
- Rent growth +2.5/5.0
- Condition / age +2.5/5.0
- Appreciation +0.0/10.0
$825,000
🖨 Deal sheet (PDF) 📄 Offer letter ✓ Due diligence
Multi-family units
County records classify this as Multi-Family (2-4 Unit). Listing-text estimate: 2 units. confirmed
Listing remarks
Great opportunity to Own a large 2 Family Brick construction in the Soundview Area of the Bronx. Features 3 Large Bedroom apartment and 2 Bedrooms apartment finished walk- in basement, recreation room. Hardwood floors. Gas heat, Driveway. Convenient to all major transportation.
Key facts
- Recreation room
- Driveway
- Gas heat
Tags
Neighborhood map
What this means for you Summary
Snapshot
- This is a 2 × 2-bed/1.0-bath units multifamily listed at $825k.
Deal economics
- At list price, monthly cash flow is $59 ($703/yr) — positive. Per door: $29/mo.
- The deal already cash-flows at list — no discount required.
- To meet the 1% rule (rent ≥ 1% of price), the offer needs to be $673k (18.4% below list).
- Recommended offer: $673k (18.4% below list) — sets the bar for 1% rule.
- Cap rate 6.5% vs local median 2.6% in New York — top-decile yield for the area; either an underpriced asset or a hidden risk that comps aren't pricing in. Stress-test before assuming the spread holds.
Location & tenants
- Location reads 75/100 on livability (#268 in NY, #4,188 nationally) — a middle-class / working-renter tenant base. Strengths: amenities A+, commute A+, health & safety A; Watch: crime F, cost of living F.
- Zoned schools: Elm Tree Elementary School (math 27% / reading 52%, grade F, #1,444 of 2,108 statewide, top 71%, 806 students, 94% FRL); Jhs 383 Philippa Schuyler (math 32% / reading 67%, grade C, #280 of 729 statewide, top 40%, 822 students, 85% FRL); Midwood High School (math 94% / reading 96%, grade A+, #83 of 1,100 statewide, top 8%, 4,062 students, 73% FRL).
- Market conditions: 141 active listings in the ZIP; 6,929 units permitted in Bronx County in 2024 (6,829 in 5+ unit buildings).
- At $6,728/mo this rent would consume 154% of the median local household income ($52k/yr) (locally 3913% of renters already pay >50% of income on rent) — very limited rent-growth headroom before tenants either downsize or default.
Forward outlook
- Local home prices are declining (-3.0%/yr); year-one equity from $6k of loan paydown is wiped out by about $25k of value loss. Plan a longer hold.
- Bronx County population projected at +21% by 2050 — long-run rental-demand tailwind backs the buy-and-hold thesis.
Negotiation context
- Only 9 days on market — expect competitive offers; lowballing is unlikely to land.
- Current owner paid $200k; list at $825k implies a 312% gain — meaningful room to come down on a strong offer.
Risks & watch-outs
- Watch-outs: flood insurance adds $66/mo.
- Climate carrying-cost: major flood risk; major wind risk, 27% chance of damaging wind over 30y; extreme-heat days projected 7→14/yr by 2055 (HVAC capex compounding) — expect insurance premiums to compound above CPI over the hold.
Questions for the listing agent
- Can we see the unit-by-unit rent roll, current vacancy, and any below-market leases? What's the average tenancy length?
- What capital expenditures (roof, boiler, parking lot, exteriors) have been made in the last 5 years, and what's planned in the next 2?
- Built in 1975 — when were the roof, HVAC, electrical panel, plumbing, and water heater last replaced?
- What's the actual annual flood-insurance premium (NFIP or private), and is the property in a SFHA with mandatory coverage?
- Is there a deadline driving the sale (1031 exchange, divorce, estate, relocation)? That informs how much negotiation room exists.
- Schools are B-rated — typically a magnet for longer-tenancy family renters. What's the average tenant stay here, and is there a school-zone premium baked into asking?
- Crime grade is F in this area — have there been break-ins, vandalism, or insurance claims at this property in the last 3 years? What carrier currently insures it and at what premium?
- The area grade is low — what's the realistic commute time and amenity access for the typical tenant pool here? Any planned neighborhood developments (good or bad) we should know about?
- What's the average days-on-market for RENTAL listings here right now (not sales)? A rising rental-DOM trend means longer vacancies and softer asking-rent achievability than the comps imply.
- What's the recent tenant-quality profile in this submarket — average credit score on applications, eviction rate, late-payment / NSF rate, and stable-employment percentage? A property-management company in the area should have these aggregated.
- How much new apartment / multifamily construction is in the pipeline within 1–3 miles? Heavy new supply (>2% of stock underway) typically softens rents 12–24 months out; light construction supports rent growth.
Investment metrics
- 1% rule
- 0.82% ✗
- Cap rate
- 6.47%
- Cash-on-cash
- 0.65%
- DSCR
- 1.03
- GRM
- 10.2
CMA / ARV
- ARV (on-the-fly)
- $906,300
- Comps found
- 12
Show comp detail 12 sales within ~0.75 mi
| Address | Dist | Beds/Ba | Sqft | Sold | Price | $/sf | Match |
|---|---|---|---|---|---|---|---|
| 1815 Patterson Ave | 0.09mi | 5/2.0 (+1) | 2,625 (-1%) | 2mo | $752,200 | $287 | 87 |
| 535 Saint Lawrence Ave | 0.20mi | 3/— (-1) | 2,760 (+4%) | 10mo | $999,000 | $362 | 70 |
| 643 Underhill Ave | 0.44mi | 3/3.0 (-1) | 2,748 (+4%) | 6mo | $855,000 | $311 | 60 |
| 622 Saint Lawrence Ave | 0.33mi | 5/— (+1) | 2,540 (-4%) | 21mo | $765,000 | $301 | 55 |
| 1894 Seward Ave | 0.51mi | 5/3.0 (+1) | 2,748 (+4%) | 8mo | $850,000 | $309 | 55 |
| 250 Newman Ave | 0.48mi | 5/3.0 (+1) | 2,470 (-7%) | 7mo | $860,000 | $348 | 52 |
| 203 White Plains Rd | 0.46mi | 5/4.0 (+1) | 2,380 (-10%) | 0mo | $814,000 | $342 | 48 |
| 536 Pugsley Ave | 0.58mi | 5/3.0 (+1) | 2,325 (-12%) | 12mo | $685,000 | $295 | 34 |
| 2037 Cicero Ave | 0.63mi | 5/4.0 (+1) | 2,325 (-12%) | 5mo | $805,000 | $346 | 33 |
| 2049 Caesar Pl | 0.66mi | 5/4.0 (+1) | 2,325 (-12%) | 8mo | $612,850 | $264 | 29 |
| 2096 Randall Ave | 0.71mi | 5/5.0 (+1) | 2,325 (-12%) | 4mo | $915,000 | $394 | 26 |
| 2026 Caesar Pl | 0.62mi | 5/5.0 (+1) | 2,325 (-12%) | 14mo | $800,000 | $344 | 22 |
Match score weights: distance 35% · size 25% · config 20% · recency 20%. Top-matched comps best support the ARV.
Projected returns pro-forma
-3.0% appreciation · 3.0% rent growth · sell at horizon
- IRR
- -15.8%
- Equity multiple
- 0.44×
- Total profit
- $-130,126
- Equity at exit
- $123,010
- IRR
- -7.5%
- Equity multiple
- 0.53×
- Total profit
- $-109,204
- Equity at exit
- $71,331
Cash invested: $231,000 (down + closing). Projections, not guarantees.
Landlord ↔ Tenant lean methodology
- Overall (CITY)
- 0 Strongly Tenant-Friendly
- State New York
- 15 Strongly Tenant-Friendly · D+10
- County
- — inherits STATE
- City New York
- 0 Strongly Tenant-Friendly · D+34
ZIP-level market 10473
- Active inventory
- 141
- Price-to-rent
- 20.4×
Monthly cashflow live
- Estimated rent
- $6,728 medium interval (Pro) →
- Mortgage (P&I)
- −$4,326
- Tax from tax record
- −$520 /mo · $6,239/yr
- Insurance
- −$344
- Flood insurance flood zone
- −$66 /mo · $798/yr
- HOA
- −$0
- Vacancy / Maint / Mgmt
- −$1,413
- Net cashflow
- $59
Break-even live
Sensitivity live
| Price | -10% $526 | -5% $292 | +0% $59 | +5% $-175 | +10% $-408 |
|---|---|---|---|---|---|
| Rent | -10% $-473 | -5% $-207 | +0% $59 | +5% $324 | +10% $590 |
| Rate | -1.0pp $474 | -0.5pp $268 | base $59 | +0.5pp $-155 | +1.0pp $-373 |
2-unit breakdown (identical units grouped — click to expand)
| Units | Beds | Baths | Est. rent |
|---|---|---|---|
| 2× units | 2 | 1 | $6,728 |
| #1 | 2 | 1 | $3,364 |
| #2 | 2 | 1 | $3,364 |
| Total (2 units) | $6,728 | ||
UW: 25.0% down · 7.5% · 30yr · 1.5% tax · 5.0% vac · 8.0% maint · 8.0% mgmt
Financing live
Cash to close
- Down payment
- $206,250
- Closing costs
- $24,750
- Reserves months
- —
- Total cash needed
- —
Loan-product check · same deal, 3 products live
Conventional
25% down · 7.5% · 30yr
- Down + closing
- —
- Monthly P&I
- —
- Monthly cashflow
- —
- DSCR
- —
- Eligible?
- —
Personal DTI + credit; lowest rate.
DSCR
20% down · 8.5% · 30yr
- Down + closing
- —
- Monthly P&I
- —
- Monthly cashflow
- —
- DSCR
- —
- Eligible?
- —
No personal income docs; deal must DSCR.
Hard money
10% down · 12.0% · 12mo
- Down + closing
- —
- Monthly P&I
- —
- Monthly cashflow
- —
- DSCR
- —
- Eligible?
- —
Short-term bridge; refi at stabilization.
Listing history 3 events
-
2026-02-05status Pending
-
2026-01-27$825,000 Active
-
1993-12-09soldstatus $200,000
ⓘ Source: listings_history table (triggers on properties + properties_extension) + one-shot
backfill from property_details.listing_events for pre-trigger history.
Tax reassessment forecast NY · Partial reset (capped growth)
- Current annual tax
- $6,239 · $520/mo
- Projected year-2 tax
- $10,091 · $841/mo
- Expected delta
- +$3,852/yr (+$321/mo · 61.7%)
ⓘ Screening estimate from a state-policy table — verify with the county assessor before closing.
Climate risk First Street
- Flood 7/10 Severe FEMA zone X (shaded) · 76% chance over 30 yrs
- Wildfire 2/10 Low
- Heat 6/10 Major 7 d/yr ≥99°F today · 14 d/yr by 30 yrs out
- Wind 6/10 Major 27% chance of damaging wind over 30 yrs
- Air quality 4/10 Moderate 5 unhealthy d/yr today · 6 by 30 yrs out
Nearby sold comps map
Loading sold comps map…
Walkable amenities ~0.75 mi
Loading nearby amenities…
Taxation est. · year 1
- Rental income
- $80,736
- − Mortgage interest
- −$46,213
- − Property taxes
- −$6,239
- − Insurance
- −$4,922
- − Repairs & maintenance
- −$6,459
- − Management
- −$6,459
- − Depreciation
- −$24,000
- Taxable loss
- −$13,556
- Est. tax savings @ 24.0%
- +$3,254
- After-tax cash flow
- $3,957/yr
For passive investors: Depreciation is non-cash, so a rental often shows a tax loss while cash-flowing — sheltering income. Rental losses are passive: they offset passive income freely, and up to $25,000/yr can offset ordinary (W-2) income if you actively participate and your MAGI is under $100k (phasing out to $0 by $150k); unused losses carry forward. On sale, claimed depreciation is recaptured at up to 25%, and gains may owe capital-gains tax (a 1031 exchange can defer both). Figures are a year-1 estimate at your 24.0% rate — not tax advice; consult a CPA.
Schools (NCES district)
No district data.
Livability — New York
- Score
- 75/100
- State rank
- #268
- US rank
- #4188
Category grades
Schools grade is shown separately in the Schools card above.
Census & demographics
- Census place
- New York, NY
- County
- Bronx County · 1,197,324 people
- City population
- 7,731,280
- Metro
- New York-Newark-Jersey City, NY-NJ-PA
- Population (ZIP)
- 58,855
- Household income
- $52,462
- Rent vs Own
- Severe rent burden
- 3913.0
Population outlook (Bronx County) Hauer SSP2
- Today (2025)
- 1,607,353 people
- By 2030
- 1,681,852 · +4.6%
- By 2040
- 1,824,421 · +13.5%
- By 2050
- 1,945,470 · +21.0%
- By 2075
- 2,187,887 · +36.1%
- By 2100
- 2,244,136 · +39.6%
Race, ethnicity, and origin ACS 2023
- Neighborhood character
- Majority Hispanic (59%)
- Race & ethnicity
- Hispanic / Latino 59% Black 34% Two or more races 12% Asian 2% White 2%
- Hispanic origin (detail)
- Puerto Rican 31% Dominican 20%
- Common ancestry
- British 1%
- Foreign-born
- 23% · Canada, Jamaica
- Languages at home
- 51% English-only · Spanish 45% Other Indo-European 1% French/Haitian/Cajun 1%
Political lean MEDSL · Bronx
- 2024 margin
- Solid D (+45.4) · D 72.7% · R 27.3%
- 2008→2024 swing
- -32.3pp toward R · 2008: 77.8pp · 2024: 45.4pp
- All cycles
- 2024: D+45.4 2020: D+67.6 2016: D+79.1 2012: D+82.9 2008: D+77.8
Not yet ingested
- Civics
- —
Market trends
- HPI YoY
- ▼ -212.70%
- Current HPI
- 276.2941
- Rent YoY
- —
- Metro
- New York-Newark-Jersey City, NY-NJ-PA
- State GDP YoY
- ▲ 2.60%
- F500 in state
- 92
Industry mix (Fortune 500 HQ in NY)
| Industry | F500 HQs | Revenue |
|---|---|---|
| Financial Services | 10 | $950B |
|
||
| Consumer Goods | 9 | $162B |
|
||
| Insurance | 4 | $225B |
|
||
| Telecommunications | 2 | $144B |
|
||
| Pharmaceuticals | 2 | $112B |
|
||
| Media / Entertainment | 2 | $69B |
|
||
Price history
+312.5% since first listed3 events — show timeline
- 2026-02-05 Pending — OneKey® MLS as Distributed by MLS Grid
- 2026-01-27 Listed $825,000 OneKey® MLS as Distributed by MLS Grid
- 1993-12-09 Sold (Public Records) $200,000 Public Records
Property tax history
+2.4%/yrLatest (2025): $6,239 · +6.0% YoY. Source: county tax records.
Cash-flow waterfall
monthlySold comps — $/sqft
last 12 mo · ≤1 miLoading sold comps…