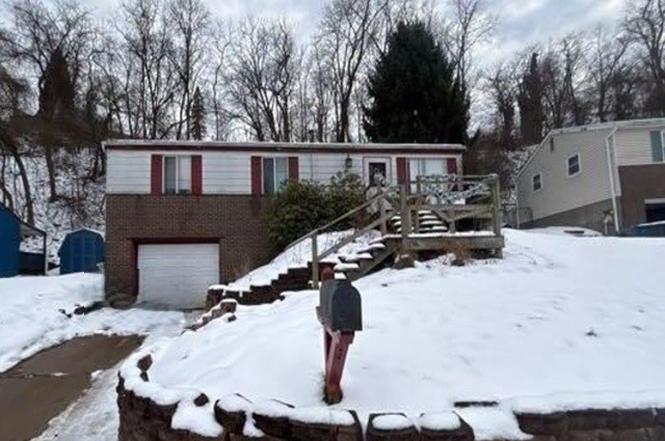
268 Hazel Rd · Monroeville, PA
Flood risk 1/10 · Minimal
- FEMA flood zone
- X (unshaded)
- Chance of flooding over 30 yrs
- 0.0%
- Est. flood insurance / yr
- $473 – $860
Fire risk 1/10 · Minimal
- Est. fire insurance / yr
- $511 – $949
Heat risk 3/10 · Minor
- Hot days now (above 96°F)
- 7 days/yr
- Hot days in 30 yrs
- 17 days/yr
Wind risk 2/10 · Minimal
- Chance of severe wind over 30 yrs
- —
Air-quality risk 4/10 · Minor
- Unhealthy air days now
- 5 days/yr
- Unhealthy air days in 30 yrs
- 7 days/yr
Risk factors via First Street. Map © Google.
Why this score? — see what drove the B+ grade
The composite is a weighted blend of 9 inputs, each scored 0–100. Each bar is that input's sub-score; the figure is the points it added to the 100-point composite (weight × sub-score).
- Cash flow +30.0/30.0
- ARV discount +15.0/15.0
- 1% rule +10.0/10.0
- DSCR +10.0/10.0
- Rent growth +4.4/5.0
- Livability +3.9/5.0
- Condition / age +2.5/5.0
- Schools +1.6/10.0
- Appreciation +0.0/10.0
$79,500
🖨 Deal sheet 📄 Offer letter ✓ Due diligence
Listing remarks MLS
Very nice ranch with lg bedrooms. Finished basement. Property is located on a very nice lot. .. .MUST SEE! Alternate numbers for occupant is 412-287-8562 and 412-824-6080
Key facts
- 0.86 acre lot
- Garage
- Built 1965
Neighborhood map
What this means for you Summary
Snapshot
- This is a 3-bed/1.0-bath single-family listed at $80k.
Deal economics
- At list price, monthly cash flow is $548 ($7k/yr) — positive.
- The deal already cash-flows at list — no discount required.
- Meets the 1% rule at list price ($2k rent vs $80k).
- Recommended offer: $75k (6.0% below list) — sets the bar for market timing.
Location & tenants
- Location reads 77/100 on livability (#358 in PA, #3,140 nationally) — a middle-class / working-renter tenant base. Strengths: schools A+, cost of living A+, housing A+; Watch: health & safety D+, amenities F, commute F.
- Penn Hills SD (suburban): math 13% / reading 24% proficiency, ranked #496 of 539 in PA (top 92%) — low school quality limits family demand, transient renter base, plan for 1-2y turnover.
- Market conditions: Rents rising fast (+7.6%/yr); 129 active listings in the ZIP; 16 comparable units currently listed for rent nearby; rentals at typical pace (median 21d on market — plan ~3-4 weeks tenant-placement turnaround); 2,996 units permitted in Allegheny County in 2024 (1,588 in 5+ unit buildings).
Forward outlook
- Local home prices are declining (-3.0%/yr); year-one equity from $550 of loan paydown is wiped out by about $2k of value loss. Plan a longer hold.
- At projected returns (-3.0% appreciation + 7.6% rent growth), your $22k cash investment doubles in ~4 years — after that, you're playing with house money.
Negotiation context
- It's been on market 85 days — a 6% lower offer ($75k) is reasonable based on typical stale-listing flexibility.
- 2 sale attempts since 20y ago; this cycle's ask has dropped $48k (38%) from the opening price — seller is motivated, your offer sets the floor, not the list.
- Current owner paid $62k; 28% above their basis — modest negotiation headroom, anchor on the comps not their cost.
Risks & watch-outs
- Watch-outs: property tax is 3.3% of price.
Questions for the listing agent
- It's been on market 85 days. Have you received any prior offers? Is the seller open to a 6% concession, seller financing, or rate buy-down credit?
- Built in 1965 — when were the roof, HVAC, electrical panel, plumbing, and water heater last replaced?
- Property tax is high relative to price — has the assessment been appealed recently, and will the sale trigger a re-assessment?
- Why hasn't it sold? Are there any deal-killer items the seller is aware of (foundation, flood, title, zoning, code violations)?
- Is there a deadline driving the sale (1031 exchange, divorce, estate, relocation)? That informs how much negotiation room exists.
- Schools are A-rated — typically a magnet for longer-tenancy family renters. What's the average tenant stay here, and is there a school-zone premium baked into asking?
- What's the average days-on-market for RENTAL listings here right now (not sales)? A rising rental-DOM trend means longer vacancies and softer asking-rent achievability than the comps imply.
- What's the recent tenant-quality profile in this submarket — average credit score on applications, eviction rate, late-payment / NSF rate, and stable-employment percentage? A property-management company in the area should have these aggregated.
- How much new for-sale + rental construction is in the pipeline within 1–3 miles? Heavy new supply typically softens prices + rents 12–24 months out; constrained supply supports both.
Investment metrics
- 1% rule
- 1.94% ✓
- Cap rate
- 14.56%
- Cash-on-cash
- 29.52%
- DSCR
- 2.31
- GRM
- 4.3
CMA / ARV
- ARV (on-the-fly)
- $141,696
- Comps found
- 12
Show comp detail 12 sales within ~0.75 mi
| Address | Dist | Beds/Ba | Sqft | Sold | Price | $/sf | Match |
|---|---|---|---|---|---|---|---|
| 117 Clay Dr | 0.21mi | 3/2.0 | 1,163 (+5%) | 2mo | $194,000 | $167 | 76 |
| 105 Clay Dr | 0.21mi | 3/2.0 | 1,080 (-2%) | 7mo | $92,500 | $86 | 76 |
| 230 Idlewood Rd | 0.37mi | 2/1.5 (-1) | 1,062 (-4%) | 2mo | $135,000 | $127 | 67 |
| 833 Macbeth Dr | 0.08mi | 3/2.0 | 1,250 (+13%) | 8mo | $235,000 | $188 | 64 |
| 951 Universal Rd | 0.22mi | 3/1.0 | 941 (-15%) | 4mo | $105,000 | $112 | 62 |
| 1243 Universal Rd | 0.57mi | 3/1.5 | 1,163 (+5%) | 2mo | $149,000 | $128 | 61 |
| 131 S Joslyn Dr | 0.53mi | 3/1.0 | 988 (-11%) | 2mo | $88,000 | $89 | 56 |
| 129 Windsor Dr | 0.46mi | 3/1.0 | 992 (-10%) | 7mo | $84,000 | $85 | 55 |
| 388 Collins Dr | 0.45mi | 3/1.5 | 972 (-12%) | 3mo | $155,000 | $159 | 55 |
| 1160 Jefferson Rd | 0.73mi | 2/1.0 (-1) | 1,066 (-4%) | 3mo | $65,000 | $61 | 52 |
| 393 Collins Dr | 0.43mi | 3/3.0 | 1,238 (+12%) | 5mo | $182,000 | $147 | 48 |
| 129 Ange Dr | 0.64mi | 4/2.0 (+1) | 1,200 (+8%) | 0mo | $193,750 | $161 | 47 |
Match score weights: distance 35% · size 25% · config 20% · recency 20%. Top-matched comps best support the ARV.
Projected returns pro-forma
-3.0% appreciation · 7.63% rent growth · sell at horizon
- IRR
- 29.7%
- Equity multiple
- 2.33×
- Total profit
- $29,594
- Equity at exit
- $11,854
- IRR
- 39.9%
- Equity multiple
- 5.72×
- Total profit
- $104,957
- Equity at exit
- $6,874
Cash invested: $22,260 (down + closing). Projections, not guarantees.
Landlord ↔ Tenant lean methodology
- Overall (STATE)
- 62 Landlord-Friendly
- State Pennsylvania
- 62 Landlord-Friendly · EVEN
- County
- — inherits STATE
- City
- — inherits STATE
ZIP-level market 15235
- Home prices YoY
- -34.1%
- Rents YoY
- 7.6%
- Active inventory
- 129
- Price-to-rent
- 4.3×
Monthly cashflow live
- Estimated rent
- $1,539 high interval (Pro) →
- Mortgage (P&I)
- −$417
- Tax from tax record
- −$218 /mo · $2,617/yr
- Insurance
- −$33
- HOA
- −$0
- Vacancy / Maint / Mgmt
- −$323
- Net cashflow
- $548
Break-even live
UW: 25.0% down · 7.5% · 30yr · 1.5% tax · 5.0% vac · 8.0% maint · 8.0% mgmt
Financing live
Cash to close
- Down payment
- $19,875
- Closing costs
- $2,385
- Reserves months
- —
- Total cash needed
- —
Loan-product check · same deal, 3 products live
Conventional
25% down · 7.5% · 30yr
- Down + closing
- —
- Monthly P&I
- —
- Monthly cashflow
- —
- DSCR
- —
- Eligible?
- —
Personal DTI + credit; lowest rate.
DSCR
20% down · 8.5% · 30yr
- Down + closing
- —
- Monthly P&I
- —
- Monthly cashflow
- —
- DSCR
- —
- Eligible?
- —
No personal income docs; deal must DSCR.
Hard money
10% down · 12.0% · 12mo
- Down + closing
- —
- Monthly P&I
- —
- Monthly cashflow
- —
- DSCR
- —
- Eligible?
- —
Short-term bridge; refi at stabilization.
Rent comps 16 comps
| Address | Beds | Baths | Sqft | Rent | $/sqft | DOM | Units | Dist |
|---|---|---|---|---|---|---|---|---|
| 279 Hazel Rd Pittsburgh, PA | 3.0 | 1.0 | 1080 | $1,732 | $1.60 | 43d | 1 | 0.06mi |
| 753 Jefferson Rd Pittsburgh, PA | 4.0 | 1.0 | 1152 | $1,350 | $1.17 | 4d | 1 | 0.25mi |
| 717 Jefferson Rd Pittsburgh, PA | 3.0 | 1.0 | 1152 | $1,295 | $1.12 | 14d | 1 | 0.28mi |
| 325 Poe Dr Pittsburgh, PA | 2.0 | 1.0 | 1056 | $1,599 | $1.51 | 43d | 1 | 0.44mi |
| 154 Collins Dr Pittsburgh, PA | 3.0 | 1.0 | 986 | $1,295 | $1.31 | 2d | 1 | 0.45mi |
| 127 Stowe Dr Pittsburgh, PA | 3.0 | 1.0 | 948 | $1,495 | $1.58 | 21d | 1 | 0.45mi |
| 261 Universal Rd Unit 261UNIV Pittsburgh, PA | 3.0 | 1.0 | 1100 | $1,225 | $1.11 | 3d | 1 | 0.65mi |
| 98 Stotler Rd Penn Hills, PA | 2.0–3.0 | 1.0 | 1660 | $1,400 | $0.84 | 7d | 3 | 0.66mi |
| 1160 Jefferson Rd Pittsburgh, PA | 3.0 | 1.0 | 1066 | $1,295 | $1.21 | 14d | 1 | 0.70mi |
| 175 Charleston Dr Pittsburgh, PA | 3.0 | 2.0 | 1163 | $1,799 | $1.55 | 23d | 1 | 0.76mi |
| 3910 Old William Penn Hwy Penn Hills, PA | 2.0 | 1.0–2.0 | 750 | $1,175 | $1.57 | 2d | 3 | 0.94mi |
| 409 Nike Dr Pittsburgh, PA | 2.0 | 1.0 | 1225 | $1,325 | $1.08 | 23d | 1 | 1.08mi |
| 11843 Joan Dr Pittsburgh, PA | 3.0 | 1.0 | 1144 | $1,500 | $1.31 | 4d | 1 | 1.15mi |
| 213 Tilford Rd Pittsburgh, PA | 4.0 | 1.5 | 1000 | $1,640 | $1.64 | 43d | 1 | 1.46mi |
| 150 Marshall Dr Pittsburgh, PA | 3.0 | 1.5 | 923 | $1,450 | $1.57 | 23d | 1 | 1.46mi |
| 124 Dauntless Dr Pittsburgh, PA | 3.0 | 1.0 | 1100 | $1,395 | $1.27 | 23d | 1 | 1.48mi |
Listing history 9 events
-
2026-04-15status Pending
-
2026-03-17price $79,500
-
2026-02-27price $89,500
-
2026-02-11price $105,200
-
2026-01-20$127,200 Active
-
2006-04-17soldstatus $62,000 171-char remark
Show marketing remark (171 chars)
Very nice ranch with lg bedrooms. Finished basement. Property is located on a very nice lot. .. .MUST SEE! Alternate numbers for occupant is 412-287-8562 and 412-824-6080
-
2006-04-17soldstatus $62,000
Show marketing remark (171 chars)
Very nice ranch with lg bedrooms. Finished basement. Property is located on a very nice lot. .. .MUST SEE! Alternate numbers for occupant is 412-287-8562 and 412-824-6080
-
2006-03-01$65,000 171-char remark
Show marketing remark (171 chars)
Very nice ranch with lg bedrooms. Finished basement. Property is located on a very nice lot. .. .MUST SEE! Alternate numbers for occupant is 412-287-8562 and 412-824-6080
-
1986-03-13soldstatus $32,000
ⓘ Source: listings_history table (triggers on properties + properties_extension) + one-shot
backfill from property_details.listing_events for pre-trigger history.
Tax reassessment forecast PA · Partial reset (capped growth)
- Current annual tax
- $2,617 · $218/mo
- Projected year-2 tax
- $2,617 · $218/mo
- Expected delta
- $0/yr ($0/mo · 0.0%)
ⓘ Screening estimate from a state-policy table — verify with the county assessor before closing.
Climate risk First Street
- Flood 1/10 Low FEMA zone X (unshaded) · 0% chance over 30 yrs
- Wildfire 1/10 Low
- Heat 3/10 Moderate 7 d/yr ≥96°F today · 17 d/yr by 30 yrs out
- Wind 2/10 Low
- Air quality 4/10 Moderate 5 unhealthy d/yr today · 7 by 30 yrs out
Nearby sold comps map
Loading sold comps map…
Walkable amenities ~0.75 mi
Loading nearby amenities…
Taxation est. · year 1
- Rental income
- $18,467
- − Mortgage interest
- −$4,453
- − Property taxes
- −$2,617
- − Insurance
- −$398
- − Repairs & maintenance
- −$1,477
- − Management
- −$1,477
- − Depreciation
- −$2,313
- Taxable income
- $5,731
- Est. tax owed @ 24.0%
- −$1,376
- After-tax cash flow
- $5,196/yr
For passive investors: Depreciation is non-cash, so a rental often shows a tax loss while cash-flowing — sheltering income. Rental losses are passive: they offset passive income freely, and up to $25,000/yr can offset ordinary (W-2) income if you actively participate and your MAGI is under $100k (phasing out to $0 by $150k); unused losses carry forward. On sale, claimed depreciation is recaptured at up to 25%, and gains may owe capital-gains tax (a 1031 exchange can defer both). Figures are a year-1 estimate at your 24.0% rate — not tax advice; consult a CPA.
Schools (NCES district)
- District
- Penn Hills SD
- NCES district ID
- 4218590
- Math proficiency
- 13% ▼ -6.00%
- Reading proficiency
- 24% ▼ -14.00%
- Median HH income
- $47,794
- Composite
- 16.42/100
- National rank
- #9192
- State rank
- #496 of 539 in PA
Livability — Monroeville
- Score
- 77/100
- State rank
- #358
- US rank
- #3140
Category grades
Schools grade is shown separately in the Schools card above.
Census & demographics
- County
- Allegheny County · 1,022,028 people
- City population
- 28,332
- Metro
- Pittsburgh, PA
- Population (ZIP)
- 33,951
- Household income
- $67,240
- Rent vs Own
- Severe rent burden
- 955.0
Population outlook (Allegheny County) Hauer SSP2
- Today (2025)
- 1,250,282 people
- By 2030
- 1,256,482 · +0.5%
- By 2040
- 1,256,318 · +0.5%
- By 2050
- 1,244,169 · -0.5%
- By 2075
- 1,197,693 · -4.2%
- By 2100
- 1,093,187 · -12.6%
Race, ethnicity, and origin ACS 2023
- Neighborhood character
- Diverse neighborhood (Simpson 0.58)
- Race & ethnicity
- White 51% Black 40% Two or more races 7% Hispanic / Latino 2%
- Common ancestry
- Romanian 5% Serbian 2% Slovak 1%
- Foreign-born
- 4% · Canada
- Languages at home
- 97% English-only · Other Indo-European 1% Spanish 1%
Political lean MEDSL · Allegheny
- 2024 margin
- Strong D (+20.3) · D 59.7% · R 39.4%
- 2008→2024 swing
- +4.8pp toward D · 2008: 15.5pp · 2024: 20.3pp
- All cycles
- 2024: D+20.3 2020: D+20.4 2016: D+16.4 2012: D+14.4 2008: D+15.5
Not yet ingested
- Civics
- —
Market trends
- HPI YoY
- ▼ -121.68%
- Current HPI
- 235.4861
- Rent YoY
- ▲ 7.63%
- Metro
- Pittsburgh, PA
- State GDP YoY
- ▲ 1.68%
- F500 in state
- 34
Industry mix (Fortune 500 HQ in PA)
| Industry | F500 HQs | Revenue |
|---|---|---|
| Healthcare | 2 | $309B |
|
||
| Insurance | 2 | $27B |
|
||
| Telecommunications / Media | 1 | $124B |
|
||
| Industrial Distribution | 1 | $22B |
|
||
| Financial Services | 1 | $20B |
|
||
| Chemicals / Materials | 1 | $18B |
|
||
Price history
+148.4% since first listed9 events — show timeline
- 2026-04-15 Pending — West Penn MLS
- 2026-03-17 Price Changed $79,500 West Penn MLS
- 2026-02-27 Price Changed $89,500 West Penn MLS
- 2026-02-11 Price Changed $105,200 West Penn MLS
- 2026-01-20 Listed $127,200 West Penn MLS
- 2006-04-17 Sold (Public Records) $62,000 Public Records
- 2006-04-17 Sold (MLS) $62,000 West Penn MLS
- 2006-03-01 Listed $65,000 West Penn MLS
- 1986-03-13 Sold (Public Records) $32,000 Public Records
Property tax history
+2.5%/yrLatest (2026): $2,617 · +0.0% YoY. Source: county tax records.
Cash-flow waterfall
monthlySold comps — $/sqft
last 12 mo · ≤1 miLoading sold comps…