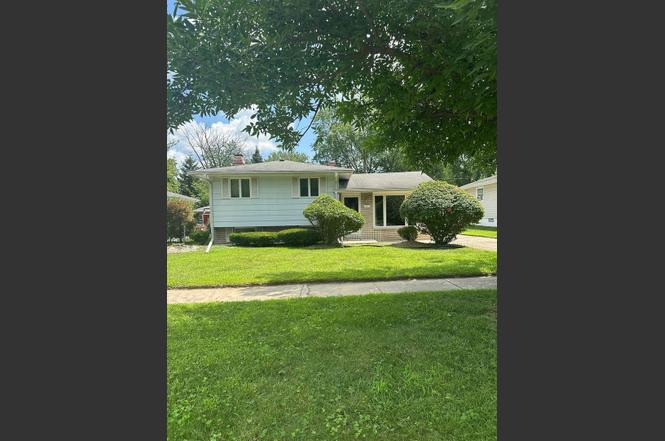
17871 Locust St · Lansing, IL
Flood risk 1/10 · Minimal
- FEMA flood zone
- X (unshaded)
- Chance of flooding over 30 yrs
- 0.0%
- Est. flood insurance / yr
- $507 – $1,088
Fire risk 3/10 · Minor
- Est. fire insurance / yr
- $804 – $1,492
Heat risk 3/10 · Minor
- Hot days now (above 103°F)
- 7 days/yr
- Hot days in 30 yrs
- 15 days/yr
Wind risk 2/10 · Minimal
- Chance of severe wind over 30 yrs
- 0.0%
Air-quality risk 4/10 · Minor
- Unhealthy air days now
- 4 days/yr
- Unhealthy air days in 30 yrs
- 5 days/yr
Risk factors via First Street. Map © Google.
Why this score? — see what drove the D grade
The composite is a weighted blend of 9 inputs, each scored 0–100. Each bar is that input's sub-score; the figure is the points it added to the 100-point composite (weight × sub-score).
- Cash flow +16.9/30.0
- ARV discount +6.3/15.0
- DSCR +5.3/10.0
- 1% rule +4.1/10.0
- Livability +3.7/5.0
- Rent growth +2.5/5.0
- Condition / age +2.5/5.0
- Schools +1.0/10.0
- Appreciation +0.0/10.0
$170,000
🖨 Deal sheet (PDF) 📄 Offer letter ✓ Due diligence
Listing remarks
Welcome to your dream home. This charming 3-bedroom, 1.5-bath retreat spans 930 sq ft on a generous 7,350 sq ft lot, nestled in a peaceful and quiet neighborhood. This move-in-ready gem is in excellent condition, offering a seamless transition for new owners, though optional updates allow you to add your personal touch. Step inside to discover a warm, inviting interior with hardwood floors, cozy bedrooms, and a well-appointed bathroom, complemented by a bright living space perfect for relaxation or entertaining. The spacious lot provides a private oasis with lush greenery, ideal for outdoor enjoyment or future enhancements. The property also features an oversized 2-car garage with ample
Key facts
- 7,300 sq ft lot
- 2 garage spots
- Built 1972
Property features AI
Finance
- Other: Property assessed/living area source: assessor; Parcel number available
- HOA & community: No master association fee required
Exterior
- Parking: Detached garage (concrete) — 2 garage spaces, 2 parking spaces total; Garage is owned
- Utilities: Public water; Public sewer
- Home design: Detached single-family home; Split-level / bi-level design; Fee simple ownership
- Construction: Built approximately 51–60 years ago; Built before 1978; Brick and frame construction; Brick/mortar foundation; Asphalt roof
- Exterior features: Park, sidewalks, and street lights in the neighborhood; Lot about 50 x 146 (less than 0.25 acre)
Interior
- Kitchen: Kitchen on main level (about 15 x 12); Microwave; Dishwasher; Refrigerator
- Bedrooms: Three bedrooms (master on second level, two additional bedrooms on second level — each about 8 x 10)
- Flooring: Hardwood flooring; Carpet in living room
- Bathrooms: One full bathroom; One half bathroom; Basement includes a bathroom
- Heating & cooling: Other heating; Other cooling
- Interior features: Partially finished, full basement; Six total rooms; Hardwood flooring in some areas; Carpet in living room; One fireplace in the family room
- Laundry & utility: Laundry room; Washer and dryer included
Neighborhood map
What this means for you Summary
Snapshot
- This is a 3-bed/1.5-bath single-family listed at $170k.
Deal economics
- At list price, monthly cash flow is $113 ($1k/yr) — positive.
- The deal already cash-flows at list — no discount required.
- To meet the 1% rule (rent ≥ 1% of price), the offer needs to be $154k (9.3% below list).
- Recommended offer: $150k (12.0% below list) — sets the bar for market timing.
- Cap rate 7.1% vs local median 5.9% in Lansing — meaningfully above typical; check what's discounted (condition, days-on-market, listing class) to confirm the premium yield is real.
Location & tenants
- Location reads 73/100 on livability (#296 in IL) — a middle-class / working-renter tenant base. Strengths: commute A+, cost of living A+, housing A+; Watch: crime D+, health & safety D+, amenities F.
- Thornton Fractional Twp Hsd 215 (suburban): math 9% / reading 13% proficiency, ranked #563 of 620 in IL (top 91%) — low school quality limits family demand, transient renter base, plan for 1-2y turnover.
- Zoned schools: Oak Glen Elem School (math 12% / reading 17%, grade F, #1,278 of 2,056 statewide, top 65%, 529 students, 0% FRL); Memorial Jr High School (math 9% / reading 20%, grade F, #517 of 665 statewide, top 79%, 860 students, 0% FRL); Thornton Fractnl So High School (math 11% / reading 14%, grade F, #504 of 693 statewide, top 73%, 1,927 students, 0% FRL).
- Market conditions: 136 active listings in the ZIP; 14 comparable units currently listed for rent nearby; rentals at typical pace (median 20d on market — plan ~3-4 weeks tenant-placement turnaround); solid renter incomes; 6,272 units permitted in Cook County in 2024 (4,658 in 5+ unit buildings).
Forward outlook
- Local home prices are declining (-3.0%/yr); year-one equity from $1k of loan paydown is wiped out by about $5k of value loss. Plan a longer hold.
Negotiation context
- It's been on market 318 days — a 12% lower offer ($150k) is reasonable based on typical stale-listing flexibility.
- 2 sale attempts with the ask held roughly flat each time — persistent listings suggest the price (not the market) is what's stuck; bring a comps-based counter.
Questions for the listing agent
- It's been on market 318 days. Have you received any prior offers? Is the seller open to a 12% concession, seller financing, or rate buy-down credit?
- Built in 1972 — when were the roof, HVAC, electrical panel, plumbing, and water heater last replaced?
- Why hasn't it sold? Are there any deal-killer items the seller is aware of (foundation, flood, title, zoning, code violations)?
- Is there a deadline driving the sale (1031 exchange, divorce, estate, relocation)? That informs how much negotiation room exists.
- Schools are D-rated, which usually means shorter tenancies and higher turnover. Who's the typical renter profile here, and what's been the actual vacancy rate?
- Crime grade is D in this area — have there been break-ins, vandalism, or insurance claims at this property in the last 3 years? What carrier currently insures it and at what premium?
- The area grade is low — what's the realistic commute time and amenity access for the typical tenant pool here? Any planned neighborhood developments (good or bad) we should know about?
- What's the average days-on-market for RENTAL listings here right now (not sales)? A rising rental-DOM trend means longer vacancies and softer asking-rent achievability than the comps imply.
- What's the recent tenant-quality profile in this submarket — average credit score on applications, eviction rate, late-payment / NSF rate, and stable-employment percentage? A property-management company in the area should have these aggregated.
- How much new for-sale + rental construction is in the pipeline within 1–3 miles? Heavy new supply typically softens prices + rents 12–24 months out; constrained supply supports both.
Investment metrics
- 1% rule
- 0.91% ✗
- Cap rate
- 7.09%
- Cash-on-cash
- 2.84%
- DSCR
- 1.13
- GRM
- 9.2
CMA / ARV
- ARV (on-the-fly)
- $165,540
- Comps found
- 7
Show comp detail 7 sales within ~0.75 mi
| Address | Dist | Beds/Ba | Sqft | Sold | Price | $/sf | Match |
|---|---|---|---|---|---|---|---|
| 2036 Thornton Lansing Rd | 0.15mi | 2/1.0 (-1) | 908 (-2%) | 5mo | $100,000 | $110 | 78 |
| 2216 177th St | 0.23mi | 3/1.0 | 877 (-6%) | 6mo | $218,000 | $249 | 72 |
| 17935 Oakley Ave | 0.52mi | 3/2.0 | 916 (-2%) | 9mo | $170,000 | $186 | 64 |
| 17912 School St | 0.74mi | 3/1.0 | 942 (+1%) | 2mo | $140,000 | $149 | 60 |
| 2522 Indiana Ave | 0.51mi | 3/3.0 | 1,012 (+9%) | 6mo | $180,000 | $178 | 50 |
| 17915 Glen Oak Ave | 0.33mi | 2/2.0 (-1) | 1,011 (+9%) | 17mo | $164,500 | $163 | 49 |
| 2205 182nd St | 0.43mi | 3/2.0 | 1,060 (+14%) | 9mo | $232,000 | $219 | 47 |
Match score weights: distance 35% · size 25% · config 20% · recency 20%. Top-matched comps best support the ARV.
Projected returns pro-forma
-3.0% appreciation · 3.0% rent growth · sell at horizon
- IRR
- -11.8%
- Equity multiple
- 0.57×
- Total profit
- $-20,389
- Equity at exit
- $25,348
- IRR
- -2.7%
- Equity multiple
- 0.82×
- Total profit
- $-8,591
- Equity at exit
- $14,698
Cash invested: $47,600 (down + closing). Projections, not guarantees.
Landlord ↔ Tenant lean methodology
- Overall (STATE)
- 43 Moderately Tenant-Leaning
- State Illinois
- 43 Moderately Tenant-Leaning · D+7
- County
- — inherits STATE
- City
- — inherits STATE
ZIP-level market 60438
- Active inventory
- 136
- Price-to-rent
- 9.2×
Monthly cashflow live
- Estimated rent
- $1,541 high interval (Pro) →
- Mortgage (P&I)
- −$891
- Tax from tax record
- −$142 /mo · $1,709/yr
- Insurance
- −$71
- HOA
- −$0
- Vacancy / Maint / Mgmt
- −$324
- Net cashflow
- $113
Break-even live
Sensitivity live
| Price | -10% $209 | -5% $161 | +0% $113 | +5% $65 | +10% $16 |
|---|---|---|---|---|---|
| Rent | -10% $-9 | -5% $52 | +0% $113 | +5% $174 | +10% $234 |
| Rate | -1.0pp $198 | -0.5pp $156 | base $113 | +0.5pp $69 | +1.0pp $24 |
UW: 25.0% down · 7.5% · 30yr · 1.5% tax · 5.0% vac · 8.0% maint · 8.0% mgmt
Financing live
Cash to close
- Down payment
- $42,500
- Closing costs
- $5,100
- Reserves months
- —
- Total cash needed
- —
Loan-product check · same deal, 3 products live
Conventional
25% down · 7.5% · 30yr
- Down + closing
- —
- Monthly P&I
- —
- Monthly cashflow
- —
- DSCR
- —
- Eligible?
- —
Personal DTI + credit; lowest rate.
DSCR
20% down · 8.5% · 30yr
- Down + closing
- —
- Monthly P&I
- —
- Monthly cashflow
- —
- DSCR
- —
- Eligible?
- —
No personal income docs; deal must DSCR.
Hard money
10% down · 12.0% · 12mo
- Down + closing
- —
- Monthly P&I
- —
- Monthly cashflow
- —
- DSCR
- —
- Eligible?
- —
Short-term bridge; refi at stabilization.
Rent comps 14 comps
| Address | Beds | Baths | Sqft | Rent | $/sqft | DOM | Units | Dist |
|---|---|---|---|---|---|---|---|---|
| 17754 Rosewood Dr Unit 1N Lansing, IL | 2.0 | 1.0 | 850 | $1,370 | $1.61 | 26d | 1 | 0.24mi |
| 17640 Rosewood Dr Unit 2A Lansing, IL | 2.0 | 1.0 | 950 | $1,475 | $1.55 | 19d | 1 | 0.29mi |
| 17723 Exchange Ave Unit 17723-1N Lansing, IL | 3.0 | 2.0 | 1100 | $1,800 | $1.64 | 0d | 1 | 0.63mi |
| 18361 Glen Oak Ave Unit 1E Lansing, IL | 2.0 | 1.0 | 900 | $1,400 | $1.56 | 26d | 1 | 0.71mi |
| 18381 Torrence Ave Lansing, IL | 2.0 | 1.0 | 900 | $1,300 | $1.44 | 26d | 1 | 0.71mi |
| 18440 Torrence Ave Lansing, IL | 2.0 | 1.0 | 800 | $1,200 | $1.50 | 26d | 1 | 0.81mi |
| 18550 Torrence Ave #25 Lansing, IL | 2.0 | 1.0 | 1000 | $1,300 | $1.30 | 13d | 1 | 0.91mi |
| 3020 178th St Apt C7 Lansing, IL | 2.0 | 1.0 | 900 | $1,550 | $1.72 | 26d | 1 | 0.99mi |
| 3020 178th St Unit C1 Lansing, IL | 2.0 | 1.0 | 900 | $1,550 | $1.72 | 0d | 1 | 1.00mi |
| 3007 Bernice Rd Unit 3007 1S Lansing, IL | 2.0 | 1.0 | 850 | $1,400 | $1.65 | 0d | 1 | 1.14mi |
| 3023 Bernice Rd Apt 2S Lansing, IL | 3.0 | 1.0 | 1000 | $1,600 | $1.60 | 0d | 1 | 1.15mi |
| 3023 Bernice Rd Unit 3030 3N Lansing, IL | 3.0 | 1.0 | 1000 | $1,400 | $1.40 | 0d | 1 | 1.15mi |
| 3069 Bernice Rd Apt 2S Lansing, IL | 3.0 | 1.0 | 950 | $1,535 | $1.62 | 4d | 1 | 1.21mi |
| 3069 Bernice Rd Apt 2N Lansing, IL | 3.0 | 1.0 | 950 | $1,535 | $1.62 | 22d | 1 | 1.21mi |
Listing history 18 events
-
2026-06-21days on market $170,000 Active 318 DOM
-
2026-06-18days on market $170,000 Active 315 DOM
-
2026-06-17days on market $170,000 Active 314 DOM
-
2026-06-16days on market $170,000 Active 313 DOM
-
2026-06-15days on market $170,000 Active 312 DOM
-
2026-06-13days on market $170,000 Active 310 DOM
-
2026-06-09days on market $170,000 Active 306 DOM
-
2026-06-08days on market $170,000 Active 305 DOM
-
2026-06-07days on market $170,000 Active 304 DOM
-
2026-06-04days on market $170,000 Active 301 DOM
-
2026-06-03days on market $170,000 Active 300 DOM
-
2026-06-02days on market $170,000 Active 299 DOM
-
2026-06-01days on market $170,000 Active 298 DOM
-
2026-05-31days on market $170,000 Active 297 DOM
-
2025-08-25status Active
-
2025-08-21historical Contingent - Continue to Show
-
2025-08-07$170,000 Active
-
2006-09-22soldstatus $157,000
ⓘ Source: listings_history table (triggers on properties + properties_extension) + one-shot
backfill from property_details.listing_events for pre-trigger history.
Tax reassessment forecast IL · Partial reset (capped growth)
- Current annual tax
- $1,709 · $142/mo
- Projected year-2 tax
- $2,784 · $232/mo
- Expected delta
- +$1,075/yr (+$90/mo · 62.9%)
ⓘ Screening estimate from a state-policy table — verify with the county assessor before closing.
Climate risk First Street
- Flood 1/10 Low FEMA zone X (unshaded) · 0% chance over 30 yrs
- Wildfire 3/10 Moderate
- Heat 3/10 Moderate 7 d/yr ≥103°F today · 15 d/yr by 30 yrs out
- Wind 2/10 Low 0% chance of damaging wind over 30 yrs
- Air quality 4/10 Moderate 4 unhealthy d/yr today · 5 by 30 yrs out
Nearby sold comps map
Loading sold comps map…
Walkable amenities ~0.75 mi
Loading nearby amenities…
Taxation est. · year 1
- Rental income
- $18,493
- − Mortgage interest
- −$9,523
- − Property taxes
- −$1,709
- − Insurance
- −$850
- − Repairs & maintenance
- −$1,479
- − Management
- −$1,479
- − Depreciation
- −$4,945
- Taxable loss
- −$1,493
- Est. tax savings @ 24.0%
- +$358
- After-tax cash flow
- $1,711/yr
For passive investors: Depreciation is non-cash, so a rental often shows a tax loss while cash-flowing — sheltering income. Rental losses are passive: they offset passive income freely, and up to $25,000/yr can offset ordinary (W-2) income if you actively participate and your MAGI is under $100k (phasing out to $0 by $150k); unused losses carry forward. On sale, claimed depreciation is recaptured at up to 25%, and gains may owe capital-gains tax (a 1031 exchange can defer both). Figures are a year-1 estimate at your 24.0% rate — not tax advice; consult a CPA.
Schools (NCES district)
- District
- Thornton Fractional Twp Hsd 215
- NCES district ID
- 1738940
- Math proficiency
- 9% ▼ -3.00%
- Reading proficiency
- 13% ▼ -3.00%
- Median HH income
- $48,207
- Composite
- 10.27/100
- National rank
- #9793
- State rank
- #563 of 620 in IL
Livability — Lansing
- Score
- 73/100
- State rank
- #296
- US rank
- #5698
Category grades
Schools grade is shown separately in the Schools card above.
Census & demographics
- Census place
- Lansing, IL
- County
- Cook County · 4,486,803 people
- City population
- 28,806
- Metro
- Chicago-Naperville-Elgin, IL-IN-WI
- Population (ZIP)
- 28,806
- Household income
- $75,681
- Rent vs Own
- Severe rent burden
- 830.0
Population outlook (Cook County) Hauer SSP2
- Today (2025)
- 5,347,519 people
- By 2030
- 5,357,703 · +0.2%
- By 2040
- 5,324,924 · -0.4%
- By 2050
- 5,230,762 · -2.2%
- By 2075
- 4,785,735 · -10.5%
- By 2100
- 4,188,836 · -21.7%
Race, ethnicity, and origin ACS 2023
- Neighborhood character
- Diverse neighborhood (Simpson 0.65)
- Race & ethnicity
- Black 51% White 25% Hispanic / Latino 18% Two or more races 7% Asian 2%
- Hispanic origin (detail)
- Mexican 15%
- Common ancestry
- Romanian 5% Iranian 3% Lithuanian 1%
- Foreign-born
- 10% · Canada
- Languages at home
- 83% English-only · Spanish 12% Vietnamese 1% French/Haitian/Cajun 1%
Political lean MEDSL · Cook
- 2024 margin
- Solid D (+42.0) · D 70.4% · R 28.4% · Other 1.2%
- 2008→2024 swing
- -11.4pp toward R · 2008: 53.4pp · 2024: 42.0pp
- All cycles
- 2024: D+42.0 2020: D+50.3 2016: D+53.0 2012: D+49.4 2008: D+53.4
Not yet ingested
- Civics
- —
Market trends
- HPI YoY
- ▼ -151.65%
- Current HPI
- 210.3398
- Rent YoY
- —
- Metro
- Chicago-Naperville-Elgin, IL-IN-WI
- State GDP YoY
- ▲ 1.59%
- F500 in state
- 60
Industry mix (Fortune 500 HQ in IL)
| Industry | F500 HQs | Revenue |
|---|---|---|
| Insurance | 4 | $201B |
|
||
| Consumer Goods | 4 | $87B |
|
||
| Industrial Machinery | 3 | $64B |
|
||
| Healthcare | 2 | $55B |
|
||
| Retail / Pharmacy | 1 | $148B |
|
||
| Agriculture / Food | 1 | $86B |
|
||
Price history
+8.3% since first listed4 events — show timeline
- 2025-08-25 Relisted — MRED as Distributed by MLS Grid
- 2025-08-21 Contingent — MRED as Distributed by MLS Grid
- 2025-08-07 Listed $170,000 MRED as Distributed by MLS Grid
- 2006-09-22 Sold (Public Records) $157,000 Public Records
Property tax history
-6.0%/yrLatest (2023): $1,709 · -11.2% YoY. Source: county tax records.
Cash-flow waterfall
monthlySold comps — $/sqft
last 12 mo · ≤1 miLoading sold comps…