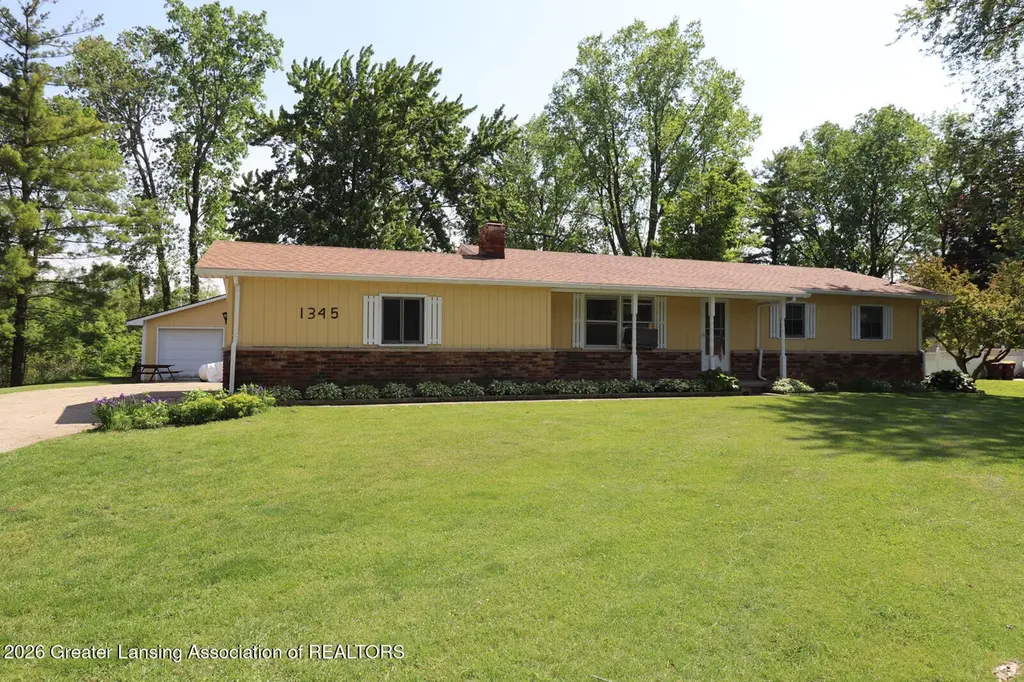
1345 W Stoll Rd · DeWitt, MI
Flood risk 1/10 · Minimal
- FEMA flood zone
- X (unshaded)
- Chance of flooding over 30 yrs
- 0.0%
- Est. flood insurance / yr
- $473 – $860
Fire risk 3/10 · Minor
- Est. fire insurance / yr
- $784 – $1,456
Heat risk 2/10 · Minimal
- Hot days now (above 97°F)
- 7 days/yr
- Hot days in 30 yrs
- 14 days/yr
Wind risk 2/10 · Minimal
- Chance of severe wind over 30 yrs
- —
Air-quality risk 2/10 · Minimal
- Unhealthy air days now
- 1 days/yr
- Unhealthy air days in 30 yrs
- 2 days/yr
Risk factors via First Street. Map © Google.
Why this score? — see what drove the D+ grade
The composite is a weighted blend of 9 inputs, each scored 0–100. Each bar is that input's sub-score; the figure is the points it added to the 100-point composite (weight × sub-score).
- ARV discount +15.0/15.0
- Cash flow +14.9/30.0
- DSCR +4.6/10.0
- Livability +3.9/5.0
- 1% rule +3.3/10.0
- Rent growth +2.5/5.0
- Condition / age +2.5/5.0
- Schools +1.9/10.0
- Appreciation +0.0/10.0
$245,000
🖨 Deal sheet 📄 Offer letter ✓ Due diligence
Listing remarks MLS
3 bed, 1.5 bath ranch located on a half-acre on Stoll Road in DeWitt. Vacant and easy to show, schedule your tour today!
Key facts
- 0.5 acre lot
- 2 garage spots
- Built 1966
Property features AI
Exterior
- Parking: 2-car garage; 2 carport spaces; Additional parking (other)
- Utilities: Public sewer; Paved road frontage (county road)
- Home design: Ranch-style; One level
- Construction: Wood siding; Built in 1966
- Exterior features: Shingle roof; Pole barn
Interior
- Kitchen: Range; Refrigerator
- Bedrooms: 3 bedrooms
- Bathrooms: 1 full bathroom; 1 half bathroom
- Heating & cooling: Hot water heating; Cooling system present (other)
- Interior features: Front entry; Full basement, partially finished
- Laundry & utility: Laundry in basement
Neighborhood map
What this means for you Summary
Snapshot
- This is a 3-bed/1.5-bath single-family listed at $245k.
Deal economics
- At list price, monthly cash flow is $71 ($850/yr) — positive.
- The deal already cash-flows at list — no discount required.
- To meet the 1% rule (rent ≥ 1% of price), the offer needs to be $203k (17.0% below list).
- Recommended offer: $203k (17.0% below list) — sets the bar for 1% rule.
- Cap rate 6.6% vs local median 2.9% in DeWitt — top-decile yield for the area; either an underpriced asset or a hidden risk that comps aren't pricing in. Stress-test before assuming the spread holds.
Location & tenants
- Location reads 78/100 on livability (#99 in MI, #2,361 nationally) — a middle-class / working-renter tenant base. Strengths: crime A+, employment A+, cost of living A+; Watch: amenities F, commute F, health & safety D-.
- Lansing Public School District (urban): math 14% / reading 23% proficiency, ranked #650 of 760 in MI (top 86%) — low school quality limits family demand, transient renter base, plan for 1-2y turnover; 68% free/reduced lunch — lower-income household profile, screen leases tightly.
- Market conditions: 103 active listings in the ZIP; high-income renter base; 154 units permitted in Clinton County in 2024 (0 in 5+ unit buildings).
Forward outlook
- Local home prices are declining (-3.0%/yr); year-one equity from $2k of loan paydown is wiped out by about $7k of value loss. Plan a longer hold.
Negotiation context
- It's been on market 22 days — a 2% lower offer ($241k) is reasonable based on typical stale-listing flexibility.
- 2 sale attempts; this cycle's ask has dropped $13k (5%) from the opening price — seller is motivated, your offer sets the floor, not the list.
Questions for the listing agent
- Built in 1966 — when were the roof, HVAC, electrical panel, plumbing, and water heater last replaced?
- Is there a deadline driving the sale (1031 exchange, divorce, estate, relocation)? That informs how much negotiation room exists.
- Schools are A-rated — typically a magnet for longer-tenancy family renters. What's the average tenant stay here, and is there a school-zone premium baked into asking?
- The area grade is low — what's the realistic commute time and amenity access for the typical tenant pool here? Any planned neighborhood developments (good or bad) we should know about?
- What's the average days-on-market for RENTAL listings here right now (not sales)? A rising rental-DOM trend means longer vacancies and softer asking-rent achievability than the comps imply.
- What's the recent tenant-quality profile in this submarket — average credit score on applications, eviction rate, late-payment / NSF rate, and stable-employment percentage? A property-management company in the area should have these aggregated.
- How much new for-sale + rental construction is in the pipeline within 1–3 miles? Heavy new supply typically softens prices + rents 12–24 months out; constrained supply supports both.
Investment metrics
- 1% rule
- 0.83% ✗
- Cap rate
- 6.64%
- Cash-on-cash
- 1.24%
- DSCR
- 1.06
- GRM
- 10.0
CMA / ARV
- ARV (on-the-fly)
- $325,960
- Comps found
- 4
Show comp detail 4 sales within ~0.75 mi
| Address | Dist | Beds/Ba | Sqft | Sold | Price | $/sf | Match |
|---|---|---|---|---|---|---|---|
| 1181 W Stoll Rd | 0.07mi | 3/2.0 | 2,448 (+9%) | 12mo | $255,000 | $104 | 70 |
| 1351 W Stoll Rd | 0.03mi | 4/2.0 (+1) | 1,924 (-14%) | 22mo | $278,100 | $145 | 49 |
| 1694 W Solon Rd | 0.66mi | 3/1.5 | 1,986 (-12%) | 2mo | $230,000 | $116 | 48 |
| 1589 W Solon Rd | 0.53mi | 4/2.5 (+1) | 2,450 (+9%) | 24mo | $400,000 | $163 | 31 |
Match score weights: distance 35% · size 25% · config 20% · recency 20%. Top-matched comps best support the ARV.
Projected returns pro-forma
-3.0% appreciation · 3.0% rent growth · sell at horizon
- IRR
- -14.4%
- Equity multiple
- 0.49×
- Total profit
- $-35,255
- Equity at exit
- $36,530
- IRR
- -5.7%
- Equity multiple
- 0.63×
- Total profit
- $-25,158
- Equity at exit
- $21,183
Cash invested: $68,600 (down + closing). Projections, not guarantees.
Landlord ↔ Tenant lean methodology
- Overall (STATE)
- 62 Landlord-Friendly
- State Michigan
- 62 Landlord-Friendly · EVEN
- County
- — inherits STATE
- City
- — inherits STATE
ZIP-level market 48820
- Active inventory
- 103
- Price-to-rent
- 10.0×
Monthly cashflow live
- Estimated rent
- $2,034 medium interval (Pro) →
- Mortgage (P&I)
- −$1,285
- Tax from tax record
- −$149 /mo · $1,785/yr
- Insurance
- −$102
- HOA
- −$0
- Vacancy / Maint / Mgmt
- −$427
- Net cashflow
- $71
Break-even live
UW: 25.0% down · 7.5% · 30yr · 1.5% tax · 5.0% vac · 8.0% maint · 8.0% mgmt
Financing live
Cash to close
- Down payment
- $61,250
- Closing costs
- $7,350
- Reserves months
- —
- Total cash needed
- —
Loan-product check · same deal, 3 products live
Conventional
25% down · 7.5% · 30yr
- Down + closing
- —
- Monthly P&I
- —
- Monthly cashflow
- —
- DSCR
- —
- Eligible?
- —
Personal DTI + credit; lowest rate.
DSCR
20% down · 8.5% · 30yr
- Down + closing
- —
- Monthly P&I
- —
- Monthly cashflow
- —
- DSCR
- —
- Eligible?
- —
No personal income docs; deal must DSCR.
Hard money
10% down · 12.0% · 12mo
- Down + closing
- —
- Monthly P&I
- —
- Monthly cashflow
- —
- DSCR
- —
- Eligible?
- —
Short-term bridge; refi at stabilization.
Listing history 19 events
-
2026-06-18status $245,000 Active 22 DOM
-
2026-06-18days on market $245,000 Active Under Contract 22 DOM
-
2026-06-17days on market $245,000 Active Under Contract 21 DOM
-
2026-06-16days on market $245,000 Active Under Contract 20 DOM
-
2026-06-15days on market $245,000 Active Under Contract 19 DOM
-
2026-06-14days on market $245,000 Active Under Contract 17 DOM
-
2026-06-13statusdays on market $245,000 Active Under Contract 16 DOM
-
2026-06-10pricedays on market $245,000 Active 14 DOM
-
2026-06-09days on market $258,000 Active 13 DOM
-
2026-06-08days on market $258,000 Active 12 DOM
-
2026-06-07days on market $258,000 Active 11 DOM
-
2026-06-05days on market $258,000 Active 8 DOM
-
2026-06-03days on market $258,000 Active 7 DOM
-
2026-06-02days on market $258,000 Active 6 DOM
-
2026-06-01days on market $258,000 Active 5 DOM
-
2026-05-31days on market $258,000 Active 4 DOM
-
2026-05-30days on market $258,000 Active 3 DOM
-
2026-05-27$258,000 Active 120-char remark
Show marketing remark (120 chars)
3 bed, 1.5 bath ranch located on a half-acre on Stoll Road in DeWitt. Vacant and easy to show, schedule your tour today!
-
2026-05-27$258,000 Active
Show marketing remark (120 chars)
3 bed, 1.5 bath ranch located on a half-acre on Stoll Road in DeWitt. Vacant and easy to show, schedule your tour today!
ⓘ Source: listings_history table (triggers on properties + properties_extension) + one-shot
backfill from property_details.listing_events for pre-trigger history.
Tax reassessment forecast MI · Partial reset (capped growth)
- Current annual tax
- $1,785 · $149/mo
- Projected year-2 tax
- $2,779 · $232/mo
- Expected delta
- +$994/yr (+$83/mo · 55.7%)
ⓘ Screening estimate from a state-policy table — verify with the county assessor before closing.
Climate risk First Street
- Flood 1/10 Low FEMA zone X (unshaded) · 0% chance over 30 yrs
- Wildfire 3/10 Moderate
- Heat 2/10 Low 7 d/yr ≥97°F today · 14 d/yr by 30 yrs out
- Wind 2/10 Low
- Air quality 2/10 Low 1 unhealthy d/yr today · 2 by 30 yrs out
Nearby sold comps map
Loading sold comps map…
Walkable amenities ~0.75 mi
Loading nearby amenities…
Taxation est. · year 1
- Rental income
- $24,403
- − Mortgage interest
- −$13,724
- − Property taxes
- −$1,785
- − Insurance
- −$1,225
- − Repairs & maintenance
- −$1,952
- − Management
- −$1,952
- − Depreciation
- −$7,127
- Taxable loss
- −$3,363
- Est. tax savings @ 24.0%
- +$807
- After-tax cash flow
- $1,657/yr
For passive investors: Depreciation is non-cash, so a rental often shows a tax loss while cash-flowing — sheltering income. Rental losses are passive: they offset passive income freely, and up to $25,000/yr can offset ordinary (W-2) income if you actively participate and your MAGI is under $100k (phasing out to $0 by $150k); unused losses carry forward. On sale, claimed depreciation is recaptured at up to 25%, and gains may owe capital-gains tax (a 1031 exchange can defer both). Figures are a year-1 estimate at your 24.0% rate — not tax advice; consult a CPA.
Schools (NCES district)
- District
- Lansing Public School District
- NCES district ID
- 2621150
- Math proficiency
- 14% ▲ 1.00%
- Reading proficiency
- 23% ▲ 3.00%
- Median HH income
- $37,453
- Composite
- 18.76/100
- National rank
- #14002
- State rank
- #650 of 760 in MI
Livability — DeWitt
- Score
- 78/100
- State rank
- #99
- US rank
- #2361
Category grades
Schools grade is shown separately in the Schools card above.
Census & demographics
- County
- Clinton County · 18,357 people
- City population
- 18,357
- Metro
- Lansing-East Lansing, MI
- Population (ZIP)
- 18,357
- Household income
- $112,526
- Rent vs Own
- Severe rent burden
- 183.0
Population outlook (Clinton County) Hauer SSP2
- Today (2025)
- 81,490 people
- By 2030
- 82,558 · +1.3%
- By 2040
- 82,325 · +1.0%
- By 2050
- 79,133 · -2.9%
- By 2075
- 65,737 · -19.3%
- By 2100
- 51,314 · -37.0%
Race, ethnicity, and origin ACS 2023
- Neighborhood character
- Predominantly White (88%)
- Race & ethnicity
- White 88% Hispanic / Latino 6% Two or more races 5% Black 2%
- Hispanic origin (detail)
- Mexican 5%
- Common ancestry
- Romanian 5% Lithuanian 3% Slovak 3%
- Foreign-born
- 2% · Canada
- Languages at home
- 96% English-only · Spanish 2% German/W. Germanic 1%
Political lean MEDSL · Clinton
- 2024 margin
- Lean R (+8.6) · D 44.9% · R 53.5% · Other 1.5%
- 2008→2024 swing
- -9.3pp toward R · 2008: 0.7pp · 2024: -8.6pp
- All cycles
- 2024: R+8.6 2020: R+6.5 2016: R+12.7 2012: R+6.2 2008: D+0.7
Not yet ingested
- Civics
- —
Market trends
- HPI YoY
- ▼ -167.50%
- Current HPI
- 231.0122
- Rent YoY
- —
- Metro
- Lansing-East Lansing, MI
- State GDP YoY
- ▲ 1.37%
- F500 in state
- 28
Industry mix (Fortune 500 HQ in MI)
| Industry | F500 HQs | Revenue |
|---|---|---|
| Automotive Parts | 3 | $48B |
|
||
| Automotive | 2 | $372B |
|
||
| Chemicals | 1 | $45B |
|
||
| Automotive Retail | 1 | $29B |
|
||
| Healthcare / Medical Devices | 1 | $23B |
|
||
| Automotive Technology | 1 | $20B |
|
||
Price history
+0.0% since first listed2 events — show timeline
- 2026-05-27 Listed $258,000 REALCOMP
- 2026-05-27 Listed $258,000 Greater Lansing AoR
Property tax history
-0.7%/yrLatest (2025): $1,785 · -32.2% YoY. Source: county tax records.
Cash-flow waterfall
monthlySold comps — $/sqft
last 12 mo · ≤1 miLoading sold comps…