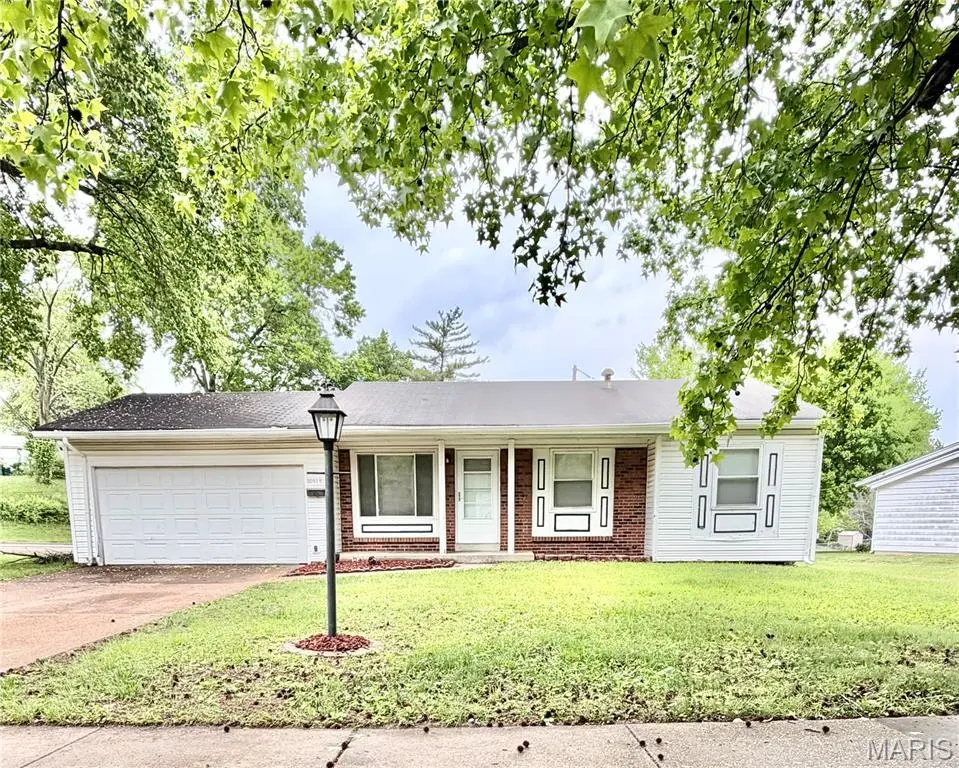
10619 Foxlair Dr · Bellefontaine Neighbors, MO
Flood risk 1/10 · Minimal
- FEMA flood zone
- X (unshaded)
- Chance of flooding over 30 yrs
- 0.0%
- Est. flood insurance / yr
- $473 – $860
Fire risk 1/10 · Minimal
- Est. fire insurance / yr
- $1,054 – $1,958
Heat risk 5/10 · Moderate
- Hot days now (above 107°F)
- 7 days/yr
- Hot days in 30 yrs
- 21 days/yr
Wind risk 2/10 · Minimal
- Chance of severe wind over 30 yrs
- 1.0%
Air-quality risk 4/10 · Minor
- Unhealthy air days now
- 4 days/yr
- Unhealthy air days in 30 yrs
- 5 days/yr
Risk factors via First Street. Map © Google.
Why this score? — see what drove the C- grade
The composite is a weighted blend of 9 inputs, each scored 0–100. Each bar is that input's sub-score; the figure is the points it added to the 100-point composite (weight × sub-score).
- Cash flow +22.7/30.0
- DSCR +7.3/10.0
- 1% rule +6.0/10.0
- ARV discount +5.6/15.0
- Rent growth +4.1/5.0
- Livability +2.9/5.0
- Condition / age +2.5/5.0
- Schools +0.4/10.0
- Appreciation +0.0/10.0
$129,000
🖨 Deal sheet (PDF) 📄 Offer letter ✓ Due diligence
Listing remarks
Well-maintained 3-bedroom, 1.5-bath home featuring brand new carpet throughout, a spacious layout, and a partially finished basement perfect for extra living space, an office, or hobbies. Conveniently located near Lilac and Foxlair this home is a great opportunity for homeowners or investors alike! Being sold As-Is.
Key facts
- 0.32 acre lot
- 2 garage spots
- Built 1969
Property features AI
Finance
- Other: Taxes reported for most recent year
- Financial info: No second mortgage reported
Exterior
- Parking: Two-car garage
- Utilities: Public water; Public sewer; 220-volt electric; Cable available; Electricity available; Natural gas available
- Home design: Single family residence; Residential property; Two levels; Above-grade finished living area reported
- Construction: Aluminum siding; Brick; Vinyl siding; Partial, full basement
- Exterior features: Back yard
Interior
- Kitchen: Gas cooktop; Built-in electric oven; Wall oven; Free‑standing refrigerator
- Bedrooms: Three bedrooms on the main level
- Flooring: Carpet
- Bathrooms: One full bathroom; One half bathroom
- Heating & cooling: Forced-air heating (natural gas); Central air conditioning; Ceiling fan(s)
- Interior features: Breakfast bar; Ceiling fans
- Laundry & utility: Laundry in basement
Neighborhood map
What this means for you Summary
Snapshot
- This is a 3-bed/1.5-bath single-family listed at $129k.
Deal economics
- At list price, monthly cash flow is $223 ($3k/yr) — positive.
- The deal already cash-flows at list — no discount required.
- Meets the 1% rule at list price ($1k rent vs $129k).
Location & tenants
- Location reads 58/100 on livability (#592 in MO) — a working-class tenant base; expect higher turnover. Strengths: cost of living A+, housing B+; Watch: employment D+, schools F, crime F.
- Riverview Gardens (suburban): math 2% / reading 9% proficiency, ranked #324 of 324 in MO (top 100%) — low school quality limits family demand, transient renter base, plan for 1-2y turnover; 90% free/reduced lunch — lower-income household profile, screen leases tightly.
- Market conditions: Rents rising fast (+6.6%/yr); 203 active listings in the ZIP; 40 comparable units currently listed for rent nearby; rentals at typical pace (median 25d on market — plan ~3-4 weeks tenant-placement turnaround); lower-income renter base — watch delinquency; 920 units permitted in St. Louis County in 2024 (250 in 5+ unit buildings).
- This rent runs 39% of the median local income ($43k/yr) — at the standard rent-burdened threshold; future hikes will face affordability resistance.
Forward outlook
- Local home prices are declining (-3.0%/yr); year-one equity from $892 of loan paydown is wiped out by about $4k of value loss. Plan a longer hold.
- At projected returns (-3.0% appreciation + 6.6% rent growth), your $36k cash investment doubles in ~9 years — after that, you're playing with house money.
Negotiation context
- Only 2 days on market — expect competitive offers; lowballing is unlikely to land.
- Current owner paid $68k; list at $129k implies a 88% gain — meaningful room to come down on a strong offer.
Risks & watch-outs
- Climate carrying-cost: extreme-heat days projected 7→21/yr by 2055 (HVAC capex compounding) — expect insurance premiums to compound above CPI over the hold.
Questions for the listing agent
- Built in 1969 — when were the roof, HVAC, electrical panel, plumbing, and water heater last replaced?
- Is there a deadline driving the sale (1031 exchange, divorce, estate, relocation)? That informs how much negotiation room exists.
- Schools are F-rated, which usually means shorter tenancies and higher turnover. Who's the typical renter profile here, and what's been the actual vacancy rate?
- Crime grade is F in this area — have there been break-ins, vandalism, or insurance claims at this property in the last 3 years? What carrier currently insures it and at what premium?
- What's the average days-on-market for RENTAL listings here right now (not sales)? A rising rental-DOM trend means longer vacancies and softer asking-rent achievability than the comps imply.
- What's the recent tenant-quality profile in this submarket — average credit score on applications, eviction rate, late-payment / NSF rate, and stable-employment percentage? A property-management company in the area should have these aggregated.
- How much new for-sale + rental construction is in the pipeline within 1–3 miles? Heavy new supply typically softens prices + rents 12–24 months out; constrained supply supports both.
Investment metrics
- 1% rule
- 1.10% ✓
- Cap rate
- 8.37%
- Cash-on-cash
- 7.40%
- DSCR
- 1.33
- GRM
- 7.6
CMA / ARV
- ARV (median comp)
- $123,719
- List price
- $129,000
- Delta
- 4.27%
- Verdict
- FAIR
- Comps
- 20 within 1.0 mi
Show comp detail 12 sales within ~0.75 mi
| Address | Dist | Beds/Ba | Sqft | Sold | Price | $/sf | Match |
|---|---|---|---|---|---|---|---|
| 10749 Runningbrook Dr | 0.22mi | 4/1.0 (+1) | 1,062 (-1%) | 3mo | $155,000 | $146 | 78 |
| 338 Lancashire Rd | 0.51mi | 3/1.0 | 1,063 (-1%) | 0mo | $99,000 | $93 | 72 |
| 10519 Renfrew Dr | 0.29mi | 3/1.5 | 982 (-9%) | 2mo | $95,000 | $97 | 70 |
| 10555 Gourock Dr | 0.13mi | 3/2.0 | 918 (-15%) | 3mo | $120,000 | $131 | 65 |
| 314 Midlothian Rd | 0.49mi | 4/1.0 (+1) | 1,120 (+4%) | 3mo | $90,000 | $80 | 61 |
| 10501 Lilac Ave | 0.24mi | 3/1.0 | 932 (-13%) | 4mo | $74,900 | $80 | 61 |
| 10060 Valley Dr | 0.75mi | 2/1.0 (-1) | 1,056 (-2%) | 4mo | $59,900 | $57 | 52 |
| 518 Banavie Dr | 0.46mi | 3/2.0 | 932 (-13%) | 3mo | $65,000 | $70 | 51 |
| 534 Alcove Ave | 0.68mi | 3/1.0 | 996 (-7%) | 3mo | $104,200 | $105 | 51 |
| 448 Lancashire Rd | 0.48mi | 3/1.0 | 1,234 (+15%) | 4mo | $149,000 | $121 | 48 |
| 404 Lancashire Rd | 0.49mi | 4/1.0 (+1) | 1,215 (+13%) | 2mo | $39,900 | $33 | 47 |
| 10201 Gourock Dr | 0.64mi | 3/1.0 | 932 (-13%) | 3mo | $110,000 | $118 | 43 |
Match score weights: distance 35% · size 25% · config 20% · recency 20%. Top-matched comps best support the ARV.
Projected returns pro-forma
-3.0% appreciation · 6.59% rent growth · sell at horizon
- IRR
- -1.0%
- Equity multiple
- 0.96×
- Total profit
- $-1,394
- Equity at exit
- $19,234
- IRR
- 12.2%
- Equity multiple
- 2.12×
- Total profit
- $40,561
- Equity at exit
- $11,154
Cash invested: $36,120 (down + closing). Projections, not guarantees.
Landlord ↔ Tenant lean methodology
- Overall (STATE)
- 81 Strongly Landlord-Friendly
- State Missouri
- 81 Strongly Landlord-Friendly · R+10
- County
- — inherits STATE
- City
- — inherits STATE
ZIP-level market 63137
- Rents YoY
- 6.6%
- Active inventory
- 203
- Price-to-rent
- 7.6×
Monthly cashflow live
- Estimated rent
- $1,416 high interval (Pro) →
- Mortgage (P&I)
- −$676
- Tax from tax record
- −$165 /mo · $1,986/yr
- Insurance
- −$54
- HOA
- −$0
- Vacancy / Maint / Mgmt
- −$297
- Net cashflow
- $223
Break-even live
Sensitivity live
| Price | -10% $296 | -5% $259 | +0% $223 | +5% $186 | +10% $150 |
|---|---|---|---|---|---|
| Rent | -10% $111 | -5% $167 | +0% $223 | +5% $279 | +10% $335 |
| Rate | -1.0pp $288 | -0.5pp $256 | base $223 | +0.5pp $189 | +1.0pp $155 |
UW: 25.0% down · 7.5% · 30yr · 1.5% tax · 5.0% vac · 8.0% maint · 8.0% mgmt
Financing live
Cash to close
- Down payment
- $32,250
- Closing costs
- $3,870
- Reserves months
- —
- Total cash needed
- —
Loan-product check · same deal, 3 products live
Conventional
25% down · 7.5% · 30yr
- Down + closing
- —
- Monthly P&I
- —
- Monthly cashflow
- —
- DSCR
- —
- Eligible?
- —
Personal DTI + credit; lowest rate.
DSCR
20% down · 8.5% · 30yr
- Down + closing
- —
- Monthly P&I
- —
- Monthly cashflow
- —
- DSCR
- —
- Eligible?
- —
No personal income docs; deal must DSCR.
Hard money
10% down · 12.0% · 12mo
- Down + closing
- —
- Monthly P&I
- —
- Monthly cashflow
- —
- DSCR
- —
- Eligible?
- —
Short-term bridge; refi at stabilization.
Rent comps 40 comps
| Address | Beds | Baths | Sqft | Rent | $/sqft | DOM | Units | Dist |
|---|---|---|---|---|---|---|---|---|
| 10421 Gardo Ct Saint Louis, MO | 3.0 | 2.0 | 1000 | $1,395 | $1.40 | 15d | 1 | 0.25mi |
| 10524 Durness Dr Saint Louis, MO | 3.0 | 1.0 | 1000 | $1,250 | $1.25 | 44d | 1 | 0.28mi |
| 1205 Shepley Dr Saint Louis, MO | 3.0 | 1.0 | 901 | $1,350 | $1.50 | 44d | 1 | 0.28mi |
| 1205 Shepley Dr Saint Louis, MO | 3.0 | 1.0 | 901 | $1,325 | $1.47 | 24d | 1 | 0.28mi |
| 743 Shepley Dr Saint Louis, MO | 3.0 | 1.0 | 932 | $1,025 | $1.10 | 8d | 1 | 0.30mi |
| 10519 Renfrew Dr Saint Louis, MO | 3.0 | 1.5 | 982 | $1,399 | $1.42 | 44d | 1 | 0.31mi |
| 10518 Gretna Cir Saint Louis, MO | 3.0 | 1.0 | 1082 | $1,450 | $1.34 | 24d | 1 | 0.32mi |
| 10527 Prestwick Dr Saint Louis, MO | 3.0 | 2.0 | 854 | $1,395 | $1.63 | 8d | 1 | 0.32mi |
| 457 Shepley Dr Saint Louis, MO | 3.0 | 1.0 | 854 | $1,350 | $1.58 | 24d | 1 | 0.36mi |
| 409 Shepley Dr Saint Louis, MO | 3.0 | 1.0 | 854 | $1,095 | $1.28 | 5d | 1 | 0.40mi |
| 432 Midlothian Rd Saint Louis, MO | 3.0 | 1.0 | 1120 | $1,350 | $1.21 | 11d | 1 | 0.44mi |
| 10401 Hobkirk Dr Saint Louis, MO | 3.0 | 1.0 | 1050 | $1,500 | $1.43 | 18d | 1 | 0.46mi |
| 329 Midlothian Rd Saint Louis, MO | 3.0 | 1.0 | 854 | $1,195 | $1.40 | 4d | 1 | 0.47mi |
| 437 Lancashire Rd Saint Louis, MO | 3.0 | 1.0 | 1082 | $1,395 | $1.29 | 44d | 1 | 0.47mi |
| 815 Bella Ln Saint Louis, MO | 3.0 | 1.0 | 864 | $1,275 | $1.48 | 44d | 1 | 0.51mi |
| 323 Shepley Dr Saint Louis, MO | 3.0 | 1.0 | 850 | $1,175 | $1.38 | 3d | 1 | 0.51mi |
| 10617 Dunkeld Cir Saint Louis, MO | 3.0 | 1.0 | 873 | $1,299 | $1.49 | 8d | 1 | 0.52mi |
| 10617 Dunkeld Cir Saint Louis, MO | 3.0 | 1.0 | 873 | $1,299 | $1.49 | 44d | 1 | 0.52mi |
| 312 Banff Cir Saint Louis, MO | 3.0 | 1.0 | 854 | $1,175 | $1.38 | 24d | 1 | 0.52mi |
| 400 Lancashire Rd Saint Louis, MO | 3.0 | 1.0 | 1200 | $1,095 | $0.91 | 44d | 1 | 0.52mi |
| 808 Bella Ln Saint Louis, MO | 4.0 | 2.0 | 1300 | $1,650 | $1.27 | 18d | 1 | 0.52mi |
| 10650 Dunkeld Cir Saint Louis, MO | 3.0 | 1.0 | 854 | $1,250 | $1.46 | 8d | 1 | 0.55mi |
| 251 Midlothian Rd Saint Louis, MO | 3.0 | 1.0 | 1058 | $1,499 | $1.42 | 44d | 1 | 0.56mi |
| 10432 Balmoral Dr Saint Louis, MO | 4.0 | 1.0 | 826 | $1,600 | $1.94 | 2d | 1 | 0.59mi |
| 305 Lancashire Rd Saint Louis, MO | 3.0 | 1.0 | 854 | $1,100 | $1.29 | 18d | 1 | 0.59mi |
| 308 Lanark Rd Saint Louis, MO | 3.0 | 1.0 | 1154 | $1,400 | $1.21 | 24d | 1 | 0.61mi |
| 10213 Durness Dr Saint Louis, MO | 2.0 | 1.0 | 932 | $1,225 | $1.31 | 44d | 1 | 0.62mi |
| 10327 Renfrew Dr Saint Louis, MO | 3.0 | 1.0 | 844 | $1,199 | $1.42 | 44d | 1 | 0.62mi |
| 10309 Galloway Dr Saint Louis, MO | 3.0 | 1.0 | 892 | $1,295 | $1.45 | 13d | 1 | 0.63mi |
| 325 Caithness Rd Saint Louis, MO | 3.0 | 1.0 | 854 | $1,540 | $1.80 | 44d | 1 | 0.65mi |
| 325 Caithness Rd Saint Louis, MO | 3.0 | 1.0 | 854 | $1,425 | $1.67 | 13d | 1 | 0.65mi |
| 204 Tay Rd Saint Louis, MO | 4.0 | 1.5 | 854 | $1,500 | $1.76 | 18d | 1 | 0.65mi |
| 10203 Trio Ln Saint Louis, MO | 3.0 | 1.0 | 912 | $1,435 | $1.57 | 17d | 1 | 0.66mi |
| 10201 Gourock Dr Saint Louis, MO | 3.0 | 1.0 | 886 | $1,275 | $1.44 | 44d | 1 | 0.66mi |
| 257 Glen Garry Rd Saint Louis, MO | 3.0 | 1.0 | 873 | $1,025 | $1.17 | 15d | 1 | 0.67mi |
| 416 Crawford Rd Saint Louis, MO | 3.0 | 1.0 | 844 | $1,499 | $1.78 | 24d | 1 | 0.68mi |
| 241 Grampian Rd Saint Louis, MO | 3.0 | 1.0 | 837 | $1,250 | $1.49 | 44d | 1 | 0.68mi |
| 237 Grampian Rd Saint Louis, MO | 3.0 | 1.0 | 873 | $1,499 | $1.72 | 44d | 1 | 0.69mi |
| 317 Cameron Rd Saint Louis, MO | 3.0 | 1.0 | 854 | $1,350 | $1.58 | 24d | 1 | 0.71mi |
| 232 Cameron Rd Saint Louis, MO | 3.0 | 1.0 | 984 | $1,295 | $1.32 | 13d | 1 | 0.73mi |
Listing history 5 events
-
2026-06-13remarks 317-char remark
-
2026-05-16status Pending 304-char remark
-
2026-05-14$129,000 Active 304-char remark
-
2026-05-06historical $129,000 304-char remark
-
1999-08-03soldstatus $68,500
ⓘ Source: listings_history table (triggers on properties + properties_extension) + one-shot
backfill from property_details.listing_events for pre-trigger history.
Tax reassessment forecast MO · Resets to sale price
- Current annual tax
- $1,986 · $165/mo
- Projected year-2 tax
- $1,986 · $165/mo
- Expected delta
- $0/yr ($0/mo · 0.0%)
ⓘ Screening estimate from a state-policy table — verify with the county assessor before closing.
Climate risk First Street
- Flood 1/10 Low FEMA zone X (unshaded) · 0% chance over 30 yrs
- Wildfire 1/10 Low
- Heat 5/10 Major 7 d/yr ≥107°F today · 21 d/yr by 30 yrs out
- Wind 2/10 Low 100% chance of damaging wind over 30 yrs
- Air quality 4/10 Moderate 4 unhealthy d/yr today · 5 by 30 yrs out
Nearby sold comps map
Loading sold comps map…
Walkable amenities ~0.75 mi
Loading nearby amenities…
Taxation est. · year 1
- Rental income
- $16,990
- − Mortgage interest
- −$7,226
- − Property taxes
- −$1,986
- − Insurance
- −$645
- − Repairs & maintenance
- −$1,359
- − Management
- −$1,359
- − Depreciation
- −$3,753
- Taxable income
- $662
- Est. tax owed @ 24.0%
- −$159
- After-tax cash flow
- $2,514/yr
For passive investors: Depreciation is non-cash, so a rental often shows a tax loss while cash-flowing — sheltering income. Rental losses are passive: they offset passive income freely, and up to $25,000/yr can offset ordinary (W-2) income if you actively participate and your MAGI is under $100k (phasing out to $0 by $150k); unused losses carry forward. On sale, claimed depreciation is recaptured at up to 25%, and gains may owe capital-gains tax (a 1031 exchange can defer both). Figures are a year-1 estimate at your 24.0% rate — not tax advice; consult a CPA.
Schools (NCES district)
- District
- Riverview Gardens
- NCES district ID
- 2926670
- Math proficiency
- 2% ▼ -6.00%
- Reading proficiency
- 9% ▼ -6.00%
- Median HH income
- $32,759
- Composite
- 4.22/100
- National rank
- #10058
- State rank
- #324 of 324 in MO
Livability — Bellefontaine Neighbors
- Score
- 58/100
- State rank
- #592
- US rank
- #20944
Category grades
Schools grade is shown separately in the Schools card above.
Census & demographics
- Census place
- Bellefontaine Neighbors, MO
- County
- Saint Louis County · 888,823 people
- City population
- 19,684
- Metro
- St. Louis, MO-IL
- Population (ZIP)
- 19,684
- Household income
- $43,422
- Rent vs Own
- Severe rent burden
- 1863.0
Population outlook (St. Louis County) Hauer SSP2
- Today (2025)
- 1,025,227 people
- By 2030
- 1,028,023 · +0.3%
- By 2040
- 1,020,940 · -0.4%
- By 2050
- 1,007,280 · -1.8%
- By 2075
- 987,277 · -3.7%
- By 2100
- 921,984 · -10.1%
Race, ethnicity, and origin ACS 2023
- Neighborhood character
- Predominantly Black (82%)
- Race & ethnicity
- Black 82% White 13% Two or more races 3%
- Common ancestry
- Romanian 1% Lithuanian 1% Italian 1%
- Foreign-born
- 1%
Political lean MEDSL · St. Louis
- 2024 margin
- Strong D (+23.4) · D 60.8% · R 37.4% · Other 1.7%
- 2008→2024 swing
- +3.5pp toward D · 2008: 19.9pp · 2024: 23.4pp
- All cycles
- 2024: D+23.4 2020: D+24.0 2016: D+16.2 2012: D+13.7 2008: D+19.9
Not yet ingested
- Civics
- —
Market trends
- HPI YoY
- ▼ -96.70%
- Current HPI
- 130.6765
- Rent YoY
- ▲ 6.59%
- Metro
- St. Louis, MO-IL
- State GDP YoY
- ▲ 1.84%
- F500 in state
- 20
Industry mix (Fortune 500 HQ in MO)
| Industry | F500 HQs | Revenue |
|---|---|---|
| Healthcare | 1 | $163B |
|
||
| Insurance | 1 | $21B |
|
||
| Industrial Technology | 1 | $17B |
|
||
| Retail | 1 | $16B |
|
||
| Industrial Distribution | 1 | $10B |
|
||
| Utilities | 1 | $9B |
|
||
Price history
+88.3% since first listed4 events — show timeline
- 2026-05-16 Pending — MARIS as Distributed by MLS Grid
- 2026-05-14 Listed $129,000 MARIS as Distributed by MLS Grid
- 2026-05-06 Coming Soon — MARIS as Distributed by MLS Grid
- 1999-08-03 Sold (Public Records) $68,500 Public Records
Property tax history
+5.6%/yrLatest (2022): $1,986 · +0.9% YoY. Source: county tax records.
Cash-flow waterfall
monthlySold comps — $/sqft
last 12 mo · ≤1 miLoading sold comps…