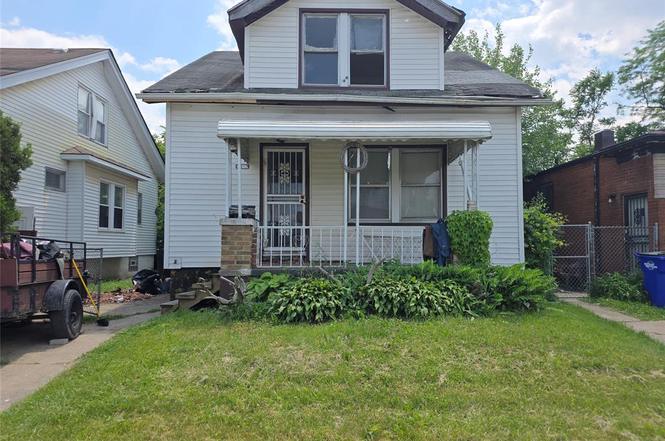
2317 La Belle St · Detroit, MI
Flood risk 1/10 · Minimal
- FEMA flood zone
- X (unshaded)
- Chance of flooding over 30 yrs
- 0.0%
- Est. flood insurance / yr
- $473 – $860
Fire risk 1/10 · Minimal
- Est. fire insurance / yr
- $784 – $1,456
Heat risk 3/10 · Minor
- Hot days now (above 97°F)
- 7 days/yr
- Hot days in 30 yrs
- 15 days/yr
Wind risk 2/10 · Minimal
- Chance of severe wind over 30 yrs
- —
Air-quality risk 4/10 · Minor
- Unhealthy air days now
- 4 days/yr
- Unhealthy air days in 30 yrs
- 6 days/yr
Risk factors via First Street. Map © Google.
Why this score? — see what drove the B- grade
The composite is a weighted blend of 9 inputs, each scored 0–100. Each bar is that input's sub-score; the figure is the points it added to the 100-point composite (weight × sub-score).
- Cash flow +30.0/30.0
- 1% rule +10.0/10.0
- DSCR +10.0/10.0
- ARV discount +5.2/15.0
- Rent growth +4.0/5.0
- Livability +3.7/5.0
- Condition / age +2.5/5.0
- Schools +1.3/10.0
- Appreciation +0.0/10.0
$40,000
🖨 Deal sheet 📄 Offer letter ✓ Due diligence
Listing remarks
* * OPPORTUNITY * * Three bedroom bungalow right off the expressway! Priced for a quick sale - Great rental opportunity! The current occupant is a house sitter. Property will be provided vacant and cleaned out at closing. Clear title with warranty deed and title insurance. Buyer to verify all information, taxes, room sizes, etc. Buyer to pay 495 compliance to list office.
Key facts
- 3,485 sq ft lot
- Built 1925
- Listed 3 days
Property features AI
Exterior
- Parking: No garage
- Utilities: Public water; Public sewer
- Home design: Single-family residence; One and one-half stories; Ground-level entry with steps; Vinyl siding exterior
- Construction: Block foundation
- Exterior features: Paved road access; Lot approximately 0.08 acres (35 x 100)
Interior
- Bedrooms: 3 total rooms (includes bedrooms and living space)
- Bathrooms: 1 full bathroom
- Heating & cooling: Forced air heating (natural gas); No air conditioning
- Interior features: Full unfinished basement; Awning(s); Front porch
Neighborhood map
What this means for you Summary
Snapshot
- This is a 3-bed/1.0-bath single-family listed at $40k.
Deal economics
- At list price, monthly cash flow is $594 ($7k/yr) — positive.
- The deal already cash-flows at list — no discount required.
- Meets the 1% rule at list price ($1k rent vs $40k).
- Cap rate 24.1% vs local median 10.2% in Detroit — top-decile yield for the area; either an underpriced asset or a hidden risk that comps aren't pricing in. Stress-test before assuming the spread holds.
Location & tenants
- Location reads 73/100 on livability (#218 in MI) — a middle-class / working-renter tenant base. Strengths: amenities A+, commute A+, cost of living A+; Watch: schools F, crime F, employment F.
- Detroit Public Schools Community District (urban): math 10% / reading 24% proficiency, ranked #499 of 540 in MI (top 92%) — low school quality limits family demand, transient renter base, plan for 1-2y turnover; 90% free/reduced lunch — lower-income household profile, screen leases tightly.
- Market conditions: Rents rising fast (+6.1%/yr); 346 active listings in the ZIP; 40 comparable units currently listed for rent nearby; rentals at typical pace (median 25d on market — plan ~3-4 weeks tenant-placement turnaround); 45% of comp listings sitting > 30 days — soft ceiling on asking rent; lower-income renter base — watch delinquency; 2,639 units permitted in Wayne County in 2024 (1,216 in 5+ unit buildings).
- This rent runs 43% of the median local income ($33k/yr) — at the standard rent-burdened threshold; future hikes will face affordability resistance.
Forward outlook
- Local home prices are declining (-3.0%/yr); year-one equity from $277 of loan paydown is wiped out by about $1k of value loss. Plan a longer hold.
- Wayne County population projected at -17% by 2050 — secular population decline; favor cash flow + early exit over multi-decade hold.
- At projected returns (-3.0% appreciation + 6.1% rent growth), your $11k cash investment doubles in ~2 years — after that, you're playing with house money.
Negotiation context
- Only 4 days on market — expect competitive offers; lowballing is unlikely to land.
- 3 sale attempts since 13y ago with the ask held roughly flat each time — persistent listings suggest the price (not the market) is what's stuck; bring a comps-based counter.
Risks & watch-outs
- Watch-outs: property tax is 3.6% of price; built in 1925 — expect roof / HVAC / electrical / plumbing capex.
Questions for the listing agent
- Built in 1925 — when were the roof, HVAC, electrical panel, plumbing, and water heater last replaced?
- Property tax is high relative to price — has the assessment been appealed recently, and will the sale trigger a re-assessment?
- Is there a deadline driving the sale (1031 exchange, divorce, estate, relocation)? That informs how much negotiation room exists.
- Schools are F-rated, which usually means shorter tenancies and higher turnover. Who's the typical renter profile here, and what's been the actual vacancy rate?
- Crime grade is F in this area — have there been break-ins, vandalism, or insurance claims at this property in the last 3 years? What carrier currently insures it and at what premium?
- What's the average days-on-market for RENTAL listings here right now (not sales)? A rising rental-DOM trend means longer vacancies and softer asking-rent achievability than the comps imply.
- What's the recent tenant-quality profile in this submarket — average credit score on applications, eviction rate, late-payment / NSF rate, and stable-employment percentage? A property-management company in the area should have these aggregated.
- How much new for-sale + rental construction is in the pipeline within 1–3 miles? Heavy new supply typically softens prices + rents 12–24 months out; constrained supply supports both.
Investment metrics
- 1% rule
- 2.97% ✓
- Cap rate
- 24.12%
- Cash-on-cash
- 63.68%
- DSCR
- 3.83
- GRM
- 2.8
CMA / ARV
- ARV (on-the-fly)
- $38,080
- Comps found
- 12
Show comp detail 12 sales within ~0.75 mi
| Address | Dist | Beds/Ba | Sqft | Sold | Price | $/sf | Match |
|---|---|---|---|---|---|---|---|
| 2505 La Belle St | 0.16mi | 3/1.0 | 1,027 (-6%) | 2mo | $25,000 | $24 | 82 |
| 2474 Sturtevant St | 0.66mi | 3/1.0 | 1,092 (+0%) | 4mo | $28,000 | $26 | 65 |
| 15560 La Salle Blvd | 0.62mi | 3/1.0 | 1,022 (-6%) | 1mo | $35,000 | $34 | 60 |
| 2268 Highland St | 0.71mi | 3/1.0 | 1,163 (+7%) | 0mo | $10,000 | $9 | 55 |
| 15834 Baylis St | 0.74mi | 3/1.0 | 1,065 (-2%) | 10mo | $111,500 | $105 | 54 |
| 15512 Log Cabin St | 0.54mi | 3/1.5 | 1,122 (+3%) | 19mo | $17,000 | $15 | 52 |
| 15532 Baylis St | 0.58mi | 3/1.0 | 968 (-11%) | 12mo | $33,500 | $35 | 45 |
| 15768 Wabash St | 0.74mi | 3/1.0 | 1,000 (-8%) | 15mo | $30,000 | $30 | 39 |
| 15611 Baylis St | 0.66mi | 3/1.0 | 968 (-11%) | 15mo | $38,500 | $40 | 39 |
| 1931 Pilgrim St | 0.66mi | 3/1.0 | 931 (-14%) | 13mo | $65,000 | $70 | 34 |
| 2075 Ewald Cir | 0.63mi | 2/1.0 (-1) | 949 (-13%) | 19mo | $70,000 | $74 | 29 |
| 2081 Ewald Cir | 0.64mi | 2/1.0 (-1) | 957 (-12%) | 20mo | $65,000 | $68 | 29 |
Match score weights: distance 35% · size 25% · config 20% · recency 20%. Top-matched comps best support the ARV.
Projected returns pro-forma
-3.0% appreciation · 6.14% rent growth · sell at horizon
- IRR
- 66.6%
- Equity multiple
- 4.15×
- Total profit
- $35,311
- Equity at exit
- $5,964
- IRR
- 71.9%
- Equity multiple
- 9.63×
- Total profit
- $96,710
- Equity at exit
- $3,458
Cash invested: $11,200 (down + closing). Projections, not guarantees.
Landlord ↔ Tenant lean methodology
- Overall (STATE)
- 62 Landlord-Friendly
- State Michigan
- 62 Landlord-Friendly · EVEN
- County
- — inherits STATE
- City
- — inherits STATE
ZIP-level market 48238
- Home prices YoY
- -14.4%
- Rents YoY
- 6.1%
- Active inventory
- 346
- Price-to-rent
- 2.8×
Monthly cashflow live
- Estimated rent
- $1,190 high interval (Pro) →
- Mortgage (P&I)
- −$210
- Tax from tax record
- −$119 /mo · $1,430/yr
- Insurance
- −$17
- HOA
- −$0
- Vacancy / Maint / Mgmt
- −$250
- Net cashflow
- $594
Break-even live
UW: 25.0% down · 7.5% · 30yr · 1.5% tax · 5.0% vac · 8.0% maint · 8.0% mgmt
Financing live
Cash to close
- Down payment
- $10,000
- Closing costs
- $1,200
- Reserves months
- —
- Total cash needed
- —
Loan-product check · same deal, 3 products live
Conventional
25% down · 7.5% · 30yr
- Down + closing
- —
- Monthly P&I
- —
- Monthly cashflow
- —
- DSCR
- —
- Eligible?
- —
Personal DTI + credit; lowest rate.
DSCR
20% down · 8.5% · 30yr
- Down + closing
- —
- Monthly P&I
- —
- Monthly cashflow
- —
- DSCR
- —
- Eligible?
- —
No personal income docs; deal must DSCR.
Hard money
10% down · 12.0% · 12mo
- Down + closing
- —
- Monthly P&I
- —
- Monthly cashflow
- —
- DSCR
- —
- Eligible?
- —
Short-term bridge; refi at stabilization.
Rent comps 40 comps
| Address | Beds | Baths | Sqft | Rent | $/sqft | DOM | Units | Dist |
|---|---|---|---|---|---|---|---|---|
| 2433 Pasadena St Unit 2435 Detroit, MI | 2.0 | 1.0 | 700 | $1,025 | $1.46 | 44d | 1 | 0.15mi |
| 13639 La Salle Blvd Detroit, MI | 2.0 | 1.0 | 800 | $695 | $0.87 | 11d | 1 | 0.18mi |
| 1926 Clements St Unit 1926 Detroit, MI | 3.0 | 1.0 | 1150 | $1,250 | $1.09 | 20d | 1 | 0.29mi |
| 1926 Clements St Detroit, MI | 3.0 | 1.0 | 1150 | $1,150 | $1.00 | 5d | 1 | 0.29mi |
| 2474 Fullerton St Detroit, MI | 3.0 | 1.0 | 1400 | $1,300 | $0.93 | 15d | 1 | 0.60mi |
| 2034 Ewald Cir Detroit, MI | 2.0 | 1.0 | 1000 | $995 | $0.99 | 5d | 1 | 0.61mi |
| 15345 Parkside St Detroit, MI | 3.0 | 1.0 | 1152 | $1,300 | $1.13 | 44d | 1 | 0.71mi |
| 2676 Sturtevant St Unit 1 Detroit, MI | 2.0 | 1.0 | 1000 | $1,000 | $1.00 | 24d | 1 | 0.73mi |
| 2285 Cortland St Detroit, MI | 2.0 | 1.0 | 900 | $1,000 | $1.11 | 17d | 1 | 0.78mi |
| 2638 Richton St Unit 2638 Richton Upper Detroit, MI | 2.0 | 1.0 | 1000 | $900 | $0.90 | 44d | 1 | 0.83mi |
| 3812 W Grand St Detroit, MI | 2.0 | 1.0 | 1100 | $1,025 | $0.93 | 17d | 1 | 0.87mi |
| 3740 Tyler St Unit 1 Detroit, MI | 3.0 | 1.0 | 1300 | $1,300 | $1.00 | 5d | 1 | 0.87mi |
| 3783 Tyler St Unit Lower Detroit, MI | 3.0 | 1.0 | 1000 | $1,150 | $1.15 | 44d | 1 | 0.92mi |
| 3824 Tyler St Apt 1 Detroit, MI | 3.0 | 1.0 | 900 | $1,523 | $1.69 | 17d | 1 | 0.94mi |
| 15906 Alden St Detroit, MI | 3.0 | 1.0 | 1030 | $1,150 | $1.12 | 17d | 1 | 0.95mi |
| 4045 Clements St Detroit, MI | 3.0 | 1.0 | 850 | $1,150 | $1.35 | 24d | 1 | 0.96mi |
| 4045 Clements St Detroit, MI | 3.0 | 1.0 | 850 | $1,150 | $1.35 | 44d | 1 | 0.96mi |
| 326 Eason St Highland Park, MI | 3.0 | 1.0 | 1256 | $1,300 | $1.04 | 17d | 1 | 0.98mi |
| 2023 Tuxedo St Detroit, MI | 2.0 | 1.0 | 950 | $1,050 | $1.11 | 24d | 1 | 1.01mi |
| 16174 Princeton St Unit 2 Detroit, MI | 2.0 | 1.0 | 985 | $1,100 | $1.12 | 44d | 1 | 1.02mi |
| 16174 Princeton St Detroit, MI | 2.0 | 1.0 | 985 | $1,100 | $1.12 | 19d | 1 | 1.02mi |
| 3224 Monterey St Unit 2E Detroit, MI | 2.0 | 1.0 | 1200 | $1,350 | $1.12 | 44d | 1 | 1.02mi |
| 4203 Tyler St Detroit, MI | 2.0 | 1.0 | 950 | $895 | $0.94 | 44d | 1 | 1.09mi |
| 4287 W Grand St Unit 4289 Detroit, MI | 3.0 | 1.0 | 1250 | $1,000 | $0.80 | 44d | 1 | 1.11mi |
| 127 W Buena Vista St Unit 129 Highland Park, MI | 2.0 | 1.0 | 800 | $1,000 | $1.25 | 44d | 1 | 1.11mi |
| 2634 Lawrence St Detroit, MI | 3.0 | 1.5 | 1388 | $1,600 | $1.15 | 2d | 1 | 1.19mi |
| 4336 Buena Vista St Detroit, MI | 3.0 | 1.0 | 1300 | $1,100 | $0.85 | 44d | 1 | 1.22mi |
| 27 Pasadena St Highland Park, MI | 2.0 | 1.0 | 900 | $825 | $0.92 | 44d | 1 | 1.22mi |
| 2690 Ewald Cir Detroit, MI | 1.0–2.0 | 1.0 | 750 | $900 | $1.20 | 24d | 4 | 1.26mi |
| 64 Glendale St Highland Park, MI | 4.0 | 1.0 | 1464 | $1,500 | $1.02 | 10d | 1 | 1.26mi |
| 4268 Cortland St Unit 1 Detroit, MI | 2.0 | 1.0 | 1000 | $1,050 | $1.05 | 44d | 1 | 1.30mi |
| 16927 Inverness St Detroit, MI | 2.0 | 1.0 | 897 | $1,650 | $1.84 | 17d | 1 | 1.31mi |
| 2045 Calvert St Detroit, MI | 2.0 | 2.0 | 1400 | $1,600 | $1.14 | 44d | 1 | 1.32mi |
| 1929 Calvert Ave Unit 2 Detroit, MI | 3.0 | 1.0 | 1414 | $1,199 | $0.85 | 15d | 1 | 1.34mi |
| 2653 Calvert Ave Unit 1 Detroit, MI | 3.0 | 1.0 | 1305 | $1,200 | $0.92 | 44d | 1 | 1.35mi |
| 2521 W McNichols Rd Unit B2 Detroit, MI | 2.0 | 1.0 | 1300 | $1,250 | $0.96 | 44d | 1 | 1.36mi |
| 2727 Calvert Ave Unit 1 Detroit, MI | 3.0 | 1.5 | 1350 | $1,200 | $0.89 | 44d | 1 | 1.36mi |
| 2925 Calvert St Detroit, MI | 3.0 | 1.0 | 1400 | $1,300 | $0.93 | 17d | 1 | 1.38mi |
| 7350 Globe St Detroit, MI | 3.0 | 1.0 | 1000 | $1,550 | $1.55 | 3d | 1 | 1.40mi |
| 3224 Calvert St Detroit, MI | 3.0 | 1.0 | 1150 | $1,150 | $1.00 | 44d | 1 | 1.41mi |
Listing history 5 events
-
2026-06-18days on market $40,000 Active 4 DOM
-
2026-06-17days on market $40,000 Active 3 DOM
-
2026-06-16days on market $40,000 Active 2 DOM
-
2026-06-15remarks 377-char remark
-
2026-06-15$40,000 Active 1 DOM
ⓘ Source: listings_history table (triggers on properties + properties_extension) + one-shot
backfill from property_details.listing_events for pre-trigger history.
Tax reassessment forecast MI · Partial reset (capped growth)
- Current annual tax
- $1,430 · $119/mo
- Projected year-2 tax
- $1,430 · $119/mo
- Expected delta
- $0/yr ($0/mo · 0.0%)
ⓘ Screening estimate from a state-policy table — verify with the county assessor before closing.
Climate risk First Street
- Flood 1/10 Low FEMA zone X (unshaded) · 0% chance over 30 yrs
- Wildfire 1/10 Low
- Heat 3/10 Moderate 7 d/yr ≥97°F today · 15 d/yr by 30 yrs out
- Wind 2/10 Low
- Air quality 4/10 Moderate 4 unhealthy d/yr today · 6 by 30 yrs out
Nearby sold comps map
Loading sold comps map…
Walkable amenities ~0.75 mi
Loading nearby amenities…
Taxation est. · year 1
- Rental income
- $14,277
- − Mortgage interest
- −$2,241
- − Property taxes
- −$1,430
- − Insurance
- −$200
- − Repairs & maintenance
- −$1,142
- − Management
- −$1,142
- − Depreciation
- −$1,164
- Taxable income
- $6,959
- Est. tax owed @ 24.0%
- −$1,670
- After-tax cash flow
- $5,462/yr
For passive investors: Depreciation is non-cash, so a rental often shows a tax loss while cash-flowing — sheltering income. Rental losses are passive: they offset passive income freely, and up to $25,000/yr can offset ordinary (W-2) income if you actively participate and your MAGI is under $100k (phasing out to $0 by $150k); unused losses carry forward. On sale, claimed depreciation is recaptured at up to 25%, and gains may owe capital-gains tax (a 1031 exchange can defer both). Figures are a year-1 estimate at your 24.0% rate — not tax advice; consult a CPA.
Schools (NCES district)
- District
- Detroit Public Schools Community District
- NCES district ID
- 2601103
- Math proficiency
- 10% ▼ -2.00%
- Reading proficiency
- 24% ▲ 6.00%
- Median HH income
- $25,815
- Composite
- 13.06/100
- National rank
- #9564
- State rank
- #499 of 540 in MI
Livability — Detroit
- Score
- 73/100
- State rank
- #218
- US rank
- #5427
Category grades
Schools grade is shown separately in the Schools card above.
Census & demographics
- Census place
- Detroit, MI
- County
- Wayne County · 1,562,939 people
- City population
- 572,865
- Metro
- Detroit-Warren-Dearborn, MI
- Population (ZIP)
- 24,731
- Household income
- $33,315
- Rent vs Own
- Severe rent burden
- 2172.0
Population outlook (Wayne County) Hauer SSP2
- Today (2025)
- 1,675,273 people
- By 2030
- 1,620,300 · -3.3%
- By 2040
- 1,502,341 · -10.3%
- By 2050
- 1,384,039 · -17.4%
- By 2075
- 1,124,592 · -32.9%
- By 2100
- 881,193 · -47.4%
Race, ethnicity, and origin ACS 2023
- Neighborhood character
- Predominantly Black (94%)
- Race & ethnicity
- Black 94% Two or more races 3% White 1%
- Foreign-born
- 1%
Political lean MEDSL · Wayne
- 2024 margin
- Strong D (+29.0) · D 62.7% · R 33.7% · Other 3.6%
- 2008→2024 swing
- -20.5pp toward R · 2008: 49.5pp · 2024: 29.0pp
- All cycles
- 2024: D+29.0 2020: D+38.1 2016: D+37.3 2012: D+46.9 2008: D+49.5
Not yet ingested
- Civics
- —
Market trends
- HPI YoY
- ▼ -31.96%
- Current HPI
- 189.6227
- Rent YoY
- ▲ 6.14%
- Metro
- Detroit-Warren-Dearborn, MI
- State GDP YoY
- ▲ 1.37%
- F500 in state
- 28
Industry mix (Fortune 500 HQ in MI)
| Industry | F500 HQs | Revenue |
|---|---|---|
| Automotive Parts | 3 | $48B |
|
||
| Automotive | 2 | $372B |
|
||
| Chemicals | 1 | $45B |
|
||
| Automotive Retail | 1 | $29B |
|
||
| Healthcare / Medical Devices | 1 | $23B |
|
||
| Automotive Technology | 1 | $20B |
|
||
Price history
-41.6% since first listed6 events — show timeline
- 2026-06-15 Listed $40,000 REALCOMP
- 2013-05-30 Listing Removed — REALCOMP
- 2013-05-30 Listing Removed — MiRealSource-MiMLS
- 2013-03-27 Listed $2,500 REALCOMP
- 2013-03-27 Listed $2,500 MiRealSource-MiMLS
- 2006-07-21 Sold (Public Records) $68,500 Public Records
Property tax history
+15.4%/yrLatest (2025): $1,430 · +0.2% YoY. Source: county tax records.
Cash-flow waterfall
monthlySold comps — $/sqft
last 12 mo · ≤1 miLoading sold comps…