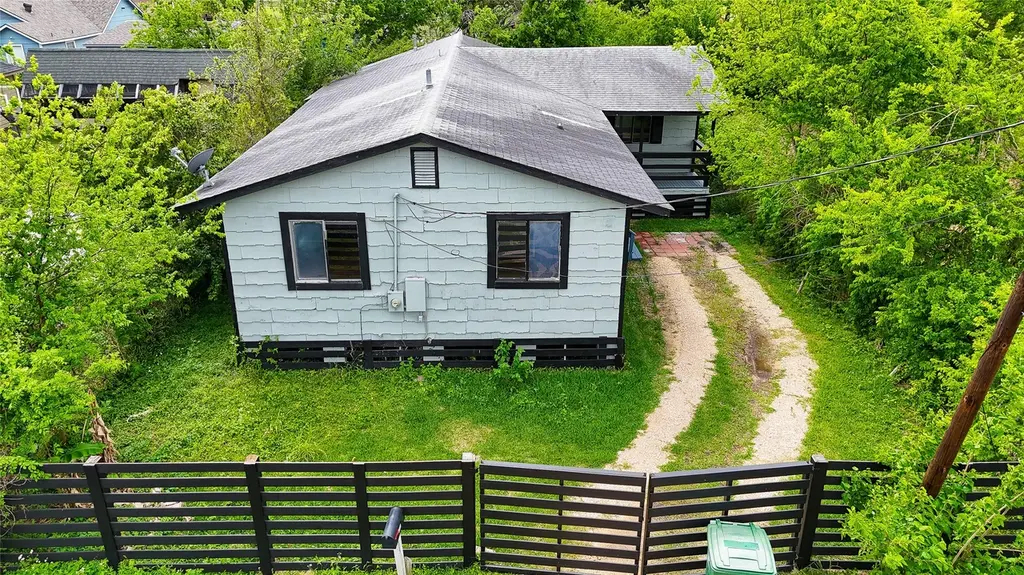
4909 Falls St · Houston, TX
Flood risk 7/10 · Major
- FEMA flood zone
- AE
- Chance of flooding over 30 yrs
- 0.95%
- Est. flood insurance / yr
- $1,737 – $8,500
Fire risk 1/10 · Minimal
- Est. fire insurance / yr
- $1,222 – $2,270
Heat risk 9/10 · Severe
- Hot days now (above 109°F)
- 7 days/yr
- Hot days in 30 yrs
- 21 days/yr
Wind risk 9/10 · Severe
- Chance of severe wind over 30 yrs
- 99.0%
Air-quality risk 3/10 · Minor
- Unhealthy air days now
- 2 days/yr
- Unhealthy air days in 30 yrs
- 3 days/yr
Risk factors via First Street. Map © Google.
Why this score? — see what drove the A- grade
The composite is a weighted blend of 9 inputs, each scored 0–100. Each bar is that input's sub-score; the figure is the points it added to the 100-point composite (weight × sub-score).
- Cash flow +29.6/30.0
- ARV discount +15.0/15.0
- DSCR +10.0/10.0
- 1% rule +9.0/10.0
- Appreciation +6.9/10.0
- Livability +3.7/5.0
- Rent growth +3.3/5.0
- Schools +2.7/10.0
- Condition / age +2.5/5.0
$120,000
🖨 Deal sheet 📄 Offer letter ✓ Due diligence
Listing remarks MLS
Priced to sell and packed with potential, this investment opportunity is ideal for a creative investor ready to bring their vision to life. This home needs a little TLC, but the possibilities are endless. Whether you’re looking to renovate and resell, add to your rental portfolio, or create something unique, this property offers a great chance to build value.
Key facts
- 5,000 sq ft lot
- Built 1986
- Listed 72 days
Neighborhood map
What this means for you Summary
Snapshot
- This is a 3-bed/2.0-bath single-family listed at $120k.
Deal economics
- At list price, monthly cash flow is $5 ($64/yr) — positive.
- The deal already cash-flows at list — no discount required.
- Meets the 1% rule at list price ($2k rent vs $120k).
- Recommended offer: $113k (6.0% below list) — sets the bar for market timing.
- Cap rate 10.6% vs local median 3.2% in Houston — top-decile yield for the area; either an underpriced asset or a hidden risk that comps aren't pricing in. Stress-test before assuming the spread holds.
Location & tenants
- Location reads 74/100 on livability (#184 in TX, #4,771 nationally) — a middle-class / working-renter tenant base. Strengths: amenities A+, cost of living A+, housing A+; Watch: schools D, crime F.
- Houston ISD (urban): math 27% / reading 35% proficiency, ranked #593 of 826 in TX (top 72%) — families likely to look elsewhere, expect single-tenant / working-renter base with shorter leases; 71% free/reduced lunch — lower-income household profile, screen leases tightly.
- Market conditions: Rents rising (+3.1%/yr); 445 active listings in the ZIP; 15 comparable units currently listed for rent nearby; rentals lingering (median 44d on market — plan ~5-8 weeks vacancy on turnover, expect pricing pressure); 67% of comp listings sitting > 30 days — soft ceiling on asking rent; lower-income renter base — watch delinquency; 29,883 units permitted in Harris County in 2024 (8,621 in 5+ unit buildings).
- At $1,683/mo this rent would consume 52% of the median local household income ($39k/yr) (locally 1531% of renters already pay >50% of income on rent) — very limited rent-growth headroom before tenants either downsize or default.
Forward outlook
- In year one you build about $6k of equity ($830 loan paydown + $5k appreciation (3.9% local appreciation)).
- Harris County population projected at +47% by 2050 — long-run rental-demand tailwind backs the buy-and-hold thesis.
- At projected returns (3.9% appreciation + 3.1% rent growth), your $34k cash investment doubles in ~6 years — after that, you're playing with house money.
- By year 7, paydown + projected appreciation supports a ~$35k cash-out refi (75% LTV) — recoverable capital for the next deal without selling this one.
Negotiation context
- It's been on market 72 days — a 6% lower offer ($113k) is reasonable based on typical stale-listing flexibility.
- 2 sale attempts; this cycle's ask has dropped $30k (20%) from the opening price — seller is motivated, your offer sets the floor, not the list.
Risks & watch-outs
- Watch-outs: flood insurance adds $427/mo.
- Climate carrying-cost: in FEMA flood zone AE (mandatory federal flood insurance); severe wind risk, 99% chance of damaging wind over 30y; extreme-heat days projected 7→21/yr by 2055 (HVAC capex compounding) — expect insurance premiums to compound above CPI over the hold.
Questions for the listing agent
- It's been on market 72 days. Have you received any prior offers? Is the seller open to a 6% concession, seller financing, or rate buy-down credit?
- What's the actual annual flood-insurance premium (NFIP or private), and is the property in a SFHA with mandatory coverage?
- Why hasn't it sold? Are there any deal-killer items the seller is aware of (foundation, flood, title, zoning, code violations)?
- Is there a deadline driving the sale (1031 exchange, divorce, estate, relocation)? That informs how much negotiation room exists.
- Schools are D-rated, which usually means shorter tenancies and higher turnover. Who's the typical renter profile here, and what's been the actual vacancy rate?
- Crime grade is F in this area — have there been break-ins, vandalism, or insurance claims at this property in the last 3 years? What carrier currently insures it and at what premium?
- What's the average days-on-market for RENTAL listings here right now (not sales)? A rising rental-DOM trend means longer vacancies and softer asking-rent achievability than the comps imply.
- What's the recent tenant-quality profile in this submarket — average credit score on applications, eviction rate, late-payment / NSF rate, and stable-employment percentage? A property-management company in the area should have these aggregated.
- How much new for-sale + rental construction is in the pipeline within 1–3 miles? Heavy new supply typically softens prices + rents 12–24 months out; constrained supply supports both.
Investment metrics
- 1% rule
- 1.40% ✓
- Cap rate
- 10.61%
- Cash-on-cash
- 15.42%
- DSCR
- 1.69
- GRM
- 5.9
CMA / ARV
- ARV (median comp)
- $168,645
- List price
- $120,000
- Delta
- -28.84%
- Verdict
- UNDERPRICED
- Comps
- 20 within 1.0 mi
Show comp detail 12 sales within ~0.75 mi
| Address | Dist | Beds/Ba | Sqft | Sold | Price | $/sf | Match |
|---|---|---|---|---|---|---|---|
| 5113 Hirsch Rd | 0.21mi | 2/2.0 (-1) | 1,555 (+3%) | 13mo | $90,000 | $58 | 70 |
| 3409 Lebadie St | 0.22mi | 3/2.0 | 1,388 (-8%) | 17mo | $250,000 | $180 | 61 |
| 3317 Le Badie St | 0.26mi | 3/1.5 | 1,660 (+10%) | 11mo | $175,500 | $106 | 60 |
| 4105 Hirsch Rd | 0.53mi | 3/2.0 | 1,575 (+4%) | 13mo | $165,000 | $105 | 58 |
| 4622 Russell St | 0.18mi | 4/1.5 (+1) | 1,732 (+14%) | 5mo | $80,000 | $46 | 57 |
| 4315 Fairbanks St | 0.41mi | 2/1.5 (-1) | 1,465 (-3%) | 14mo | $100,000 | $68 | 57 |
| 3317 Cavalcade St | 0.42mi | 4/2.0 (+1) | 1,698 (+12%) | 4mo | $280,000 | $165 | 52 |
| 4014 Linder St | 0.60mi | 3/2.0 | 1,617 (+7%) | 10mo | $299,000 | $185 | 52 |
| 4921 Kashmere St | 0.40mi | 2/1.0 (-1) | 1,332 (-12%) | 0mo | $109,500 | $82 | 52 |
| 5809 Kashmere St | 0.62mi | 3/1.5 | 1,618 (+7%) | 7mo | $69,000 | $43 | 51 |
| 4034 Caplin St | 0.71mi | 3/2.0 | 1,708 (+13%) | 0mo | $205,000 | $120 | 45 |
| 3918 Falls St | 0.66mi | 3/2.0 | 1,330 (-12%) | 11mo | $229,999 | $173 | 40 |
Match score weights: distance 35% · size 25% · config 20% · recency 20%. Top-matched comps best support the ARV.
Projected returns pro-forma
3.89% appreciation · 3.08% rent growth · sell at horizon
- IRR
- 10.4%
- Equity multiple
- 1.63×
- Total profit
- $21,025
- Equity at exit
- $60,091
- IRR
- 12.4%
- Equity multiple
- 3.03×
- Total profit
- $68,176
- Equity at exit
- $97,690
Cash invested: $33,600 (down + closing). Projections, not guarantees.
Landlord ↔ Tenant lean methodology
- Overall (STATE)
- 87 Strongly Landlord-Friendly
- State Texas
- 87 Strongly Landlord-Friendly · R+5
- County
- — inherits STATE
- City
- — inherits STATE
ZIP-level market 77026
- Home prices YoY
- 1.5%
- Rents YoY
- 3.1%
- Active inventory
- 445
- Price-to-rent
- 5.9×
Monthly cashflow live
- Estimated rent
- $1,683 high interval (Pro) →
- Mortgage (P&I)
- −$629
- Tax from tax record
- −$219 /mo · $2,624/yr
- Insurance
- −$50
- Flood insurance flood zone
- −$427 /mo · $5,118/yr
- HOA
- −$0
- Vacancy / Maint / Mgmt
- −$354
- Net cashflow
- $5
Break-even live
UW: 25.0% down · 7.5% · 30yr · 1.5% tax · 5.0% vac · 8.0% maint · 8.0% mgmt
Financing live
Cash to close
- Down payment
- $30,000
- Closing costs
- $3,600
- Reserves months
- —
- Total cash needed
- —
Loan-product check · same deal, 3 products live
Conventional
25% down · 7.5% · 30yr
- Down + closing
- —
- Monthly P&I
- —
- Monthly cashflow
- —
- DSCR
- —
- Eligible?
- —
Personal DTI + credit; lowest rate.
DSCR
20% down · 8.5% · 30yr
- Down + closing
- —
- Monthly P&I
- —
- Monthly cashflow
- —
- DSCR
- —
- Eligible?
- —
No personal income docs; deal must DSCR.
Hard money
10% down · 12.0% · 12mo
- Down + closing
- —
- Monthly P&I
- —
- Monthly cashflow
- —
- DSCR
- —
- Eligible?
- —
Short-term bridge; refi at stabilization.
Rent comps 15 comps
| Address | Beds | Baths | Sqft | Rent | $/sqft | DOM | Units | Dist |
|---|---|---|---|---|---|---|---|---|
| 4711 Sayers St Unit A Houston, TX | 2.0 | 1.0 | 1200 | $1,650 | $1.38 | 43d | 1 | 0.11mi |
| 4030 Reid St Houston, TX | 3.0 | 2.0 | 1680 | $2,000 | $1.19 | 43d | 1 | 0.68mi |
| 5414 Pardee St Houston, TX | 3.0 | 2.0 | 1100 | $1,500 | $1.36 | 43d | 1 | 0.88mi |
| 2516 Ivy St Houston, TX | 3.0 | 1.0 | 1200 | $1,500 | $1.25 | 43d | 1 | 0.92mi |
| 5435 Pardee St Houston, TX | 2.0 | 1.0 | 1634 | $1,000 | $0.61 | 43d | 1 | 0.97mi |
| 5124 Gold St Unit B Houston, TX | 3.0 | 2.5 | 1650 | $1,895 | $1.15 | 43d | 1 | 0.99mi |
| 3812 Lynnfield St Houston, TX | 3.0 | 2.0 | 1298 | $1,545 | $1.19 | 5d | 1 | 1.06mi |
| 3810 Lynnfield St Houston, TX | 3.0 | 2.0 | 1298 | $1,599 | $1.23 | 14d | 1 | 1.06mi |
| 3503 Wyrick St Houston, TX | 3.0 | 2.5 | 1746 | $2,850 | $1.63 | 43d | 1 | 1.13mi |
| 4626 Shreveport Blvd Unit B Houston, TX | 3.0 | 2.0 | 1150 | $1,490 | $1.30 | 13d | 1 | 1.16mi |
| 4509 Courtney St Houston, TX | 4.0 | 1.0 | 1456 | $1,150 | $0.79 | 21d | 1 | 1.29mi |
| 1524 Evelyn St Houston, TX | 3.0 | 2.5 | 1804 | $2,800 | $1.55 | 43d | 1 | 1.31mi |
| 3910 Woolworth St Houston, TX | 3.0 | 2.0 | 1150 | $1,750 | $1.52 | 43d | 1 | 1.33mi |
| 6315 Sandra St Unit A Houston, TX | 3.0 | 2.0 | 1150 | $1,399 | $1.22 | 43d | 1 | 1.35mi |
| 1416 Fairbanks St Houston, TX | 4.0 | 3.5 | 1888 | $1,899 | $1.01 | 7d | 1 | 1.42mi |
Listing history 17 events
-
2026-06-18days on market $120,000 Active 72 DOM
-
2026-06-17days on market $120,000 Active 71 DOM
-
2026-06-16days on market $120,000 Active 70 DOM
-
2026-06-15days on market $120,000 Active 69 DOM
-
2026-06-13days on market $120,000 Active 67 DOM
-
2026-06-10days on market $120,000 Active 63 DOM
-
2026-06-08days on market $120,000 Active 62 DOM
-
2026-06-07days on market $120,000 Active 61 DOM
-
2026-06-04days on market $120,000 Active 58 DOM
-
2026-06-01days on market $120,000 Active 55 DOM
-
2026-05-31days on market $120,000 Active 54 DOM
-
2026-05-11price $120,000 367-char remark
Show marketing remark (367 chars)
Priced to sell and packed with potential, this investment opportunity is ideal for a creative investor ready to bring their vision to life. This home needs a little TLC, but the possibilities are endless. Whether you’re looking to renovate and resell, add to your rental portfolio, or create something unique, this property offers a great chance to build value.
-
2026-04-07$150,000 Active 367-char remark
Show marketing remark (367 chars)
Priced to sell and packed with potential, this investment opportunity is ideal for a creative investor ready to bring their vision to life. This home needs a little TLC, but the possibilities are endless. Whether you’re looking to renovate and resell, add to your rental portfolio, or create something unique, this property offers a great chance to build value.
-
2025-07-07historical
-
2025-06-09$219,999 Active
-
2015-12-31soldstatus
-
2001-01-09soldstatus
ⓘ Source: listings_history table (triggers on properties + properties_extension) + one-shot
backfill from property_details.listing_events for pre-trigger history.
Tax reassessment forecast TX · Resets to sale price
- Current annual tax
- $2,624 · $219/mo
- Projected year-2 tax
- $2,624 · $219/mo
- Expected delta
- $0/yr ($0/mo · 0.0%)
ⓘ Screening estimate from a state-policy table — verify with the county assessor before closing.
Climate risk First Street
- Flood 7/10 Severe FEMA zone AE · 95% chance over 30 yrs
- Wildfire 1/10 Low
- Heat 9/10 Extreme 7 d/yr ≥109°F today · 21 d/yr by 30 yrs out
- Wind 9/10 Extreme 99% chance of damaging wind over 30 yrs
- Air quality 3/10 Moderate 2 unhealthy d/yr today · 3 by 30 yrs out
Nearby sold comps map
Loading sold comps map…
Walkable amenities ~0.75 mi
Loading nearby amenities…
Taxation est. · year 1
- Rental income
- $20,200
- − Mortgage interest
- −$6,722
- − Property taxes
- −$2,624
- − Insurance
- −$5,718
- − Repairs & maintenance
- −$1,616
- − Management
- −$1,616
- − Depreciation
- −$3,491
- Taxable loss
- −$1,587
- Est. tax savings @ 24.0%
- +$381
- After-tax cash flow
- $445/yr
For passive investors: Depreciation is non-cash, so a rental often shows a tax loss while cash-flowing — sheltering income. Rental losses are passive: they offset passive income freely, and up to $25,000/yr can offset ordinary (W-2) income if you actively participate and your MAGI is under $100k (phasing out to $0 by $150k); unused losses carry forward. On sale, claimed depreciation is recaptured at up to 25%, and gains may owe capital-gains tax (a 1031 exchange can defer both). Figures are a year-1 estimate at your 24.0% rate — not tax advice; consult a CPA.
Schools (NCES district)
- District
- Houston ISD
- NCES district ID
- 4823640
- Math proficiency
- 27% ▼ -18.00%
- Reading proficiency
- 35% ▼ -6.00%
- Median HH income
- $46,054
- Composite
- 26.63/100
- National rank
- #7173
- State rank
- #593 of 826 in TX
Livability — Houston
- Score
- 74/100
- State rank
- #184
- US rank
- #4771
Category grades
Schools grade is shown separately in the Schools card above.
Census & demographics
- Census place
- Houston, TX
- County
- Harris County · 4,702,590 people
- City population
- 3,226,434
- Metro
- Houston-The Woodlands-Sugar Land, TX
- Population (ZIP)
- 21,981
- Household income
- $39,211
- Rent vs Own
- Severe rent burden
- 1531.0
Population outlook (Harris County) Hauer SSP2
- Today (2025)
- 5,571,493 people
- By 2030
- 6,089,821 · +9.3%
- By 2040
- 7,142,806 · +28.2%
- By 2050
- 8,185,864 · +46.9%
- By 2075
- 10,574,329 · +89.8%
- By 2100
- 12,109,958 · +117.4%
Race, ethnicity, and origin ACS 2023
- Neighborhood character
- Diverse neighborhood (Simpson 0.56)
- Race & ethnicity
- Black 49% Hispanic / Latino 44% Two or more races 18% White 5% Native American 1%
- Hispanic origin (detail)
- Mexican 34%
- Common ancestry
- Lithuanian 1%
- Foreign-born
- 15% · Canada
- Languages at home
- 61% English-only · Spanish 39%
Political lean MEDSL · Harris
- 2024 margin
- Lean D (+5.5) · D 52.0% · R 46.4% · Other 1.6%
- 2008→2024 swing
- +3.9pp toward D · 2008: 1.6pp · 2024: 5.5pp
- All cycles
- 2024: D+5.5 2020: D+13.3 2016: D+12.4 2012: D+0.1 2008: D+1.6
Not yet ingested
- Civics
- —
Market trends
- HPI YoY
- ▲ 3.89%
- Current HPI
- 267.5995
- Rent YoY
- ▲ 3.08%
- Metro
- Houston-The Woodlands-Sugar Land, TX
- State GDP YoY
- ▲ 3.95%
- F500 in state
- 110
Industry mix (Fortune 500 HQ in TX)
| Industry | F500 HQs | Revenue |
|---|---|---|
| Energy | 16 | $1,198B |
|
||
| Technology | 5 | $198B |
|
||
| Engineering / Construction | 4 | $72B |
|
||
| Energy Services | 3 | $60B |
|
||
| Utilities | 3 | $41B |
|
||
| Healthcare | 2 | $330B |
|
||
Price history
-45.5% since first listed6 events — show timeline
- 2026-05-11 Price Changed $120,000 HARMLS
- 2026-04-07 Listed $150,000 HARMLS
- 2025-07-07 Listing Removed — HARMLS
- 2025-06-09 Listed $219,999 HARMLS
- 2015-12-31 Sold (Public Records) — Public Records
- 2001-01-09 Sold (Public Records) — Public Records
Property tax history
+3.0%/yrLatest (2025): $2,624 · -8.0% YoY. Source: county tax records.
Cash-flow waterfall
monthlySold comps — $/sqft
last 12 mo · ≤1 miLoading sold comps…