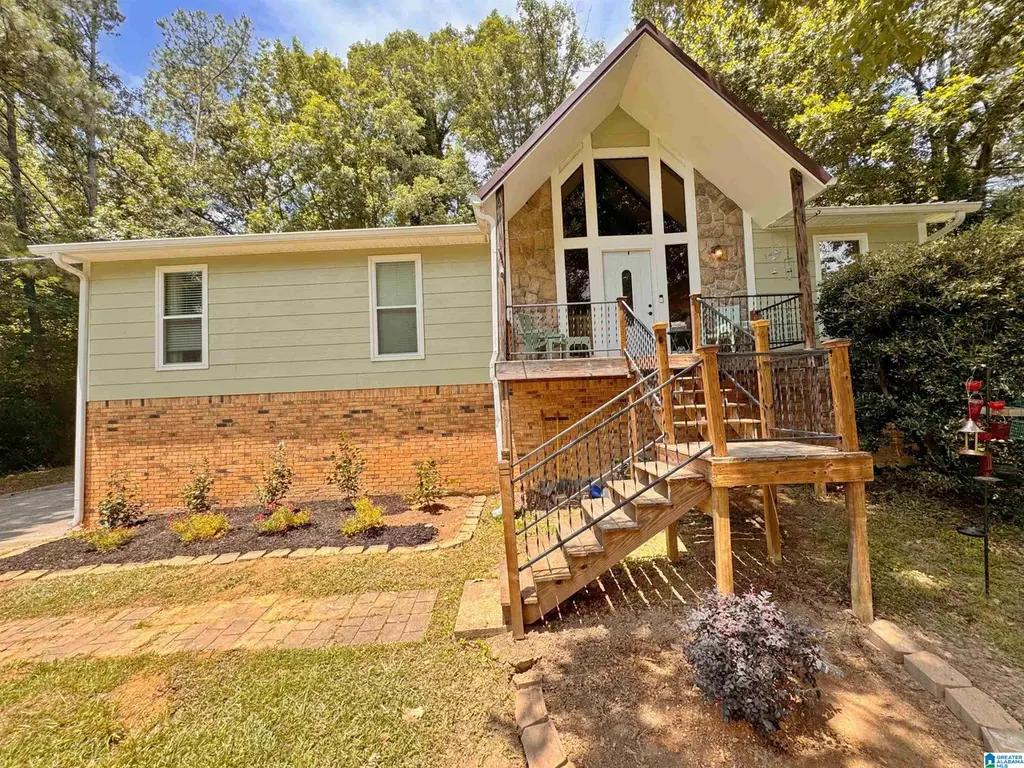
109 Yvonne Cir · Trussville, AL
Flood risk 1/10 · Minimal
- FEMA flood zone
- X (unshaded)
- Chance of flooding over 30 yrs
- 0.0%
- Est. flood insurance / yr
- $473 – $860
Fire risk 4/10 · Minor
- Est. fire insurance / yr
- $916 – $1,700
Heat risk 5/10 · Moderate
- Hot days now (above 106°F)
- 7 days/yr
- Hot days in 30 yrs
- 19 days/yr
Wind risk 6/10 · Moderate
- Chance of severe wind over 30 yrs
- 27.0%
Air-quality risk 4/10 · Minor
- Unhealthy air days now
- 6 days/yr
- Unhealthy air days in 30 yrs
- 7 days/yr
Risk factors via First Street. Map © Google.
Why this score? — see what drove the D+ grade
The composite is a weighted blend of 9 inputs, each scored 0–100. Each bar is that input's sub-score; the figure is the points it added to the 100-point composite (weight × sub-score).
- Cash flow +17.5/30.0
- DSCR +5.5/10.0
- ARV discount +5.5/15.0
- Schools +5.5/10.0
- Livability +4.0/5.0
- 1% rule +3.7/10.0
- Rent growth +2.5/5.0
- Condition / age +2.5/5.0
- Appreciation +0.0/10.0
$280,000
🖨 Deal sheet (PDF) 📄 Offer letter ✓ Due diligence
Listing remarks MLS
Upon arriving at this charming Trussville home, the first thing you notice is the curb appeal. Located on a quiet street with a cul-de-sac, this home features a beautiful lot with a spacious front yard. As you enter, you will find hardwoods spanning the open floor plan and tall ceilings with beautiful, stained wooden beams welcoming you in. The stunning kitchen features new cabinets, stainless appliances, and granite countertops with main living area and fireplace directly off the kitchen. The 3 bedrooms and 2 full bathrooms as well as the laundry are conveniently located on the main level of the home and through the back door is a deck that is perfect for entertaining. Downstairs you will find the unfinished, waterproofed basement off the two-car garage that leaves opportunity to create even more living space. This beautiful home has recently been renovated with brand new double-pained, energy efficient windows and new water heater as well. Do not miss a chance!!
Key facts
- 0.35 acre lot
- 2 garage spots
- Built 1978
Property features AI
Finance
- Other: Property contains approximately 0.35 acres
- Financial info: Down payment assistance available
- HOA & community: No association fee
Exterior
- Parking: Side entry; Basement parking with 2 garage spaces; Driveway parking
- Utilities: Public water; Septic sewer; Gas water heater; Spectrum internet available; Double-paned windows (energy feature)
- Home design: Brick over foundation and wood siding exterior; Basement foundation; Tri-level: no (split foyer present); Located in the Trussville Manor subdivision
- Construction: Existing home; Concrete block basement; Open deck
- Exterior features: Fenced yard; Open deck; Storage building; Public road access
Interior
- Kitchen: Island and pantry; Stone countertops; Cooktop (electric), built-in dishwasher, built-in microwave, refrigerator, electric stove
- Bedrooms: Master bedroom on main level; Additional bedrooms on main level
- Flooring: Carpet; Hardwood laminate; Tile floors
- Bathrooms: Two full bathrooms; Combination tub/shower and a separate shower
- Heating & cooling: Central heating; Central cooling
- Interior features: Cathedral/vaulted and smooth ceilings; Recessed lighting; Stone fireplace in the living room (wood-burning); Some window treatments to remain; Split foyer
- Laundry & utility: Main-level laundry in a closet; Washer hookup and gas dryer hookup; Pull-down attic access; Full, unfinished basement (concrete block)
Neighborhood map
What this means for you Summary
Snapshot
- This is a 3-bed/2.0-bath single-family listed at $280k.
Deal economics
- At list price, monthly cash flow is $217 ($3k/yr) — positive.
- The deal already cash-flows at list — no discount required.
- To meet the 1% rule (rent ≥ 1% of price), the offer needs to be $244k (13.0% below list).
- Recommended offer: $244k (13.0% below list) — sets the bar for 1% rule.
- Cap rate 7.2% vs local median 3.4% in Trussville — top-decile yield for the area; either an underpriced asset or a hidden risk that comps aren't pricing in. Stress-test before assuming the spread holds.
Location & tenants
- Location reads 79/100 on livability (#7 in AL, #2,110 nationally) — a middle-class / working-renter tenant base. Strengths: employment A+, housing A+, crime B+; Watch: commute F.
- Trussville City (suburban): math 49% / reading 74% proficiency, ranked #5 of 129 in AL (top 4%) — acceptable for families but not a draw, mixed tenant base, ~2y average lease; only 7% free/reduced lunch — higher-income household profile.
- Zoned schools: Magnolia Elementary School (math 62% / reading 82%, grade A-, #20 of 627 statewide, top 4%, 403 students, 20% FRL); Hewitttrussville Middle School (math 33% / reading 75%, grade B-, #20 of 257 statewide, top 8%, 1,202 students, 16% FRL); Hewitttrussville High School (math 50% / reading 50%, grade D+, #15 of 305 statewide, top 5%, 1,573 students, 15% FRL).
- Market conditions: 340 active listings in the ZIP; 9 comparable units currently listed for rent nearby; rentals lingering (median 45d on market — plan ~5-8 weeks vacancy on turnover, expect pricing pressure); 56% of comp listings sitting > 30 days — soft ceiling on asking rent; 2,114 units permitted in Jefferson County in 2024 (556 in 5+ unit buildings).
Forward outlook
- Local home prices are declining (-3.0%/yr); year-one equity from $2k of loan paydown is wiped out by about $8k of value loss. Plan a longer hold.
- Jefferson County population projected to shrink 4% by 2050 — rents likely to lag national; underwrite the cash flow, not the appreciation.
Negotiation context
- Only 11 days on market — expect competitive offers; lowballing is unlikely to land.
- 2 sale attempts since 4y ago with the ask held roughly flat each time — persistent listings suggest the price (not the market) is what's stuck; bring a comps-based counter.
- Current owner paid $225k; 24% above their basis — modest negotiation headroom, anchor on the comps not their cost.
Risks & watch-outs
- Climate carrying-cost: major wind risk, 27% chance of damaging wind over 30y; extreme-heat days projected 7→19/yr by 2055 (HVAC capex compounding) — expect insurance premiums to compound above CPI over the hold.
Questions for the listing agent
- Built in 1978 — when were the roof, HVAC, electrical panel, plumbing, and water heater last replaced?
- Is there a deadline driving the sale (1031 exchange, divorce, estate, relocation)? That informs how much negotiation room exists.
- Schools are A-rated — typically a magnet for longer-tenancy family renters. What's the average tenant stay here, and is there a school-zone premium baked into asking?
- The area grade is low — what's the realistic commute time and amenity access for the typical tenant pool here? Any planned neighborhood developments (good or bad) we should know about?
- What's the average days-on-market for RENTAL listings here right now (not sales)? A rising rental-DOM trend means longer vacancies and softer asking-rent achievability than the comps imply.
- What's the recent tenant-quality profile in this submarket — average credit score on applications, eviction rate, late-payment / NSF rate, and stable-employment percentage? A property-management company in the area should have these aggregated.
- How much new for-sale + rental construction is in the pipeline within 1–3 miles? Heavy new supply typically softens prices + rents 12–24 months out; constrained supply supports both.
Investment metrics
- 1% rule
- 0.87% ✗
- Cap rate
- 7.22%
- Cash-on-cash
- 3.32%
- DSCR
- 1.15
- GRM
- 9.6
CMA / ARV
- ARV (on-the-fly)
- $268,117
- Comps found
- 12
Show comp detail 12 sales within ~0.75 mi
| Address | Dist | Beds/Ba | Sqft | Sold | Price | $/sf | Match |
|---|---|---|---|---|---|---|---|
| 120 Lynn Dr | 0.12mi | 3/2.0 | 1,330 (-2%) | 9mo | $245,000 | $184 | 83 |
| 105 Dawn Cir | 0.04mi | 3/2.0 | 1,458 (+7%) | 9mo | $275,000 | $189 | 79 |
| 6189 Alabama Dr | 0.34mi | 4/2.0 (+1) | 1,432 (+5%) | 2mo | $335,000 | $234 | 69 |
| 111 Kingstown Cir | 0.22mi | 4/2.0 (+1) | 1,300 (-4%) | 10mo | $320,000 | $246 | 69 |
| 323 Glen Cross Way | 0.44mi | 3/2.0 | 1,261 (-7%) | 12mo | $300,000 | $238 | 57 |
| 3221 Barkwood Trce | 0.36mi | 3/2.0 | 1,525 (+12%) | 13mo | $300,000 | $197 | 52 |
| 3520 Halcyon Way | 0.72mi | 3/2.0 | 1,418 (+4%) | 10mo | $349,900 | $247 | 52 |
| 5493 Magnolia Trl | 0.68mi | 3/2.0 | 1,492 (+10%) | 3mo | $270,000 | $181 | 49 |
| 332 Montgomery Ave | 0.73mi | 3/2.0 | 1,285 (-6%) | 10mo | $40,000 | $31 | 48 |
| 382 Glen Cross Way | 0.60mi | 3/2.0 | 1,550 (+14%) | 6mo | $318,000 | $205 | 44 |
| 5490 Azalea Trce | 0.71mi | 3/2.0 | 1,522 (+12%) | 6mo | $260,000 | $171 | 42 |
| 3012 2nd St | 0.66mi | 3/3.0 | 1,550 (+14%) | 3mo | $263,000 | $170 | 40 |
Match score weights: distance 35% · size 25% · config 20% · recency 20%. Top-matched comps best support the ARV.
Projected returns pro-forma
-3.0% appreciation · 3.0% rent growth · sell at horizon
- IRR
- -11.1%
- Equity multiple
- 0.60×
- Total profit
- $-31,659
- Equity at exit
- $41,749
- IRR
- -1.9%
- Equity multiple
- 0.87×
- Total profit
- $-10,196
- Equity at exit
- $24,209
Cash invested: $78,400 (down + closing). Projections, not guarantees.
Landlord ↔ Tenant lean methodology
- Overall (STATE)
- 90 Strongly Landlord-Friendly
- State Alabama
- 90 Strongly Landlord-Friendly · R+15
- County
- — inherits STATE
- City
- — inherits STATE
ZIP-level market 35173
- Home prices YoY
- -33.4%
- Active inventory
- 340
- Price-to-rent
- 9.6×
Monthly cashflow live
- Estimated rent
- $2,437 high interval (Pro) →
- Mortgage (P&I)
- −$1,468
- Tax from tax record
- −$123 /mo · $1,481/yr
- Insurance
- −$117
- HOA
- −$0
- Vacancy / Maint / Mgmt
- −$512
- Net cashflow
- $217
Break-even live
Sensitivity live
| Price | -10% $375 | -5% $296 | +0% $217 | +5% $138 | +10% $58 |
|---|---|---|---|---|---|
| Rent | -10% $24 | -5% $121 | +0% $217 | +5% $313 | +10% $409 |
| Rate | -1.0pp $358 | -0.5pp $288 | base $217 | +0.5pp $144 | +1.0pp $71 |
UW: 25.0% down · 7.5% · 30yr · 1.5% tax · 5.0% vac · 8.0% maint · 8.0% mgmt
Financing live
Cash to close
- Down payment
- $70,000
- Closing costs
- $8,400
- Reserves months
- —
- Total cash needed
- —
Loan-product check · same deal, 3 products live
Conventional
25% down · 7.5% · 30yr
- Down + closing
- —
- Monthly P&I
- —
- Monthly cashflow
- —
- DSCR
- —
- Eligible?
- —
Personal DTI + credit; lowest rate.
DSCR
20% down · 8.5% · 30yr
- Down + closing
- —
- Monthly P&I
- —
- Monthly cashflow
- —
- DSCR
- —
- Eligible?
- —
No personal income docs; deal must DSCR.
Hard money
10% down · 12.0% · 12mo
- Down + closing
- —
- Monthly P&I
- —
- Monthly cashflow
- —
- DSCR
- —
- Eligible?
- —
Short-term bridge; refi at stabilization.
Rent comps 9 comps
| Address | Beds | Baths | Sqft | Rent | $/sqft | DOM | Units | Dist |
|---|---|---|---|---|---|---|---|---|
| 3129 Cedarbrook Ln Trussville, AL | 3.0 | 2.0 | 1231 | $1,766 | $1.43 | 16d | 1 | 0.64mi |
| 6232 Halcyon Ter Trussville, AL | 3.0 | 2.5 | 1818 | $2,700 | $1.49 | 17d | 1 | 0.69mi |
| 3509 Halcyon Way Trussville, AL | 3.0 | 2.0 | 1412 | $2,995 | $2.12 | 25d | 1 | 0.70mi |
| 3539 Mary Taylor Rd Birmingham, AL | 2.0 | 1.0–2.0 | 847 | $1,592 | $1.88 | 3d | 8 | 0.88mi |
| 6735 Roper Rd Trussville, AL | 3.0 | 2.0 | 1625 | $2,400 | $1.48 | 45d | 1 | 1.13mi |
| 160 Morrow Ave Unit 204 Trussville, AL | 3.0 | 2.0 | 1836 | $2,850 | $1.55 | 45d | 1 | 1.26mi |
| 160 Morrow Ave Unit 208 Trussville, AL | 2.0 | 2.0 | 1450 | $2,650 | $1.83 | 45d | 1 | 1.26mi |
| 165 Morrow Ave Unit 201 Trussville, AL | 2.0 | 2.0 | 1870 | $3,500 | $1.87 | 45d | 1 | 1.32mi |
| 318 Linden St Unit 100 Trussville, AL | 2.0 | 1.0 | 985 | $1,550 | $1.57 | 45d | 1 | 1.39mi |
Listing history 9 events
-
2026-06-21days on market $280,000 Active 11 DOM
-
2026-06-18days on market $280,000 Active 8 DOM
-
2026-06-17days on market $280,000 Active 7 DOM
-
2026-06-16days on market $280,000 Active 6 DOM
-
2026-06-15days on market $280,000 Active 5 DOM
-
2026-06-13days on market $280,000 Active 3 DOM
-
2026-06-13days on market $280,000 Active 2 DOM
-
2026-06-10remarks 695-char remark
-
2026-06-10$280,000 Active 1 DOM
ⓘ Source: listings_history table (triggers on properties + properties_extension) + one-shot
backfill from property_details.listing_events for pre-trigger history.
Tax reassessment forecast AL · Resets to sale price
- Current annual tax
- $1,481 · $123/mo
- Projected year-2 tax
- $1,481 · $123/mo
- Expected delta
- $0/yr ($0/mo · 0.0%)
ⓘ Screening estimate from a state-policy table — verify with the county assessor before closing.
Climate risk First Street
- Flood 1/10 Low FEMA zone X (unshaded) · 0% chance over 30 yrs
- Wildfire 4/10 Moderate
- Heat 5/10 Major 7 d/yr ≥106°F today · 19 d/yr by 30 yrs out
- Wind 6/10 Major 27% chance of damaging wind over 30 yrs
- Air quality 4/10 Moderate 6 unhealthy d/yr today · 7 by 30 yrs out
Nearby sold comps map
Loading sold comps map…
Walkable amenities ~0.75 mi
Loading nearby amenities…
Taxation est. · year 1
- Rental income
- $29,246
- − Mortgage interest
- −$15,684
- − Property taxes
- −$1,481
- − Insurance
- −$1,400
- − Repairs & maintenance
- −$2,340
- − Management
- −$2,340
- − Depreciation
- −$8,145
- Taxable loss
- −$2,144
- Est. tax savings @ 24.0%
- +$515
- After-tax cash flow
- $3,118/yr
For passive investors: Depreciation is non-cash, so a rental often shows a tax loss while cash-flowing — sheltering income. Rental losses are passive: they offset passive income freely, and up to $25,000/yr can offset ordinary (W-2) income if you actively participate and your MAGI is under $100k (phasing out to $0 by $150k); unused losses carry forward. On sale, claimed depreciation is recaptured at up to 25%, and gains may owe capital-gains tax (a 1031 exchange can defer both). Figures are a year-1 estimate at your 24.0% rate — not tax advice; consult a CPA.
Schools (NCES district)
- District
- Trussville City
- NCES district ID
- 0100013
- Math proficiency
- 49% ▼ -27.00%
- Reading proficiency
- 74% ▲ 3.00%
- Median HH income
- $83,473
- Composite
- 55.42/100
- National rank
- #1250
- State rank
- #5 of 129 in AL
Livability — Trussville
- Score
- 79/100
- State rank
- #7
- US rank
- #2110
Category grades
Schools grade is shown separately in the Schools card above.
Census & demographics
- Census place
- Trussville, AL
- City population
- 51,725
- Population (ZIP)
- 32,125
Population outlook (Jefferson County) Hauer SSP2
- Today (2025)
- 669,185 people
- By 2030
- 669,694 · +0.1%
- By 2040
- 661,388 · -1.2%
- By 2050
- 643,086 · -3.9%
- By 2075
- 577,267 · -13.7%
- By 2100
- 474,758 · -29.1%
Race, ethnicity, and origin ACS 2023
- Neighborhood character
- Predominantly White (82%)
- Race & ethnicity
- White 82% Black 10% Hispanic / Latino 5% Two or more races 4%
- Common ancestry
- Slovak 2% Italian 2% Lithuanian 1%
- Foreign-born
- 4% · Canada, Jamaica
- Languages at home
- 95% English-only · Spanish 3%
Political lean MEDSL · Jefferson
- 2024 margin
- D (+10.4) · D 54.6% · R 44.2% · Other 1.2%
- 2008→2024 swing
- +5.4pp toward D · 2008: 5.1pp · 2024: 10.4pp
- All cycles
- 2024: D+10.4 2020: D+13.2 2016: D+7.2 2012: D+6.0 2008: D+5.1
Not yet ingested
- Civics
- —
Market trends
- HPI YoY
- ▼ -104.75%
- Current HPI
- 208.5715
- Rent YoY
- —
- Metro
- —
- State GDP YoY
- ▲ 2.94%
- F500 in state
- 4
Industry mix (Fortune 500 HQ in AL)
| Industry | F500 HQs | Revenue |
|---|---|---|
| Financial Services | 1 | $8B |
|
||
| Healthcare | 1 | $5B |
|
||
Price history
+409.1% since first listed14 events — show timeline
- 2026-06-10 Listed $280,000 Greater Alabama MLS
- 2026-06-09 Coming Soon $280,000 Greater Alabama MLS
- 2022-12-30 Sold (Public Records) $225,000 Public Records
- 2022-12-29 Sold (MLS) $225,000 Greater Alabama MLS
- 2022-12-03 Contingent — Greater Alabama MLS
- 2022-11-04 Price Changed $229,000 Greater Alabama MLS
- 2022-10-11 Price Changed $239,000 Greater Alabama MLS
- 2022-09-30 Listed $259,900 Greater Alabama MLS
- 2022-09-28 Price Changed $259,900 Greater Alabama MLS
- 2022-09-28 Coming Soon $159,900 Greater Alabama MLS
- 2022-08-30 Sold (Public Records) $120,000 Public Records
- 2020-06-19 Sold (Public Records) $75,000 Public Records
- 1987-06-26 Sold (Public Records) $62,000 Public Records
- 1980-04-01 Sold (Public Records) $55,000 Public Records
Property tax history
+7.3%/yrLatest (2025): $1,481 · +2.8% YoY. Source: county tax records.
Cash-flow waterfall
monthlySold comps — $/sqft
last 12 mo · ≤1 miLoading sold comps…