22585 Nebula Way · Connerton, FL
Flood risk No data
- FEMA flood zone
- —
- Chance of flooding over 30 yrs
- —
- Est. flood insurance / yr
- —
Fire risk No data
- Est. fire insurance / yr
- —
Heat risk No data
- Hot days now (above threshold)
- —
- Hot days in 30 yrs
- —
Wind risk No data
- Chance of severe wind over 30 yrs
- —
Air-quality risk No data
- Unhealthy air days now
- —
- Unhealthy air days in 30 yrs
- —
Risk factors via First Street. Map © Google.
Why this score? — see what drove the C- grade
The composite is a weighted blend of 9 inputs, each scored 0–100. Each bar is that input's sub-score; the figure is the points it added to the 100-point composite (weight × sub-score).
- Cash flow +15.5/30.0
- ARV discount +11.9/15.0
- DSCR +4.8/10.0
- Schools +4.3/10.0
- 1% rule +4.2/10.0
- Appreciation +4.2/10.0
- Condition / age +4.0/5.0
- Livability +3.3/5.0
- Rent growth +2.5/5.0
$312,400
🖨 Deal sheet 📄 Offer letter ✓ Due diligence
Listing remarks
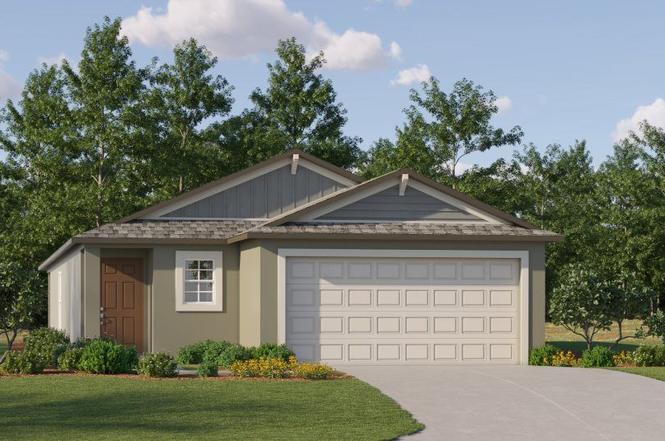
In this single-story home, the kitchen, dining room and family room cohesively flow together with a contemporary open floorplan. The adjacent owner's suite offers a comfortable place to relax with a private bathroom and walk-in closet, while two additional bedrooms provide space for the rest of the family.
Key facts
- Walk-in closet
- Open floorplan
- Private bathroom
Tags
Property features AI
Finance
- Other: Living area 1,448
- Financial info: List price $312,400
- HOA & community:
Exterior
- Parking: 2 parking spaces (including 2-car garage)
- Security:
- Utilities:
- Home design: Annapolis plan; New construction (spec)
- Construction:
- Exterior features:
Interior
- Kitchen:
- Bedrooms: 3 bedrooms
- Flooring:
- Bathrooms: 2 full bathrooms
- Heating & cooling:
- Interior features: Open living area
- Laundry & utility:
Neighborhood map
What this means for you Summary
Snapshot
- This is a 3-bed/2.0-bath single-family listed at $312k. Condition is rated good.
Deal economics
- At list price, monthly cash flow is $124 ($1k/yr) — positive.
- The deal already cash-flows at list — no discount required.
- To meet the 1% rule (rent ≥ 1% of price), the offer needs to be $289k (7.5% below list).
- Recommended offer: $289k (7.5% below list) — sets the bar for 1% rule.
- Cap rate 6.8% vs local median 4.3% in Connerton — top-decile yield for the area; either an underpriced asset or a hidden risk that comps aren't pricing in. Stress-test before assuming the spread holds.
Location & tenants
- Location reads 66/100 on livability (#596 in FL) — a middle-class / working-renter tenant base. Strengths: crime A+, employment A+, housing A+; Watch: schools D+, amenities F, commute F.
- Pasco (suburban): math 50% / reading 52% proficiency, ranked #32 of 73 in FL (top 44%) — acceptable for families but not a draw, mixed tenant base, ~2y average lease.
- Market conditions: 285 active listings in the ZIP; 7 comparable units currently listed for rent nearby; rentals at typical pace (median 15d on market — plan ~3-4 weeks tenant-placement turnaround); high-income renter base; 6,765 units permitted in Pasco County in 2024 (1,250 in 5+ unit buildings).
- This rent runs 30% of the median local income ($115k/yr) — at the standard rent-burdened threshold; future hikes will face affordability resistance.
Forward outlook
- Local home prices are declining (-1.5%/yr); year-one equity from $2k of loan paydown is wiped out by about $5k of value loss. Plan a longer hold.
- Pasco County population projected at +29% by 2050 — long-run rental-demand tailwind backs the buy-and-hold thesis.
Negotiation context
- Only 4 days on market — expect competitive offers; lowballing is unlikely to land.
Questions for the listing agent
- Is there a deadline driving the sale (1031 exchange, divorce, estate, relocation)? That informs how much negotiation room exists.
- Schools are D-rated, which usually means shorter tenancies and higher turnover. Who's the typical renter profile here, and what's been the actual vacancy rate?
- What's the average days-on-market for RENTAL listings here right now (not sales)? A rising rental-DOM trend means longer vacancies and softer asking-rent achievability than the comps imply.
- What's the recent tenant-quality profile in this submarket — average credit score on applications, eviction rate, late-payment / NSF rate, and stable-employment percentage? A property-management company in the area should have these aggregated.
- How much new for-sale + rental construction is in the pipeline within 1–3 miles? Heavy new supply typically softens prices + rents 12–24 months out; constrained supply supports both.
Investment metrics
- 1% rule
- 0.92% ✗
- Cap rate
- 6.77%
- Cash-on-cash
- 1.70%
- DSCR
- 1.08
- GRM
- 9.0
CMA / ARV
- ARV (on-the-fly)
- $346,072
- Comps found
- 8
Show comp detail 8 sales within ~0.75 mi
| Address | Dist | Beds/Ba | Sqft | Sold | Price | $/sf | Match |
|---|---|---|---|---|---|---|---|
| 22313 Nebula Way | 0.24mi | 3/2.0 | 1,461 (+1%) | 21mo | $349,900 | $239 | 70 |
| 22294 Blazing Star Run | 0.25mi | 3/2.0 | 1,461 (+1%) | 22mo | $355,900 | $244 | 69 |
| 22288 Pleasant Morning Dr | 0.27mi | 3/2.0 | 1,461 (+1%) | 22mo | $349,900 | $239 | 67 |
| 22238 Blazing Star Run | 0.30mi | 3/2.0 | 1,461 (+1%) | 23mo | $341,875 | $234 | 65 |
| 7796 Painted Sky Pl | 0.37mi | 3/2.0 | 1,556 (+8%) | 10mo | $344,900 | $222 | 62 |
| 8086 Painted Sky Pl | 0.38mi | 3/2.0 | 1,556 (+8%) | 12mo | $359,990 | $231 | 60 |
| 22111 Nebula Way | 0.43mi | 3/2.0 | 1,560 (+8%) | 11mo | $370,000 | $237 | 58 |
| 8122 Ehren Cemetery Rd | 0.62mi | 3/2.0 | 1,566 (+8%) | 14mo | $481,000 | $307 | 46 |
Match score weights: distance 35% · size 25% · config 20% · recency 20%. Top-matched comps best support the ARV.
Projected returns pro-forma
-1.54% appreciation · 3.0% rent growth · sell at horizon
- IRR
- -6.3%
- Equity multiple
- 0.74×
- Total profit
- $-23,116
- Equity at exit
- $67,415
- IRR
- 1.1%
- Equity multiple
- 1.09×
- Total profit
- $8,081
- Equity at exit
- $64,185
Cash invested: $87,472 (down + closing). Projections, not guarantees.
Landlord ↔ Tenant lean methodology
- Overall (STATE)
- 87 Strongly Landlord-Friendly
- State Florida
- 87 Strongly Landlord-Friendly · R+3
- County
- — inherits STATE
- City
- — inherits STATE
ZIP-level market 34637
- Home prices YoY
- -1.2%
- Active inventory
- 285
- Price-to-rent
- 9.0×
Monthly cashflow live
- Estimated rent
- $2,889 high interval (Pro) →
- Mortgage (P&I)
- −$1,638
- Tax est. 1.5%
- −$390 /mo · $4,686/yr
- Insurance
- −$130
- HOA
- −$0
- Vacancy / Maint / Mgmt
- −$607
- Net cashflow
- $124
Break-even live
UW: 25.0% down · 7.5% · 30yr · 1.5% tax · 5.0% vac · 8.0% maint · 8.0% mgmt
Financing live
Cash to close
- Down payment
- $78,100
- Closing costs
- $9,372
- Reserves months
- —
- Total cash needed
- —
Loan-product check · same deal, 3 products live
Conventional
25% down · 7.5% · 30yr
- Down + closing
- —
- Monthly P&I
- —
- Monthly cashflow
- —
- DSCR
- —
- Eligible?
- —
Personal DTI + credit; lowest rate.
DSCR
20% down · 8.5% · 30yr
- Down + closing
- —
- Monthly P&I
- —
- Monthly cashflow
- —
- DSCR
- —
- Eligible?
- —
No personal income docs; deal must DSCR.
Hard money
10% down · 12.0% · 12mo
- Down + closing
- —
- Monthly P&I
- —
- Monthly cashflow
- —
- DSCR
- —
- Eligible?
- —
Short-term bridge; refi at stabilization.
Rent comps 7 comps
| Address | Beds | Baths | Sqft | Rent | $/sqft | DOM | Units | Dist |
|---|---|---|---|---|---|---|---|---|
| 22310 Blazing Star Run Land O Lakes, FL | 4.0 | 2.5 | 1870 | $2,650 | $1.42 | 17d | 1 | 0.20mi |
| 8862 Gallantree Pl Unit 8862-Townhouse Land O' Lakes, FL | 3.0 | 2.5 | 1601 | $2,195 | $1.37 | 12d | 1 | 0.45mi |
| 9645 Carabiner Way Land O' Lakes, FL | 4.0 | 2.5 | 1870 | $2,700 | $1.44 | 24d | 1 | 1.22mi |
| 9676 Nyssa St Land O Lakes, FL | 3.0 | 2.5 | 1601 | $2,099 | $1.31 | 12d | 1 | 1.31mi |
| 21818 Lyonia Ln Land O Lakes, FL | 3.0 | 2.5 | 1601 | $2,250 | $1.41 | 14d | 1 | 1.33mi |
| 21869 Adriatic Ln Land O Lakes, FL | 3.0 | 2.5 | 1601 | $2,400 | $1.50 | 24d | 1 | 1.39mi |
| 21831 Adriatic Ln Land O Lakes, FL | 3.0 | 3.0 | 1601 | $1,995 | $1.25 | 5d | 1 | 1.40mi |
Listing history 5 events
-
2026-06-18days on market $312,400 Active 4 DOM
-
2026-06-17days on market $312,400 Active 3 DOM
-
2026-06-16days on market $312,400 Active 2 DOM
-
2026-06-15remarks 307-char remark
-
2026-06-15$312,400 Active 1 DOM
ⓘ Source: listings_history table (triggers on properties + properties_extension) + one-shot
backfill from property_details.listing_events for pre-trigger history.
Nearby sold comps map
Loading sold comps map…
Walkable amenities ~0.75 mi
Loading nearby amenities…
Taxation est. · year 1
- Rental income
- $34,673
- − Mortgage interest
- −$17,499
- − Property taxes
- −$4,686
- − Insurance
- −$1,562
- − Repairs & maintenance
- −$2,774
- − Management
- −$2,774
- − Depreciation
- −$9,088
- Taxable loss
- −$3,710
- Est. tax savings @ 24.0%
- +$890
- After-tax cash flow
- $2,375/yr
For passive investors: Depreciation is non-cash, so a rental often shows a tax loss while cash-flowing — sheltering income. Rental losses are passive: they offset passive income freely, and up to $25,000/yr can offset ordinary (W-2) income if you actively participate and your MAGI is under $100k (phasing out to $0 by $150k); unused losses carry forward. On sale, claimed depreciation is recaptured at up to 25%, and gains may owe capital-gains tax (a 1031 exchange can defer both). Figures are a year-1 estimate at your 24.0% rate — not tax advice; consult a CPA.
Condition & rehab AI · 12 photos
This single-story home features a contemporary open floorplan with good condition and minimal repairs needed. It is move-in ready with a good resale and rental value.
Value-add opportunities
- Resale Paint the exterior walls — Fresh paint can enhance curb appeal and home value
- Rental Replace the ceiling fan — A modern ceiling fan can improve the rental appeal and comfort of the home
Renovation cost estimate screening
Value-add ROI direction
- Resale Paint the exterior walls — Fresh paint can enhance curb appeal and home value ↑
- Rental Replace the ceiling fan — A modern ceiling fan can improve the rental appeal and comfort of the home ↑
ⓘ Cost ranges are severity-bucket heuristics (US national rule-of-thumb). Get contractor quotes + a written scope before underwriting a rehab budget.
Schools (NCES district)
- District
- Pasco
- NCES district ID
- 1201530
- Math proficiency
- 50% ▼ -10.00%
- Reading proficiency
- 52% ▼ -5.00%
- Median HH income
- $45,039
- Composite
- 43.14/100
- National rank
- #3074
- State rank
- #32 of 73 in FL
Livability — Connerton
- Score
- 66/100
- State rank
- #596
- US rank
- #11437
Category grades
Schools grade is shown separately in the Schools card above.
Census & demographics
- Census place
- Connerton, FL
- County
- Pasco County · 524,098 people
- City population
- 11,398
- Metro
- Tampa-St. Petersburg-Clearwater, FL
- Population (ZIP)
- 13,049
- Household income
- $115,214
- Rent vs Own
- Severe rent burden
- 96.0
Population outlook (Pasco County) Hauer SSP2
- Today (2025)
- 570,045 people
- By 2030
- 605,844 · +6.3%
- By 2040
- 674,806 · +18.4%
- By 2050
- 736,022 · +29.1%
- By 2075
- 862,900 · +51.4%
- By 2100
- 906,364 · +59.0%
Race, ethnicity, and origin ACS 2023
- Neighborhood character
- Predominantly White (70%)
- Race & ethnicity
- White 70% Hispanic / Latino 16% Two or more races 10% Black 7% Asian 5%
- Hispanic origin (detail)
- Mexican 1% Puerto Rican 10% Cuban 1%
- Common ancestry
- Romanian 5% Italian 3% Iranian 2%
- Foreign-born
- 8% · Canada
- Languages at home
- 85% English-only · Spanish 8% Other Indo-European 4% Tagalog/Filipino 1%
Political lean MEDSL · Pasco
- 2024 margin
- Strong R (+25.2) · D 36.9% · R 62.1% · Other 1.0%
- 2008→2024 swing
- -21.6pp toward R · 2008: -3.6pp · 2024: -25.2pp
- All cycles
- 2024: R+25.2 2020: R+20.1 2016: R+21.6 2012: R+6.7 2008: R+3.6
Not yet ingested
- Civics
- —
Market trends
- HPI YoY
- ▼ -1.54%
- Current HPI
- 126.1415
- Rent YoY
- —
- Metro
- Tampa-St. Petersburg-Clearwater, FL
- State GDP YoY
- ▲ 3.28%
- F500 in state
- 36
Industry mix (Fortune 500 HQ in FL)
| Industry | F500 HQs | Revenue |
|---|---|---|
| Industrial Technology | 2 | $29B |
|
||
| Insurance | 2 | $17B |
|
||
| Retail | 1 | $60B |
|
||
| Technology Distribution | 1 | $58B |
|
||
| Homebuilding | 1 | $35B |
|
||
| Technology Manufacturing | 1 | $35B |
|
||
Cash-flow waterfall
monthlySold comps — $/sqft
last 12 mo · ≤1 miLoading sold comps…