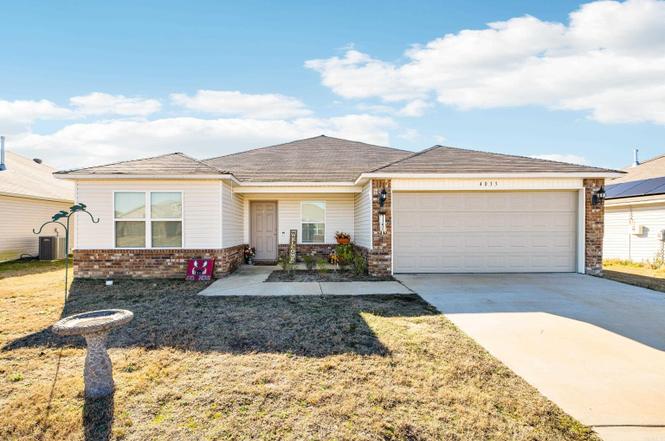
4033 Kings River Trl · Bauxite, AR
Flood risk No data
- FEMA flood zone
- —
- Chance of flooding over 30 yrs
- —
- Est. flood insurance / yr
- —
Fire risk No data
- Est. fire insurance / yr
- —
Heat risk No data
- Hot days now (above threshold)
- —
- Hot days in 30 yrs
- —
Wind risk No data
- Chance of severe wind over 30 yrs
- —
Air-quality risk No data
- Unhealthy air days now
- —
- Unhealthy air days in 30 yrs
- —
Risk factors via First Street. Map © Google.
Why this score? — see what drove the D+ grade
The composite is a weighted blend of 9 inputs, each scored 0–100. Each bar is that input's sub-score; the figure is the points it added to the 100-point composite (weight × sub-score).
- ARV discount +13.5/15.0
- Appreciation +10.0/10.0
- Cash flow +7.2/30.0
- Schools +4.2/10.0
- Livability +3.2/5.0
- Rent growth +2.5/5.0
- Condition / age +2.5/5.0
- 1% rule +1.6/10.0
- DSCR +1.4/10.0
$200,000
🖨 Deal sheet (PDF) 📄 Offer letter ✓ Due diligence
Listing remarks
Built in 2022 and located just outside the city limits, this 4-bedroom, 2-bath home offers the perfect mix of newer construction and peaceful country vibes—without giving up convenience. Enjoy a fully fenced backyard that’s ideal for kids, pets, gardening, or weekend get-togethers. With an easy 15-minute drive to Benton or Bryant, you’ll have quick access to shopping, dining, schools, and commuting routes while still coming home to a little more space and privacy.
Key facts
- Newer construction
- Space and privacy
- 7,405 sq ft lot
Tags
Property features AI
Finance
- Financial info: Financing available: VA, FHA, Conventional, or Cash
Exterior
- Parking: Attached garage for 2 cars
- Utilities: Public water; Public sewer
- Home design: Brick and frame exterior
- Construction: Slab foundation; Composition roof with 3-tab shingles
- Exterior features: Level lot; Paved road access
Interior
- Kitchen: Free-standing stove
- Flooring: Wood flooring; Laminate flooring
- Bathrooms: 2 full bathrooms
- Heating & cooling: Central electric heating; Central electric cooling
- Interior features: Wood and laminate floors; Free-standing stove
Neighborhood map
What this means for you Summary
Snapshot
- This is a 4-bed/2.0-bath single-family listed at $200k.
Deal economics
- At list price, monthly cash flow is $-272 ($-3k/yr) — negative.
- To cash-flow at today's rent, offer at most $152k (24.0% below list).
- To meet the 1% rule (rent ≥ 1% of price), the offer needs to be $132k (33.9% below list).
- Recommended offer: $132k (33.9% below list) — sets the bar for 1% rule.
- Cap rate 4.7% vs local median 3.3% in Bauxite — top-decile yield for the area; either an underpriced asset or a hidden risk that comps aren't pricing in. Stress-test before assuming the spread holds.
Location & tenants
- Location reads 63/100 on livability (#187 in AR) — a middle-class / working-renter tenant base. Strengths: cost of living A+, housing A+; Watch: crime F, amenities F, commute F.
- Bryant School District (suburban): math 49% / reading 48% proficiency, ranked #16 of 238 in AR (top 7%) — families likely to look elsewhere, expect single-tenant / working-renter base with shorter leases.
- Zoned schools: Robert L. Davis Elem. School (math 49% / reading 40%, grade F, #143 of 454 statewide, top 36%, 491 students, 70% FRL); Bryant Middle School (math 48% / reading 42%, grade D, #58 of 201 statewide, top 30%, 786 students, 63% FRL); Bryant High School (math 32% / reading 50%, grade F, #43 of 292 statewide, top 15%, 2,199 students, 47% FRL) — zoned schools average 60% FRL vs 32% district-wide (28 pts higher); higher-poverty schools than district average — tighter screening recommended.
- Market conditions: 74 active listings in the ZIP; 446 units permitted in Saline County in 2024 (0 in 5+ unit buildings).
Forward outlook
- In year one you build about $21k of equity ($1k loan paydown + $20k appreciation (10.0% local appreciation)).
- Saline County population projected at +39% by 2050 — long-run rental-demand tailwind backs the buy-and-hold thesis.
- By year 2, paydown + projected appreciation supports a ~$34k cash-out refi (75% LTV) — recoverable capital for the next deal without selling this one.
Negotiation context
- It's been on market 157 days — a 12% lower offer ($176k) is reasonable based on typical stale-listing flexibility.
- 2 sale attempts; this cycle's ask has dropped $25k (11%) from the opening price — seller is motivated, your offer sets the floor, not the list.
Questions for the listing agent
- What do current leases actually rent for vs. the listed asking? Can we see a recent rent roll and the last 12 months of T-12 income?
- It's been on market 157 days. Have you received any prior offers? Is the seller open to a 34% concession, seller financing, or rate buy-down credit?
- Why hasn't it sold? Are there any deal-killer items the seller is aware of (foundation, flood, title, zoning, code violations)?
- Is there a deadline driving the sale (1031 exchange, divorce, estate, relocation)? That informs how much negotiation room exists.
- Schools are D-rated, which usually means shorter tenancies and higher turnover. Who's the typical renter profile here, and what's been the actual vacancy rate?
- Crime grade is F in this area — have there been break-ins, vandalism, or insurance claims at this property in the last 3 years? What carrier currently insures it and at what premium?
- The area grade is low — what's the realistic commute time and amenity access for the typical tenant pool here? Any planned neighborhood developments (good or bad) we should know about?
- What's the average days-on-market for RENTAL listings here right now (not sales)? A rising rental-DOM trend means longer vacancies and softer asking-rent achievability than the comps imply.
- What's the recent tenant-quality profile in this submarket — average credit score on applications, eviction rate, late-payment / NSF rate, and stable-employment percentage? A property-management company in the area should have these aggregated.
- How much new for-sale + rental construction is in the pipeline within 1–3 miles? Heavy new supply typically softens prices + rents 12–24 months out; constrained supply supports both.
Investment metrics
- 1% rule
- 0.66% ✗
- Cap rate
- 4.66%
- Cash-on-cash
- -5.82%
- DSCR
- 0.74
- GRM
- 12.6
CMA / ARV
- ARV (on-the-fly)
- $230,736
- Comps found
- 12
Show comp detail 12 sales within ~0.75 mi
| Address | Dist | Beds/Ba | Sqft | Sold | Price | $/sf | Match |
|---|---|---|---|---|---|---|---|
| 7008 Potomac Trl | 0.31mi | 4/2.0 | 1,699 (+2%) | 4mo | $212,000 | $125 | 80 |
| 7065 Potomac Trl | 0.30mi | 3/2.0 (-1) | 1,651 (-1%) | 4mo | $212,650 | $129 | 76 |
| 8081 Chesapeake Trl | 0.29mi | 3/2.0 (-1) | 1,612 (-4%) | 1mo | $217,900 | $135 | 75 |
| 4089 Kings River Trl | 0.08mi | 4/2.0 | 1,459 (-13%) | 1mo | $190,000 | $130 | 74 |
| 1040 Santa Fe Trl | 0.19mi | 4/2.0 | 1,499 (-10%) | 4mo | $210,000 | $140 | 71 |
| 7033 Potomac Trl | 0.25mi | 4/2.0 | 1,496 (-10%) | 2mo | $207,000 | $138 | 69 |
| 8096 Chesapeake Trl | 0.29mi | 4/2.0 | 1,496 (-10%) | 1mo | $214,000 | $143 | 68 |
| 7081 Potomac Trl | 0.25mi | 3/2.0 (-1) | 1,425 (-15%) | 2mo | $206,725 | $145 | 57 |
| 7080 Potomac Trl | 0.24mi | 3/2.0 (-1) | 1,442 (-14%) | 6mo | $210,000 | $146 | 56 |
| 7048 Potomac Trl | 0.29mi | 3/2.0 (-1) | 1,442 (-14%) | 4mo | $197,650 | $137 | 56 |
| 18556 Parkway Pines Dr | 0.42mi | 4/2.0 | 1,897 (+14%) | 3mo | $329,000 | $173 | 56 |
| 7049 Potomac Trl | 0.30mi | 3/2.0 (-1) | 1,442 (-14%) | 4mo | $198,600 | $138 | 55 |
Match score weights: distance 35% · size 25% · config 20% · recency 20%. Top-matched comps best support the ARV.
Projected returns pro-forma
10.0% appreciation · 3.0% rent growth · sell at horizon
- IRR
- 20.2%
- Equity multiple
- 2.64×
- Total profit
- $91,610
- Equity at exit
- $180,176
- IRR
- 18.4%
- Equity multiple
- 6.06×
- Total profit
- $283,335
- Equity at exit
- $388,556
Cash invested: $56,000 (down + closing). Projections, not guarantees.
Landlord ↔ Tenant lean methodology
- Overall (STATE)
- 92 Strongly Landlord-Friendly
- State Arkansas
- 92 Strongly Landlord-Friendly · R+14
- County
- — inherits STATE
- City
- — inherits STATE
ZIP-level market 72011
- Home prices YoY
- 11.9%
- Active inventory
- 74
- Price-to-rent
- 12.6×
Monthly cashflow live
- Estimated rent
- $1,321 medium interval (Pro) →
- Mortgage (P&I)
- −$1,049
- Tax from tax record
- −$183 /mo · $2,197/yr
- Insurance
- −$83
- HOA
- −$0
- Vacancy / Maint / Mgmt
- −$277
- Net cashflow
- $-272
Break-even live
Sensitivity live
| Price | -10% $-158 | -5% $-215 | +0% $-272 | +5% $-328 | +10% $-385 |
|---|---|---|---|---|---|
| Rent | -10% $-376 | -5% $-324 | +0% $-272 | +5% $-219 | +10% $-167 |
| Rate | -1.0pp $-171 | -0.5pp $-221 | base $-272 | +0.5pp $-323 | +1.0pp $-376 |
UW: 25.0% down · 7.5% · 30yr · 1.5% tax · 5.0% vac · 8.0% maint · 8.0% mgmt
Financing live
Cash to close
- Down payment
- $50,000
- Closing costs
- $6,000
- Reserves months
- —
- Total cash needed
- —
Loan-product check · same deal, 3 products live
Conventional
25% down · 7.5% · 30yr
- Down + closing
- —
- Monthly P&I
- —
- Monthly cashflow
- —
- DSCR
- —
- Eligible?
- —
Personal DTI + credit; lowest rate.
DSCR
20% down · 8.5% · 30yr
- Down + closing
- —
- Monthly P&I
- —
- Monthly cashflow
- —
- DSCR
- —
- Eligible?
- —
No personal income docs; deal must DSCR.
Hard money
10% down · 12.0% · 12mo
- Down + closing
- —
- Monthly P&I
- —
- Monthly cashflow
- —
- DSCR
- —
- Eligible?
- —
Short-term bridge; refi at stabilization.
Listing history 23 events
-
2026-06-22statusdays on market $200,000 Active 157 DOM
-
2026-06-18days on market $200,000 Price Change 154 DOM
-
2026-06-17days on market $200,000 Price Change 153 DOM
-
2026-06-16days on market $200,000 Price Change 152 DOM
-
2026-06-15pricestatusdays on market $200,000 Price Change 151 DOM
-
2026-06-14days on market $210,000 Active 149 DOM
-
2026-06-13days on market $210,000 Active 148 DOM
-
2026-06-10days on market $210,000 Active 146 DOM
-
2026-06-09days on market $210,000 Active 145 DOM
-
2026-06-08days on market $210,000 Active 144 DOM
-
2026-06-07days on market $210,000 Active 143 DOM
-
2026-06-05days on market $210,000 Active 140 DOM
-
2026-06-03days on market $210,000 Active 139 DOM
-
2026-06-02days on market $210,000 Active 138 DOM
-
2026-06-01days on market $210,000 Active 137 DOM
-
2026-05-31days on market $210,000 Active 136 DOM
-
2026-05-31days on market $210,000 Active 135 DOM
-
2026-05-07price $210,000
-
2026-03-19price $215,000
-
2026-01-15$225,000 New Listing
-
2026-01-01historical
-
2025-09-26price $222,500
-
2025-08-16$225,000 New Listing
ⓘ Source: listings_history table (triggers on properties + properties_extension) + one-shot
backfill from property_details.listing_events for pre-trigger history.
Tax reassessment forecast AR · Resets to sale price
- Current annual tax
- $2,197 · $183/mo
- Projected year-2 tax
- $2,197 · $183/mo
- Expected delta
- $0/yr ($0/mo · 0.0%)
ⓘ Screening estimate from a state-policy table — verify with the county assessor before closing.
Nearby sold comps map
Loading sold comps map…
Walkable amenities ~0.75 mi
Loading nearby amenities…
Taxation est. · year 1
- Rental income
- $15,854
- − Mortgage interest
- −$11,203
- − Property taxes
- −$2,197
- − Insurance
- −$1,000
- − Repairs & maintenance
- −$1,268
- − Management
- −$1,268
- − Depreciation
- −$5,818
- Taxable loss
- −$6,901
- Est. tax savings @ 24.0%
- +$1,656
- After-tax cash flow
- $-1,602/yr
For passive investors: Depreciation is non-cash, so a rental often shows a tax loss while cash-flowing — sheltering income. Rental losses are passive: they offset passive income freely, and up to $25,000/yr can offset ordinary (W-2) income if you actively participate and your MAGI is under $100k (phasing out to $0 by $150k); unused losses carry forward. On sale, claimed depreciation is recaptured at up to 25%, and gains may owe capital-gains tax (a 1031 exchange can defer both). Figures are a year-1 estimate at your 24.0% rate — not tax advice; consult a CPA.
Schools (NCES district)
- District
- Bryant School District
- NCES district ID
- 0503690
- Math proficiency
- 49% ▼ -13.00%
- Reading proficiency
- 48% ▼ -8.00%
- Median HH income
- $57,578
- Composite
- 42.28/100
- National rank
- #3266
- State rank
- #16 of 238 in AR
Livability — Bauxite
- Score
- 63/100
- State rank
- #187
- US rank
- #15013
Category grades
Schools grade is shown separately in the Schools card above.
Census & demographics
- Population (ZIP)
- 4,635
Population outlook (Saline County) Hauer SSP2
- Today (2025)
- 140,141 people
- By 2030
- 151,233 · +7.9%
- By 2040
- 173,100 · +23.5%
- By 2050
- 194,368 · +38.7%
- By 2075
- 245,295 · +75.0%
- By 2100
- 279,117 · +99.2%
Race, ethnicity, and origin ACS 2023
- Neighborhood character
- Predominantly White (90%)
- Race & ethnicity
- White 90% Hispanic / Latino 6% Two or more races 3%
- Hispanic origin (detail)
- Mexican 6%
- Common ancestry
- Slovak 1% Portuguese 1% Italian 1%
- Foreign-born
- 2% · Canada
- Languages at home
- 98% English-only · Spanish 2%
Political lean MEDSL · Saline
- 2024 margin
- Solid R (+40.1) · D 28.8% · R 69.0% · Other 2.2%
- 2008→2024 swing
- +0.8pp no change · 2008: -41.0pp · 2024: -40.1pp
- All cycles
- 2024: R+40.1 2020: R+41.2 2016: R+43.5 2012: R+42.7 2008: R+41.0
Not yet ingested
- Civics
- —
Market trends
- HPI YoY
- ▲ 27.39%
- Current HPI
- 258.0513
- Rent YoY
- —
- Metro
- —
- State GDP YoY
- ▲ 3.80%
- F500 in state
- 10
Industry mix (Fortune 500 HQ in AR)
| Industry | F500 HQs | Revenue |
|---|---|---|
| Retail | 1 | $681B |
|
||
| Food / Agriculture | 1 | $53B |
|
||
| Retail / Energy | 1 | $22B |
|
||
| Transportation / Logistics | 1 | $12B |
|
||
| Energy | 1 | $4B |
|
||
Price history
-6.7% since first listed6 events — show timeline
- 2026-05-07 Price Changed $210,000 CARMLS
- 2026-03-19 Price Changed $215,000 CARMLS
- 2026-01-15 Listed $225,000 CARMLS
- 2026-01-01 Listing Removed — CARMLS
- 2025-09-26 Price Changed $222,500 CARMLS
- 2025-08-16 Listed $225,000 CARMLS
Property tax history
+63.7%/yrLatest (2025): $2,197 · +6.1% YoY. Source: county tax records.
Cash-flow waterfall
monthlySold comps — $/sqft
last 12 mo · ≤1 miLoading sold comps…