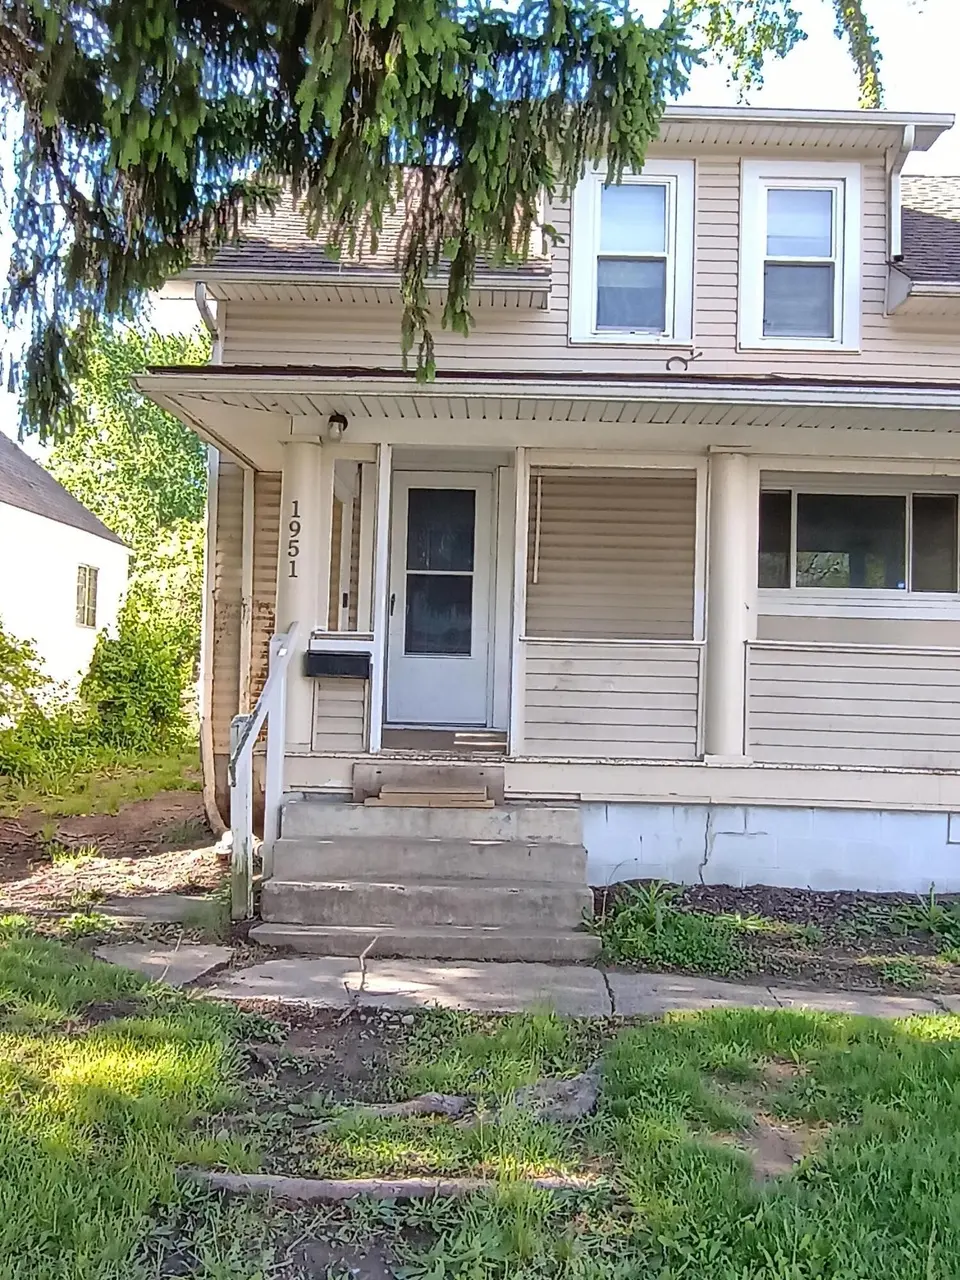
1951 Aberdeen Ave · Columbus, OH
Flood risk 1/10 · Minimal
- FEMA flood zone
- X (unshaded)
- Chance of flooding over 30 yrs
- 0.0%
- Est. flood insurance / yr
- $473 – $860
Fire risk 1/10 · Minimal
- Est. fire insurance / yr
- $713 – $1,323
Heat risk 3/10 · Minor
- Hot days now (above 99°F)
- 7 days/yr
- Hot days in 30 yrs
- 18 days/yr
Wind risk 2/10 · Minimal
- Chance of severe wind over 30 yrs
- 1.0%
Air-quality risk 3/10 · Minor
- Unhealthy air days now
- 2 days/yr
- Unhealthy air days in 30 yrs
- 4 days/yr
Risk factors via First Street. Map © Google.
Why this score? — see what drove the C+ grade
The composite is a weighted blend of 9 inputs, each scored 0–100. Each bar is that input's sub-score; the figure is the points it added to the 100-point composite (weight × sub-score).
- Cash flow +21.6/30.0
- ARV discount +15.0/15.0
- DSCR +6.9/10.0
- 1% rule +5.7/10.0
- Livability +4.0/5.0
- Rent growth +3.4/5.0
- Condition / age +2.5/5.0
- Schools +1.7/10.0
- Appreciation +0.0/10.0
$129,900
🖨 Deal sheet 📄 Offer letter ✓ Due diligence
Listing remarks MLS
Turnkey rental opportunity. Currently rented at $750/month. Tenants rights, please give 24 hour notice for showings. Owner occupants welcome. Do not trespass or disturb tenants.
Key facts
- Hardwood flooring
- Full basement
- Serene surroundings
Tags
Property features AI
Exterior
- Parking: Detached garage (1 space)
- Utilities: Public water; Public sewer
- Home design: Single-family residence; One and one-half stories; Built in 1920; No shared/common walls
- Construction: Block foundation; Built in 1920
- Exterior features: Block foundation; Lot approximately 0.12 acre; Subdivision: East Linden Park Place
Interior
- Bedrooms: One main-level bedroom
- Flooring: Wood flooring; Carpet flooring
- Bathrooms: One full bathroom
- Heating & cooling: Forced air heating; Central air conditioning
- Interior features: Basement present; Living area approximately 1,270
Neighborhood map
What this means for you Summary
Snapshot
- This is a 3-bed/1.0-bath single-family listed at $130k.
Deal economics
- At list price, monthly cash flow is $197 ($2k/yr) — positive.
- The deal already cash-flows at list — no discount required.
- Meets the 1% rule at list price ($1k rent vs $130k).
- Recommended offer: $126k (3.0% below list) — sets the bar for market timing.
- Cap rate 8.1% vs local median 3.8% in Columbus — top-decile yield for the area; either an underpriced asset or a hidden risk that comps aren't pricing in. Stress-test before assuming the spread holds.
Location & tenants
- Location reads 81/100 on livability (#97 in OH, #1,491 nationally) — a professional / high-income tenant draw. Strengths: commute A+, cost of living A+, housing A+; Watch: employment C-, crime F.
- Columbus City School District (urban): math 15% / reading 26% proficiency, ranked #626 of 656 in OH (top 95%) — low school quality limits family demand, transient renter base, plan for 1-2y turnover; 72% free/reduced lunch — lower-income household profile, screen leases tightly.
- Market conditions: Rents rising (+3.4%/yr); 166 active listings in the ZIP; 40 comparable units currently listed for rent nearby; rentals at typical pace (median 24d on market — plan ~3-4 weeks tenant-placement turnaround); lower-income renter base — watch delinquency; 8,139 units permitted in Franklin County in 2024 (5,940 in 5+ unit buildings).
- This rent runs 39% of the median local income ($43k/yr) — at the standard rent-burdened threshold; future hikes will face affordability resistance.
Forward outlook
- Local home prices are declining (-3.0%/yr); year-one equity from $898 of loan paydown is wiped out by about $4k of value loss. Plan a longer hold.
- Franklin County population projected at +34% by 2050 — long-run rental-demand tailwind backs the buy-and-hold thesis.
Negotiation context
- It's been on market 38 days — a 3% lower offer ($126k) is reasonable based on typical stale-listing flexibility.
- 4 sale attempts since 7y ago; this cycle's ask has dropped $15k (10%) from the opening price — seller is motivated, your offer sets the floor, not the list.
- Current owner paid $55k; list at $130k implies a 136% gain — meaningful room to come down on a strong offer.
Risks & watch-outs
- Watch-outs: built in 1920 — expect roof / HVAC / electrical / plumbing capex.
Questions for the listing agent
- It's been on market 38 days. Have you received any prior offers? Is the seller open to a 3% concession, seller financing, or rate buy-down credit?
- Built in 1920 — when were the roof, HVAC, electrical panel, plumbing, and water heater last replaced?
- Is there a deadline driving the sale (1031 exchange, divorce, estate, relocation)? That informs how much negotiation room exists.
- Crime grade is F in this area — have there been break-ins, vandalism, or insurance claims at this property in the last 3 years? What carrier currently insures it and at what premium?
- What's the average days-on-market for RENTAL listings here right now (not sales)? A rising rental-DOM trend means longer vacancies and softer asking-rent achievability than the comps imply.
- What's the recent tenant-quality profile in this submarket — average credit score on applications, eviction rate, late-payment / NSF rate, and stable-employment percentage? A property-management company in the area should have these aggregated.
- How much new for-sale + rental construction is in the pipeline within 1–3 miles? Heavy new supply typically softens prices + rents 12–24 months out; constrained supply supports both.
Investment metrics
- 1% rule
- 1.07% ✓
- Cap rate
- 8.12%
- Cash-on-cash
- 6.51%
- DSCR
- 1.29
- GRM
- 7.8
CMA / ARV
- ARV (median comp)
- $158,203
- List price
- $129,900
- Delta
- -17.89%
- Verdict
- UNDERPRICED
- Comps
- 20 within 1.0 mi
Show comp detail 12 sales within ~0.75 mi
| Address | Dist | Beds/Ba | Sqft | Sold | Price | $/sf | Match |
|---|---|---|---|---|---|---|---|
| 2728 Perdue Ave | 0.46mi | 3/1.0 | 1,224 (-4%) | 2mo | $100,000 | $82 | 71 |
| 1884 E North Broadway St | 0.66mi | 3/1.0 | 1,277 (+1%) | 4mo | $215,000 | $168 | 65 |
| 2765 Joyce Ave | 0.27mi | 4/3.0 (+1) | 1,347 (+6%) | 2mo | $265,000 | $197 | 62 |
| 2823 Fern Ave | 0.37mi | 4/1.0 (+1) | 1,152 (-9%) | 1mo | $129,900 | $113 | 62 |
| 2271 Century Dr | 0.72mi | 3/1.0 | 1,296 (+2%) | 3mo | $110,000 | $85 | 61 |
| 2475 Parkwood Ave | 0.18mi | 4/2.0 (+1) | 1,444 (+14%) | 2mo | $200,000 | $139 | 58 |
| 2407 Marcia Dr | 0.50mi | 4/1.5 (+1) | 1,204 (-5%) | 3mo | $162,500 | $135 | 58 |
| 1691 E Weber Rd | 0.42mi | 2/1.0 (-1) | 1,118 (-12%) | 1mo | $95,000 | $85 | 54 |
| 2227 Marcia Dr | 0.66mi | 4/1.0 (+1) | 1,403 (+10%) | 2mo | $205,000 | $146 | 45 |
| 1671 E Brighton Rd | 0.70mi | 3/2.0 | 1,409 (+11%) | 2mo | $295,000 | $209 | 43 |
| 1525 Aberdeen Ave | 0.62mi | 4/1.0 (+1) | 1,440 (+13%) | 2mo | $135,000 | $94 | 42 |
| 3005 Kenlawn St | 0.73mi | 2/1.5 (-1) | 1,110 (-13%) | 4mo | $170,000 | $153 | 35 |
Match score weights: distance 35% · size 25% · config 20% · recency 20%. Top-matched comps best support the ARV.
Projected returns pro-forma
-3.0% appreciation · 3.41% rent growth · sell at horizon
- IRR
- -5.8%
- Equity multiple
- 0.78×
- Total profit
- $-7,890
- Equity at exit
- $19,369
- IRR
- 4.3%
- Equity multiple
- 1.32×
- Total profit
- $11,771
- Equity at exit
- $11,231
Cash invested: $36,372 (down + closing). Projections, not guarantees.
Landlord ↔ Tenant lean methodology
- Overall (STATE)
- 73 Landlord-Friendly
- State Ohio
- 73 Landlord-Friendly · R+6
- County
- — inherits STATE
- City
- — inherits STATE
ZIP-level market 43211
- Home prices YoY
- -27.3%
- Rents YoY
- 3.4%
- Active inventory
- 166
- Price-to-rent
- 7.8×
Monthly cashflow live
- Estimated rent
- $1,387 high interval (Pro) →
- Mortgage (P&I)
- −$681
- Tax from tax record
- −$163 /mo · $1,954/yr
- Insurance
- −$54
- HOA
- −$0
- Vacancy / Maint / Mgmt
- −$291
- Net cashflow
- $197
Break-even live
UW: 25.0% down · 7.5% · 30yr · 1.5% tax · 5.0% vac · 8.0% maint · 8.0% mgmt
Financing live
Cash to close
- Down payment
- $32,475
- Closing costs
- $3,897
- Reserves months
- —
- Total cash needed
- —
Loan-product check · same deal, 3 products live
Conventional
25% down · 7.5% · 30yr
- Down + closing
- —
- Monthly P&I
- —
- Monthly cashflow
- —
- DSCR
- —
- Eligible?
- —
Personal DTI + credit; lowest rate.
DSCR
20% down · 8.5% · 30yr
- Down + closing
- —
- Monthly P&I
- —
- Monthly cashflow
- —
- DSCR
- —
- Eligible?
- —
No personal income docs; deal must DSCR.
Hard money
10% down · 12.0% · 12mo
- Down + closing
- —
- Monthly P&I
- —
- Monthly cashflow
- —
- DSCR
- —
- Eligible?
- —
Short-term bridge; refi at stabilization.
Rent comps 40 comps
| Address | Beds | Baths | Sqft | Rent | $/sqft | DOM | Units | Dist |
|---|---|---|---|---|---|---|---|---|
| 2590 Parkwood Ave Unit 2590 Columbus, OH | 3.0 | 1.0 | 1152 | $1,400 | $1.22 | 24d | 1 | 0.18mi |
| 2540 Parkwood Ave Columbus, OH | 4.0 | 1.0 | 1374 | $1,400 | $1.02 | 44d | 1 | 0.18mi |
| 2718 Fern Ave Columbus, OH | 3.0 | 1.0 | 1100 | $1,640 | $1.49 | 44d | 1 | 0.19mi |
| 2765 Cleveland Ave Unit B Columbus, OH | 2.0 | 1.0 | 1100 | $990 | $0.90 | 17d | 1 | 0.37mi |
| 1709 E Weber Rd Columbus, OH | 3.0 | 1.0 | 1154 | $1,100 | $0.95 | 44d | 1 | 0.37mi |
| 1695 E Weber Rd Columbus, OH | 4.0 | 2.0 | 1560 | $1,600 | $1.03 | 16d | 1 | 0.39mi |
| 2291 Taylor Ave Columbus, OH | 3.0 | 1.0 | 979 | $1,300 | $1.33 | 44d | 1 | 0.43mi |
| 1928 Agler Rd Columbus, OH | 2.0 | 1.0 | 1000 | $875 | $0.88 | 44d | 1 | 0.47mi |
| 2228 Minnesota Ave Columbus, OH | 2.0 | 1.0 | 1025 | $1,245 | $1.21 | 16d | 1 | 0.48mi |
| 2836-2850 Baughman Ave Unit 2844 Columbus, OH | 2.0 | 1.0 | 1020 | $950 | $0.93 | 16d | 1 | 0.51mi |
| 2844 Baughman Ave Columbus, OH | 2.0 | 1.0 | 1020 | $950 | $0.93 | 16d | 1 | 0.51mi |
| 2707 Woodland Ave Columbus, OH | 3.0 | 1.0 | 957 | $1,400 | $1.46 | 17d | 1 | 0.51mi |
| 2347 Linden Ave Unit 1 Columbus, OH | 2.0 | 1.0 | 1850 | $1,200 | $0.65 | 44d | 1 | 0.53mi |
| 1576-1578 Arlington Ave Unit 1576 Columbus, OH | 2.0 | 1.0 | 902 | $1,000 | $1.11 | 44d | 1 | 0.54mi |
| 1555 Myrtle Ave Columbus, OH | 2.0 | 2.5 | 1200 | $1,500 | $1.25 | 44d | 1 | 0.59mi |
| 1536 E Weber Rd Columbus, OH | 3.0 | 2.0 | 1332 | $1,695 | $1.27 | 20d | 1 | 0.63mi |
| 1536 E Weber Rd Columbus, OH | 3.0 | 2.0 | 1332 | $1,695 | $1.27 | 24d | 1 | 0.63mi |
| 1527 Republic Ave Columbus, OH | 3.0 | 1.0 | 1176 | $1,345 | $1.14 | 44d | 1 | 0.67mi |
| 1527 Republic Ave Columbus, OH | 3.0 | 1.0 | 1176 | $1,299 | $1.10 | 24d | 1 | 0.67mi |
| 1514 Republic Ave Unit 1514 Columbus, OH | 3.0 | 1.5 | 1288 | $1,450 | $1.13 | 24d | 1 | 0.67mi |
| 1624 Kohr Pl Columbus, OH | 3.0 | 1.0 | 1176 | $1,400 | $1.19 | 15d | 1 | 0.68mi |
| 1954 Oakland Park Ave Unit C Columbus, OH | 2.0 | 1.0 | 1000 | $1,050 | $1.05 | 44d | 1 | 0.73mi |
| 2341 Dawnlight Ave Columbus, OH | 3.0 | 1.0 | 920 | $1,550 | $1.68 | 3d | 1 | 0.74mi |
| 1952 Oakland Park Ave Apt A Columbus, OH | 2.0 | 1.0 | 1000 | $1,050 | $1.05 | 44d | 1 | 0.74mi |
| 1952 Oakland Park Ave Unit C Columbus, OH | 2.0 | 1.0 | 1000 | $900 | $0.90 | 24d | 1 | 0.74mi |
| 1435 Republic Ave Columbus, OH | 3.0 | 1.0 | 908 | $1,395 | $1.54 | 8d | 1 | 0.79mi |
| 1435 Republic Ave Columbus, OH | 3.0 | 1.0 | 908 | $1,425 | $1.57 | 20d | 1 | 0.79mi |
| 1577 Cordell Ave Columbus, OH | 2.0 | 1.0 | 882 | $1,000 | $1.13 | 3d | 1 | 0.82mi |
| 2901 Bridgewalk St Unit 2901 Columbus, OH | 3.0 | 1.5 | 950 | $1,295 | $1.36 | 24d | 1 | 0.84mi |
| 1354 Minnesota Ave Columbus, OH | 3.0 | 2.0 | 1350 | $1,800 | $1.33 | 12d | 1 | 0.85mi |
| 2695 Divot Pl Unit 2676 Columbus, OH | 3.0 | 2.0 | 1050 | $1,149 | $1.09 | 44d | 1 | 0.86mi |
| 3257 Cleveland Ave Apt C Columbus, OH | 2.0 | 1.0 | 975 | $1,000 | $1.03 | 44d | 1 | 0.95mi |
| 1269 Minnesota Ave Columbus, OH | 3.0 | 1.0 | 1075 | $1,550 | $1.44 | 8d | 1 | 0.97mi |
| 1410 E Blake Ave Columbus, OH | 3.0 | 1.0 | 1300 | $1,700 | $1.31 | 24d | 1 | 0.98mi |
| 1609-1611 E 26th Ave Columbus, OH | 2.0 | 1.0 | 1080 | $1,150 | $1.06 | 3d | 1 | 1.00mi |
| 1609-1611 E 26th Ave Columbus, OH | 2.0 | 1.0 | 1080 | $1,200 | $1.11 | 24d | 1 | 1.00mi |
| 1652 E 25th Ave Columbus, OH | 3.0 | 1.0 | 1200 | $1,350 | $1.12 | 24d | 1 | 1.01mi |
| 1660 E 25th Ave Columbus, OH | 3.0 | 1.0 | 1200 | $1,350 | $1.12 | 44d | 1 | 1.01mi |
| 1993 Linton Gardens Dr Columbus, OH | 4.0 | 2.5 | 1788 | $1,895 | $1.06 | 16d | 1 | 1.02mi |
| 1612 E 25th Ave Columbus, OH | 3.0 | 1.0 | 1200 | $1,250 | $1.04 | 24d | 1 | 1.03mi |
Listing history 26 events
-
2026-06-18price $129,900 Active 38 DOM
-
2026-06-18days on market $144,900 Active 38 DOM
-
2026-06-17days on market $144,900 Active 37 DOM
-
2026-06-16days on market $144,900 Active 36 DOM
-
2026-06-15days on market $144,900 Active 35 DOM
-
2026-06-13days on market $144,900 Active 33 DOM
-
2026-06-13days on market $144,900 Active 32 DOM
-
2026-06-09days on market $144,900 Active 29 DOM
-
2026-06-08days on market $144,900 Active 28 DOM
-
2026-06-07days on market $144,900 Active 27 DOM
-
2026-06-05days on market $144,900 Active 24 DOM
-
2026-06-03days on market $144,900 Active 23 DOM
-
2026-06-02days on market $144,900 Active 22 DOM
-
2026-06-01days on market $144,900 Active 21 DOM
-
2026-05-31days on market $144,900 Active 20 DOM
-
2026-05-11$144,900 Active 607-char remark
-
2020-02-06soldstatus $55,000
-
2020-01-31soldstatus $55,000 Closed 177-char remark
Show marketing remark (177 chars)
Turnkey rental opportunity. Currently rented at $750/month. Tenants rights, please give 24 hour notice for showings. Owner occupants welcome. Do not trespass or disturb tenants.
-
2019-11-09historical Contingent Finance and Inspection 177-char remark
Show marketing remark (177 chars)
Turnkey rental opportunity. Currently rented at $750/month. Tenants rights, please give 24 hour notice for showings. Owner occupants welcome. Do not trespass or disturb tenants.
-
2019-11-04status Active 177-char remark
Show marketing remark (177 chars)
Turnkey rental opportunity. Currently rented at $750/month. Tenants rights, please give 24 hour notice for showings. Owner occupants welcome. Do not trespass or disturb tenants.
-
2019-06-14status Contingent Finance and Inspection 177-char remark
Show marketing remark (177 chars)
Turnkey rental opportunity. Currently rented at $750/month. Tenants rights, please give 24 hour notice for showings. Owner occupants welcome. Do not trespass or disturb tenants.
-
2019-06-13historical 177-char remark
Show marketing remark (177 chars)
Turnkey rental opportunity. Currently rented at $750/month. Tenants rights, please give 24 hour notice for showings. Owner occupants welcome. Do not trespass or disturb tenants.
-
2019-06-07historical 177-char remark
Show marketing remark (177 chars)
Turnkey rental opportunity. Currently rented at $750/month. Tenants rights, please give 24 hour notice for showings. Owner occupants welcome. Do not trespass or disturb tenants.
-
2019-06-06$55,000 Active 177-char remark
Show marketing remark (177 chars)
Turnkey rental opportunity. Currently rented at $750/month. Tenants rights, please give 24 hour notice for showings. Owner occupants welcome. Do not trespass or disturb tenants.
-
1987-09-17soldstatus $37,500
-
1987-05-20soldstatus $22,100
ⓘ Source: listings_history table (triggers on properties + properties_extension) + one-shot
backfill from property_details.listing_events for pre-trigger history.
Tax reassessment forecast OH · Partial reset (capped growth)
- Current annual tax
- $1,954 · $163/mo
- Projected year-2 tax
- $1,990 · $166/mo
- Expected delta
- +$36/yr (+$3/mo · 1.9%)
ⓘ Screening estimate from a state-policy table — verify with the county assessor before closing.
Climate risk First Street
- Flood 1/10 Low FEMA zone X (unshaded) · 0% chance over 30 yrs
- Wildfire 1/10 Low
- Heat 3/10 Moderate 7 d/yr ≥99°F today · 18 d/yr by 30 yrs out
- Wind 2/10 Low 100% chance of damaging wind over 30 yrs
- Air quality 3/10 Moderate 2 unhealthy d/yr today · 4 by 30 yrs out
Nearby sold comps map
Loading sold comps map…
Walkable amenities ~0.75 mi
Loading nearby amenities…
Taxation est. · year 1
- Rental income
- $16,639
- − Mortgage interest
- −$7,276
- − Property taxes
- −$1,954
- − Insurance
- −$650
- − Repairs & maintenance
- −$1,331
- − Management
- −$1,331
- − Depreciation
- −$3,779
- Taxable income
- $318
- Est. tax owed @ 24.0%
- −$76
- After-tax cash flow
- $2,291/yr
For passive investors: Depreciation is non-cash, so a rental often shows a tax loss while cash-flowing — sheltering income. Rental losses are passive: they offset passive income freely, and up to $25,000/yr can offset ordinary (W-2) income if you actively participate and your MAGI is under $100k (phasing out to $0 by $150k); unused losses carry forward. On sale, claimed depreciation is recaptured at up to 25%, and gains may owe capital-gains tax (a 1031 exchange can defer both). Figures are a year-1 estimate at your 24.0% rate — not tax advice; consult a CPA.
Schools (NCES district)
- District
- Columbus City School District
- NCES district ID
- 3904380
- Math proficiency
- 15% ▼ -17.00%
- Reading proficiency
- 26% ▼ -12.00%
- Median HH income
- $38,483
- Composite
- 17.19/100
- National rank
- #9105
- State rank
- #626 of 656 in OH
Livability — Columbus
- Score
- 81/100
- State rank
- #97
- US rank
- #1491
Category grades
Schools grade is shown separately in the Schools card above.
Census & demographics
- Census place
- Columbus, OH
- County
- Franklin County · 1,351,780 people
- City population
- 612,189
- Metro
- Columbus, OH
- Population (ZIP)
- 22,313
- Household income
- $42,579
- Rent vs Own
- Severe rent burden
- 1282.0
Population outlook (Franklin County) Hauer SSP2
- Today (2025)
- 1,456,139 people
- By 2030
- 1,556,890 · +6.9%
- By 2040
- 1,757,349 · +20.7%
- By 2050
- 1,950,539 · +34.0%
- By 2075
- 2,376,171 · +63.2%
- By 2100
- 2,636,796 · +81.1%
Race, ethnicity, and origin ACS 2023
- Neighborhood character
- Diverse neighborhood (Simpson 0.60)
- Race & ethnicity
- Black 58% White 21% Hispanic / Latino 13% Two or more races 12% Asian 2%
- Hispanic origin (detail)
- Mexican 8% Dominican 1%
- Common ancestry
- Italian 1%
- Foreign-born
- 10% · Canada, India
- Languages at home
- 84% English-only · Spanish 11% Other Indo-European 2% Arabic 1%
Political lean MEDSL · Franklin
- 2024 margin
- Strong D (+28.4) · D 63.7% · R 35.3% · Other 1.0%
- 2008→2024 swing
- +7.7pp toward D · 2008: 20.7pp · 2024: 28.4pp
- All cycles
- 2024: D+28.4 2020: D+31.4 2016: D+25.9 2012: D+21.7 2008: D+20.7
Not yet ingested
- Civics
- —
Market trends
- HPI YoY
- ▼ -94.10%
- Current HPI
- 250.3885
- Rent YoY
- ▲ 3.41%
- Metro
- Columbus, OH
- State GDP YoY
- ▲ 1.98%
- F500 in state
- 48
Industry mix (Fortune 500 HQ in OH)
| Industry | F500 HQs | Revenue |
|---|---|---|
| Insurance | 3 | $145B |
|
||
| Industrial Machinery | 3 | $49B |
|
||
| Financial Services | 3 | $24B |
|
||
| Consumer Goods | 2 | $93B |
|
||
| Aerospace / Defense | 2 | $47B |
|
||
| Utilities | 2 | $33B |
|
||
Price history
+555.7% since first listed11 events — show timeline
- 2026-05-11 Listed $144,900 CBRMLS
- 2020-02-06 Sold (Public Records) $55,000 Public Records
- 2020-01-31 Sold (MLS) $55,000 CBRMLS
- 2019-11-09 Contingent — CBRMLS
- 2019-11-04 Relisted — CBRMLS
- 2019-06-14 Relisted — CBRMLS
- 2019-06-13 Listing Removed — CBRMLS
- 2019-06-07 Listing Removed — CBRMLS
- 2019-06-06 Listed $55,000 CBRMLS
- 1987-09-17 Sold (Public Records) $37,500 Public Records
- 1987-05-20 Sold (Public Records) $22,100 Public Records
Property tax history
+7.7%/yrLatest (2024): $1,954 · +1.3% YoY. Source: county tax records.
Cash-flow waterfall
monthlySold comps — $/sqft
last 12 mo · ≤1 miLoading sold comps…