 🏗️ New Construction
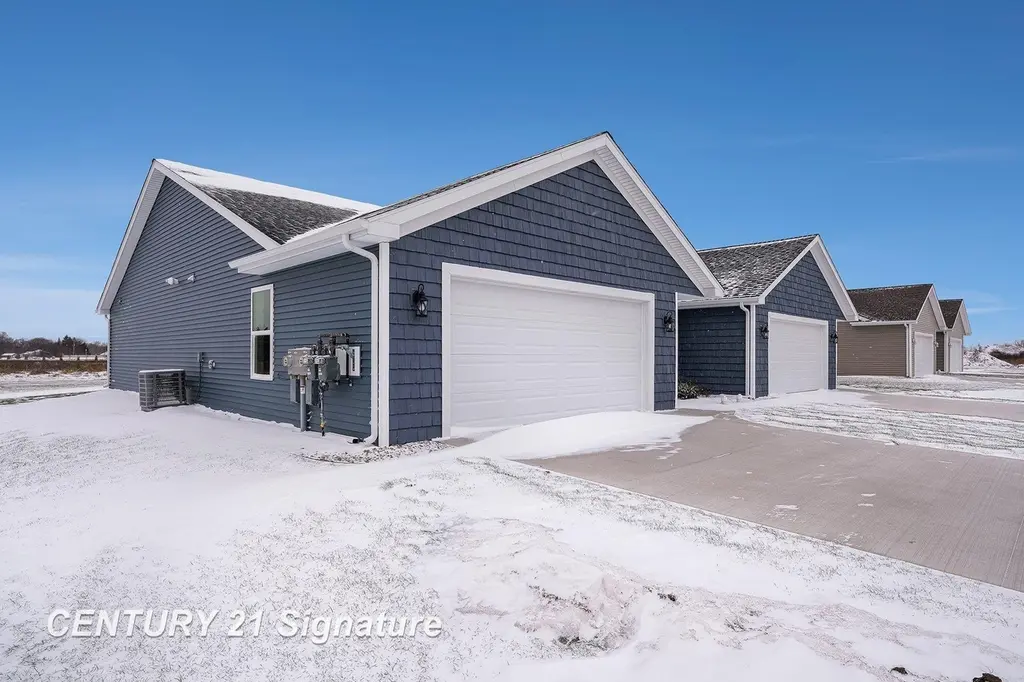
8487 N River Rock Dr · Freeland, MI
Flood risk No data
- FEMA flood zone
- —
- Chance of flooding over 30 yrs
- —
- Est. flood insurance / yr
- —
Fire risk No data
- Est. fire insurance / yr
- —
Heat risk No data
- Hot days now (above threshold)
- —
- Hot days in 30 yrs
- —
Wind risk No data
- Chance of severe wind over 30 yrs
- —
Air-quality risk No data
- Unhealthy air days now
- —
- Unhealthy air days in 30 yrs
- —
Risk factors via First Street. Map © Google.
Why this score? — see what drove the F grade
The composite is a weighted blend of 9 inputs, each scored 0–100. Each bar is that input's sub-score; the figure is the points it added to the 100-point composite (weight × sub-score).
- ARV discount +7.5/15.0
- Schools +5.1/10.0
- Livability +3.6/5.0
- Rent growth +2.5/5.0
- Condition / age +2.5/5.0
- Cash flow +2.2/30.0
- 1% rule +0.0/10.0
- DSCR +0.0/10.0
- Appreciation +0.0/10.0
$3,400
🖨 Deal sheet (PDF) 📄 Offer letter ✓ Due diligence
Listing remarks
Come and check this new construction duplex out! One unit is already rented for above market rate rents (12 month lease). Grab this property to add to your rental portfolio or move into the vacant size for a very reasonably priced new construction unit.
Key facts
- 0.36 acre lot
- 4 garage spots
- Built 2025
Property features AI
Finance
- Financial info: Two units with current rents reported: one at $2,300 and one at $1,900
Exterior
- Parking: Attached garage with garage door opener; 4 garage spaces
- Utilities: Public water; Public sewer
- Home design: Multi-family residential income property; One story; Vinyl siding
- Construction: Vinyl siding construction; Slab foundation; Built with above-grade finished area of 2,800
- Exterior features: Patio; Porch; Public maintained road; Zoned residential
Interior
- Kitchen: Dishwasher; Disposal; Microwave; Oven; Range; Refrigerator; Electric water heater
- Bathrooms: 4 full bathrooms
- Heating & cooling: Central air conditioning; Forced air heating; Natural gas heating; Separate meters for utilities
- Interior features: High ceilings; Walk-in closet(s); Concrete basement
Neighborhood map
What this means for you Summary
Snapshot
- This is a 4-bed/4.0-bath single-family listed at $3k.
Deal economics
- At list price, monthly cash flow is $-2k ($-19k/yr) — negative.
- The deal already cash-flows at list — no discount required.
- Meets the 1% rule at list price ($2k rent vs $3k).
- Recommended offer: $3k (1.5% below list) — sets the bar for market timing.
- Cap rate 2.0% vs local median 3.2% in Freeland — below-typical yield; the buyer is paying a premium for something (appreciation thesis, condition, location) that the cap rate doesn't capture.
Location & tenants
- Location reads 72/100 on livability (#230 in MI) — a middle-class / working-renter tenant base. Strengths: employment A+, cost of living A+, housing A+; Watch: health & safety C-, amenities F, commute F.
- Freeland Community School District (suburban): math 54% / reading 61% proficiency, ranked #46 of 540 in MI (top 8%) — acceptable for families but not a draw, mixed tenant base, ~2y average lease; only 15% free/reduced lunch — higher-income household profile.
- Market conditions: 94 active listings in the ZIP; 154 units permitted in Saginaw County in 2024 (0 in 5+ unit buildings).
Forward outlook
- Local home prices are declining (-3.0%/yr); year-one equity from $3k of loan paydown is wiped out by about $13k of value loss. Plan a longer hold.
- Saginaw County population projected at -25% by 2050 — secular population decline; favor cash flow + early exit over multi-decade hold.
Negotiation context
- It's been on market 23 days — a 2% lower offer ($3k) is reasonable based on typical stale-listing flexibility.
Risks & watch-outs
- Watch-outs: property tax is 196.4% of price.
Questions for the listing agent
- What do current leases actually rent for vs. the listed asking? Can we see a recent rent roll and the last 12 months of T-12 income?
- Property tax is high relative to price — has the assessment been appealed recently, and will the sale trigger a re-assessment?
- Is there a deadline driving the sale (1031 exchange, divorce, estate, relocation)? That informs how much negotiation room exists.
- The area grade is low — what's the realistic commute time and amenity access for the typical tenant pool here? Any planned neighborhood developments (good or bad) we should know about?
- What's the average days-on-market for RENTAL listings here right now (not sales)? A rising rental-DOM trend means longer vacancies and softer asking-rent achievability than the comps imply.
- What's the recent tenant-quality profile in this submarket — average credit score on applications, eviction rate, late-payment / NSF rate, and stable-employment percentage? A property-management company in the area should have these aggregated.
- How much new for-sale + rental construction is in the pipeline within 1–3 miles? Heavy new supply typically softens prices + rents 12–24 months out; constrained supply supports both.
Investment metrics
- 1% rule
- 0.42% ✗
- Cap rate
- 1.98%
- Cash-on-cash
- -15.40%
- DSCR
- 0.31
- GRM
- 19.8
CMA / ARV
- ARV (on-the-fly)
- $445,200
- Comps found
- 12
Show comp detail 12 sales within ~0.75 mi
| Address | Dist | Beds/Ba | Sqft | Sold | Price | $/sf | Match |
|---|---|---|---|---|---|---|---|
| 8442 Cottonwood Dr | 0.34mi | 3/3.0 (-1) | 2,816 (+1%) | 4mo | $399,000 | $142 | 70 |
| 10606 Tall Pine Ln | 0.32mi | 4/3.0 | 2,617 (-6%) | 1mo | $485,000 | $185 | 70 |
| 8643 Ashland Pl | 0.45mi | 4/3.5 | 2,521 (-10%) | 1mo | $400,000 | $159 | 59 |
| 10224 Sarle Rd | 0.73mi | 4/2.5 | 2,800 (0%) | 2mo | $461,000 | $165 | 58 |
| 8311 Goldfinch Rd | 0.52mi | 4/2.5 | 2,854 (+2%) | 10mo | $340,000 | $119 | 58 |
| 8554 Oakhill Dr | 0.29mi | 4/2.5 | 2,462 (-12%) | 6mo | $420,000 | $171 | 55 |
| 8614 Summer Ridge Dr | 0.42mi | 4/3.0 | 2,488 (-11%) | 11mo | $379,000 | $152 | 49 |
| 10909 Sarle Rd. Rd | 0.53mi | 4/3.5 | 2,441 (-13%) | 10mo | $610,000 | $250 | 43 |
| 8981 N Meadows Ct | 0.63mi | 3/3.0 (-1) | 2,940 (+5%) | 12mo | $529,900 | $180 | 43 |
| 8421 Waxwing Dr | 0.56mi | 3/2.0 (-1) | 3,020 (+8%) | 9mo | $329,000 | $109 | 41 |
| 8680 Ashland Pl | 0.48mi | 3/2.5 (-1) | 2,508 (-10%) | 11mo | $379,900 | $151 | 40 |
| 8699 Ashland Pl | 0.47mi | 3/2.0 (-1) | 2,444 (-13%) | 8mo | $365,000 | $149 | 37 |
Match score weights: distance 35% · size 25% · config 20% · recency 20%. Top-matched comps best support the ARV.
Projected returns pro-forma
-3.0% appreciation · 3.0% rent growth · sell at horizon
- IRR
- -46.0%
- Equity multiple
- -0.40×
- Total profit
- $-174,002
- Equity at exit
- $66,381
- IRR
- -85.5%
- Equity multiple
- -1.27×
- Total profit
- $-282,600
- Equity at exit
- $38,493
Cash invested: $124,656 (down + closing). Projections, not guarantees.
Landlord ↔ Tenant lean methodology
- Overall (STATE)
- 62 Landlord-Friendly
- State Michigan
- 62 Landlord-Friendly · EVEN
- County
- — inherits STATE
- City
- — inherits STATE
ZIP-level market 48623
- Home prices YoY
- -26.7%
- Active inventory
- 94
- Price-to-rent
- 0.2×
Monthly cashflow live
- Estimated rent
- $1,870 medium interval (Pro) →
- Mortgage (P&I)
- −$2,335
- Tax est. 1.5%
- −$556 /mo · $6,678/yr
- Insurance
- −$186
- HOA
- −$0
- Vacancy / Maint / Mgmt
- −$393
- Net cashflow
- $-1,600
Break-even live
Sensitivity live
| Price | -10% $-1,292 | -5% $-1,446 | +0% $-1,600 | +5% $-1,754 | +10% $-1,907 |
|---|---|---|---|---|---|
| Rent | -10% $-1,747 | -5% $-1,674 | +0% $-1,600 | +5% $-1,526 | +10% $-1,452 |
| Rate | -1.0pp $-1,376 | -0.5pp $-1,487 | base $-1,600 | +0.5pp $-1,715 | +1.0pp $-1,832 |
UW: 25.0% down · 7.5% · 30yr · 1.5% tax · 5.0% vac · 8.0% maint · 8.0% mgmt
Financing live
Cash to close
- Down payment
- $111,300
- Closing costs
- $13,356
- Reserves months
- —
- Total cash needed
- —
Loan-product check · same deal, 3 products live
Conventional
25% down · 7.5% · 30yr
- Down + closing
- —
- Monthly P&I
- —
- Monthly cashflow
- —
- DSCR
- —
- Eligible?
- —
Personal DTI + credit; lowest rate.
DSCR
20% down · 8.5% · 30yr
- Down + closing
- —
- Monthly P&I
- —
- Monthly cashflow
- —
- DSCR
- —
- Eligible?
- —
No personal income docs; deal must DSCR.
Hard money
10% down · 12.0% · 12mo
- Down + closing
- —
- Monthly P&I
- —
- Monthly cashflow
- —
- DSCR
- —
- Eligible?
- —
Short-term bridge; refi at stabilization.
Listing history 4 events
-
2026-05-26price $3,400
-
2026-05-13soldstatus $3,004 Closed
-
2026-05-06status Pending
-
2026-04-13$519,900 Active
ⓘ Source: listings_history table (triggers on properties + properties_extension) + one-shot
backfill from property_details.listing_events for pre-trigger history.
Tax reassessment forecast MI · Partial reset (capped growth)
- Current annual tax
- $20 · $2/mo
- Projected year-2 tax
- $36 · $3/mo
- Expected delta
- +$16/yr (+$1/mo · 79.3%)
ⓘ Screening estimate from a state-policy table — verify with the county assessor before closing.
Nearby sold comps map
Loading sold comps map…
Walkable amenities ~0.75 mi
Loading nearby amenities…
Taxation est. · year 1
- Rental income
- $22,434
- − Mortgage interest
- −$24,938
- − Property taxes
- −$6,678
- − Insurance
- −$2,226
- − Repairs & maintenance
- −$1,795
- − Management
- −$1,795
- − Depreciation
- −$12,951
- Taxable loss
- −$27,948
- Est. tax savings @ 24.0%
- +$6,708
- After-tax cash flow
- $-12,489/yr
For passive investors: Depreciation is non-cash, so a rental often shows a tax loss while cash-flowing — sheltering income. Rental losses are passive: they offset passive income freely, and up to $25,000/yr can offset ordinary (W-2) income if you actively participate and your MAGI is under $100k (phasing out to $0 by $150k); unused losses carry forward. On sale, claimed depreciation is recaptured at up to 25%, and gains may owe capital-gains tax (a 1031 exchange can defer both). Figures are a year-1 estimate at your 24.0% rate — not tax advice; consult a CPA.
Schools (NCES district)
- District
- Freeland Community School District
- NCES district ID
- 2615060
- Math proficiency
- 54% ▼ -4.00%
- Reading proficiency
- 61% ▼ -3.00%
- Median HH income
- $70,875
- Composite
- 50.98/100
- National rank
- #1779
- State rank
- #46 of 540 in MI
Livability — Freeland
- Score
- 72/100
- State rank
- #230
- US rank
- #5824
Category grades
Schools grade is shown separately in the Schools card above.
Census & demographics
- Census place
- Freeland, MI
- City population
- 15,126
- Population (ZIP)
- 15,126
Population outlook (Saginaw County) Hauer SSP2
- Today (2025)
- 180,568 people
- By 2030
- 172,302 · -4.6%
- By 2040
- 153,919 · -14.8%
- By 2050
- 135,519 · -24.9%
- By 2075
- 97,199 · -46.2%
- By 2100
- 65,037 · -64.0%
Race, ethnicity, and origin ACS 2023
- Neighborhood character
- Predominantly White (86%)
- Race & ethnicity
- White 86% Two or more races 5% Black 5% Hispanic / Latino 3%
- Common ancestry
- Romanian 11% Lithuanian 5% Slovak 2%
- Foreign-born
- 0%
- Languages at home
- 97% English-only · Spanish 2%
Political lean MEDSL · Saginaw
- 2024 margin
- Toss-up / Even · D 47.7% · R 51.0% · Other 1.4%
- 2008→2024 swing
- -20.6pp toward R · 2008: 17.3pp · 2024: -3.3pp
- All cycles
- 2024: R+3.3 2020: D+0.3 2016: R+1.1 2012: D+11.9 2008: D+17.3
Not yet ingested
- Civics
- —
Market trends
- HPI YoY
- ▼ -78.02%
- Current HPI
- 213.8908
- Rent YoY
- —
- Metro
- —
- State GDP YoY
- ▲ 1.37%
- F500 in state
- 28
Industry mix (Fortune 500 HQ in MI)
| Industry | F500 HQs | Revenue |
|---|---|---|
| Automotive Parts | 3 | $48B |
|
||
| Automotive | 2 | $372B |
|
||
| Chemicals | 1 | $45B |
|
||
| Automotive Retail | 1 | $29B |
|
||
| Healthcare / Medical Devices | 1 | $23B |
|
||
| Automotive Technology | 1 | $20B |
|
||
Price history
-99.3% since first listed4 events — show timeline
- 2026-05-26 Price Changed $3,400 REALCOMP
- 2026-05-13 Sold (MLS) $3,004 REALCOMP
- 2026-05-06 Pending — REALCOMP
- 2026-04-13 Listed $519,900 REALCOMP
Cash-flow waterfall
monthlySold comps — $/sqft
last 12 mo · ≤1 miLoading sold comps…